VIP Call Girls Service Dilsukhnagar Hyderabad Call +91-8250192130
ASML Quarterly Earnings Decline in 2009
1. 1
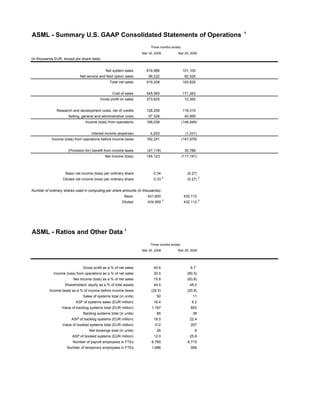
ASML - Summary U.S. GAAP Consolidated Statements of Operations
Three months ended,
Mar 30, 2008 Mar 29, 2009
(in thousands EUR, except per share data)
Net system sales 819,986 101,100
Net service and field option sales 99,222 82,525
Total net sales 919,208 183,625
Cost of sales 545,583 171,263
Gross profit on sales 373,625 12,362
Research and development costs, net of credits 128,259 118,315
Selling, general and administrative costs 57,328 40,995
Income (loss) from operations 188,038 (146,948)
Interest income (expense) 4,203 (1,031)
Income (loss) from operations before income taxes 192,241 (147,979)
(Provision for) benefit from income taxes (47,118) 30,788
Net income (loss) 145,123 (117,191)
Basic net income (loss) per ordinary share 0.34 (0.27)
2 2
Diluted net income (loss) per ordinary share 0.33 (0.27)
Number of ordinary shares used in computing per share amounts (in thousands):
Basic 431,600 432,112
2 2
Diluted 434,959 432,112
ASML - Ratios and Other Data 1
Three months ended,
Mar 30, 2008 Mar 29, 2009
Gross profit as a % of net sales 40.6 6.7
Income (loss) from operations as a % of net sales 20.5 (80.0)
Net income (loss) as a % of net sales 15.8 (63.8)
Shareholders’ equity as a % of total assets 44.5 48.0
Income taxes as a % of income before income taxes (24.5) (20.8)
Sales of systems total (in units) 50 11
ASP of systems sales (EUR million) 16.4 9.2
Value of backlog systems total (EUR million) 1,167 853
Backlog systems total (in units) 65 38
ASP of backlog systems (EUR million) 18.0 22.4
Value of booked systems total (EUR million) 312 207
Net bookings total (in units) 26 8
ASP of booked systems (EUR million) 12.0 25.8
Number of payroll employees in FTEs 6,765 6,715
Number of temporary employees in FTEs 1,686 959
2. 1
ASML - Summary U.S. GAAP Consolidated Balance Sheets
Dec 31, 2008 Mar 29, 2009
(in thousands EUR)
ASSETS
Cash and cash equivalents 1,109,184 1,151,010
Accounts receivable, net 463,273 291,644
Finance receivables, net 6,225 6,193
Current tax assets 87,560 -
Inventories, net 999,150 936,770
Deferred tax assets 71,780 74,850
Other assets 236,077 240,597
Total current assets 2,973,249 2,701,064
Finance receivables, net 31,030 29,250
Deferred tax assets 148,133 173,189
Other assets 88,197 89,519
Goodwill 131,453 139,727
Other intangible assets, net 26,692 25,554
Property, plant and equipment, net 540,640 586,644
Total non-current assets 966,145 1,043,883
Total assets 3,939,394 3,744,947
LIABILITIES AND SHAREHOLDERS’ EQUITY
Current liabilities 1,008,343 1,017,524
Long-term debt 647,050 661,398
Deferred and other tax liabilities 209,699 204,875
Provisions 15,495 16,955
Accrued liabilities and other liabilities 70,038 48,244
Total non-current liabilities 942,282 931,472
Total liabilities 1,950,625 1,948,996
Shareholders’ equity 1,988,769 1,795,951
Total liabilities and shareholders’ equity 3,939,394 3,744,947
3. 1
ASML - Summary U.S. GAAP Consolidated Statements of Cash Flows
Three months ended,
Mar 30, 2008 Mar 29, 2009
(in thousands EUR)
CASH FLOWS FROM OPERATING ACTIVITIES
Net income (loss) 145,123 (117,191)
Depreciation and amortization 29,025 37,876
Impairment 1,551 2,592
Loss on disposals of property, plant and equipment 1,103 2,639
Share-based payments 3,567 3,512
Allowance for doubtful debts 540 (13)
Allowance for obsolete inventory 20,766 22,135
Deferred income taxes 20,589 (27,023)
Change in assets and liabilities 45,088 157,714
Net cash provided by operating activities 267,352 82,241
CASH FLOWS FROM INVESTING ACTIVITIES
Purchases of property, plant and equipment (55,032) (43,903)
Proceeds from sale of property, plant and equipment - 1,200
Net cash used in investing activities (55,032) (42,703)
CASH FLOWS FROM FINANCING ACTIVITIES
Purchase of shares in conjunction with
share-based payment plans (87,605) -
Net proceeds from issuance of shares and stock options 2,975 102
Excess tax benefits (deficiencies) from stock options 4 (221)
Net cash used in financing activities (84,626) (119)
Net cash flows 127,694 39,419
Effect of changes in exchange rates on cash (2,186) 2,407
Net increase in cash & cash equivalents 125,508 41,826
4. ASML - Quarterly Summary U.S. GAAP Consolidated Statements of
Operations 1
Three months ended,
Mar 30, Jun 29, Sep 28, Dec 31, Mar 29,
2008 2008 2008 2008 2009
(in millions EUR, except per share data)
Net system sales 820.0 725.6 590.7 380.5 101.1
Net service and field option sales 99.2 118.6 105.8 113.3 82.5
Total net sales 919.2 844.2 696.5 493.8 183.6
Cost of sales 545.6 506.7 431.1 454.8 171.2
Gross profit on sales 373.6 337.5 265.4 39.0 12.4
Research and development costs, net of credits 128.3 130.2 130.2 127.5 118.3
Selling, general and administrative costs 57.3 56.4 51.9 46.7 41.0
Income (loss) from operations 188.0 150.9 83.3 (135.2) (146.9)
Interest income (expense) 4.2 6.4 7.1 5.0 (1.1)
Income (loss) from operations before income taxes 192.2 157.3 90.4 (130.2) (148.0)
(Provision for) benefit from income taxes (47.1) 34.7 (17.1) 42.2 30.8
Net income (loss) 145.1 192.0 73.3 (88.0) (117.2)
Basic net income (loss) per ordinary share 0.34 0.45 0.17 (0.20) (0.27)
2
Diluted net income (loss) per ordinary share 0.33 0.44 0.17 (0.20) (0.27)
Number of ordinary shares used in computing per share amounts (in thousands):
Basic 431,600 431,221 431,672 431,989 432,112
2
Diluted 434,959 434,585 434,491 431,989 432,112
ASML - Quarterly Summary Ratios and other data 1
Three months ended,
Mar 30, Jun 29, Sep 28, Dec 31, Mar 29,
2008 2008 2008 2008 2009
Gross profit as a % of net sales 40.6 40.0 38.1 7.9 6.7
Income (loss) from operations as a % of net sales 20.5 17.9 12.0 (27.4) (80.0)
Net income (loss) as a % of net sales 15.8 22.7 10.5 (17.8) (63.8)
Shareholders' equity as a % of total assets 44.5 49.7 50.3 50.5 48.0
Income taxes as a % of income before income taxes (24.5) 22.1 (18.9) (32.4) (20.8)
Sales of systems total (in units) 50 39 37 25 11
ASP of system sales (EUR million) 16.4 18.6 16.0 15.2 9.2
Value of backlog systems total (EUR million) 1,167 1,106 1,028 755 853
Backlog systems total (in units) 65 59 53 41 38
ASP of backlog systems (EUR million) 18.0 18.8 19.4 18.4 22.4
Value of booked systems total (EUR million) 312 632 498 127 207
Net bookings total (in units) 26 33 31 13 8
ASP of booked systems (EUR million) 12.0 19.2 16.1 9.8 25.8
Number of payroll employees in FTEs 6,765 6,821 6,907 6,930 6,715
Number of temporary employees in FTEs 1,686 1,649 1,610 1,329 959
5. ASML - Summary U.S. GAAP Consolidated Balance Sheets 1
Mar 30, Jun 29, Sep 28, Dec 31, Mar 29,
2008 2008 2008 2008 2009
(in millions EUR)
ASSETS
Cash and cash equivalents 1,397.1 1,360.9 1,313.0 1,109.2 1,151.0
Accounts receivable, net 741.3 516.7 536.1 463.3 291.6
Finance receivables, net 0.2 0.2 7.4 6.2 6.2
Current tax assets - - - 87.6 -
Inventories, net 1,152.0 1,130.2 1,134.0 999.1 936.8
Deferred tax assets 71.1 69.8 82.8 71.8 74.9
Other assets 267.6 262.2 261.4 236.1 240.6
Total current assets 3,629.3 3,340.0 3,334.7 2,973.3 2,701.1
Finance receivables, net - - 30.7 31.0 29.2
Deferred tax assets 135.8 157.7 139.4 148.1 173.2
Other assets 85.7 39.3 50.6 88.2 89.5
Goodwill 119.7 119.8 129.2 131.5 139.7
Other intangible assets, net 32.5 30.1 28.8 26.7 25.6
Property, plant and equipment, net 401.4 458.1 503.1 540.6 586.6
Total non-current assets 775.1 805.0 881.8 966.1 1,043.8
Total assets 4,404.4 4,145.0 4,216.5 3,939.4 3,744.9
LIABILITIES AND SHAREHOLDERS’ EQUITY
Current liabilities 1,562.3 1,247.3 1,273.0 1,008.3 1,017.5
Long-term debt 615.3 591.6 596.7 647.1 661.4
Deferred and other tax liabilities 261.5 227.0 215.2 209.7 204.9
Provisions - - - 15.5 16.9
Accrued liabilities and other liabilities 7.1 18.5 8.8 70.0 48.2
Total non-current liabilities 883.9 837.1 820.7 942.3 931.4
Total liabilities 2,446.2 2,084.4 2,093.7 1,950.6 1,948.9
Shareholders’ equity 1,958.2 2,060.6 2,122.8 1,988.8 1,796.0
Total liabilities and shareholders’ equity 4,404.4 4,145.0 4,216.5 3,939.4 3,744.9
6. ASML - Summary U.S. GAAP Consolidated Statements of Cash Flows 1
Three months ended,
Mar 30, Jun 29, Sep 28, Dec 31, Mar 29,
2008 2008 2008 2008 2009
(in millions EUR)
CASH FLOWS FROM OPERATING ACTIVITIES
Net income (loss) 145.1 192.0 73.3 (88.0) (117.2)
Depreciation and amortization 29.0 26.5 28.6 36.3 37.9
Impairment 1.5 0.1 0.6 20.5 2.6
Loss on disposals of property, plant and equipment 1.1 1.3 1.4 1.6 2.6
Share-based payments 3.6 3.1 3.7 3.2 3.5
Allowance for doubtful debts 0.5 (0.6) (0.2) 0.2 -
Allowance for obsolete inventory 20.8 11.8 21.3 85.8 22.1
Deferred income taxes 20.6 (54.5) 2.4 (2.7) (27.0)
Change in assets and liabilities 45.1 (49.7) (110.2) (194.3) 157.7
Net cash provided by (used in) operating activities 267.3 130.0 20.9 (137.4) 82.2
CASH FLOWS FROM INVESTING ACTIVITIES
Purchases of property, plant and equipment (55.0) (65.5) (68.3) (71.1) (43.9)
Proceeds from sale of property, plant and equipment - - - - 1.2
Net cash used in investing activities (55.0) (65.5) (68.3) (71.1) (42.7)
CASH FLOWS FROM FINANCING ACTIVITIES
Purchase of shares in conjunction with
share-based payment plans (87.6) - - - -
Dividend paid - (107.4) (0.4) - -
Net proceeds from issuance of shares and stock options 3.0 0.5 1.4 6.5 0.1
Excess tax benefits (deficiencies) from stock options - 6.0 (1.9) (1.9) (0.2)
Redemption and/or repayment of debt - - (1.3) (1.1) -
Net cash provided by (used in) financing activities (84.6) (100.9) (2.2) 3.5 (0.1)
Net cash flows 127.7 (36.4) (49.6) (205.0) 39.4
Effect of changes in exchange rates on cash (2.2) 0.2 1.7 1.2 2.4
Net increase (decrease) in cash & cash equivalents 125.5 (36.2) (47.9) (203.8) 41.8
7. ASML - Notes to the Summary U.S. GAAP Consolidated Financial
Statements
Basis of Presentation
ASML follows accounting principles generally accepted in the United States of America (“U.S. GAAP”).
Further disclosures, as required under U.S. GAAP in annual reports, are not included in the summary
consolidated financial statements. Unless stated otherwise, the accompanying consolidated financial
statements are stated in thousands of euros (‘EUR’).
Principles of consolidation
The consolidated financial statements include the accounts of ASML Holding N.V. and all of its majority-
owned subsidiaries. Subsidiaries are all entities over which ASML has the power to govern the financial and
operating policies generally accompanying a shareholding of more than one half of the voting rights. All
intercompany profits, balances and transactions have been eliminated in the consolidation.
Use of estimates
The preparation of ASML’s consolidated financial statements in conformity with U.S. GAAP requires
management to make estimates and assumptions that affect the reported amounts of assets and liabilities
and the disclosure of contingent assets and liabilities on the balance sheet dates and the reported amounts
of revenue and expense during the reported periods. Actual results could differ from those estimates.
Recognition of revenues
ASML recognizes revenue when all four revenue recognition criteria are met: persuasive evidence of an
arrangement exists; delivery has occurred or services have been rendered; seller’s price to the buyer is
fixed or determinable; and collectibility is reasonably assured. At ASML, this policy generally results in
revenue recognition from the sale of a system upon shipment. The revenue from the installation of a system
is generally recognized upon completion of that installation at the customer site. Each system undergoes,
prior to shipment, a quot;Factory Acceptance Testquot; in ASML's clean room facilities, effectively replicating the
operating conditions that will be present on the customer's site, in order to verify whether the system will
meet its standard specifications and any additional technical and performance criteria agreed with the
customer. A system is shipped, and revenue recognized, only after all specifications are met and customer
sign-off is received or waived. Although each system's performance is re-tested upon installation at the
customer's site, ASML has never failed to successfully complete installation of a system at a customer’s
premises.
For arrangements containing multiple elements, the revenue relating to the undelivered elements is deferred
at estimated fair value until delivery of these elements. Revenue from installation services and service
contracts provided to our customers is initially deferred and is recognized when the installation is completed
and, in case of service contracts, over the life of those contracts. Revenue from extended and enhanced
warranties is recognized in income on a straight-line basis over the contract period. The costs of providing
services under extended and enhanced warranties are recognized when they occur.
8. 1
ASML – Reconciliation U.S. GAAP – IFRS
Net income Three months ended,
Mar 30, 2008 Mar 29, 2009
(in thousands EUR)
Net income under U.S. GAAP 145,123 (117,191)
Share-based payments (see Note 1) (762) (499)
Capitalization of development costs (see Note 2) 21,681 11,515
Income taxes (see Note 3) 418 (1,600)
Net income under IFRS 166,460 (107,775)
Shareholders’ equity Mar 30, Jun 29, Sep 28, Dec 31, Mar 29,
2008 2008 2008 2008 2009
(in thousands EUR)
Shareholders’ equity under U.S. GAAP 1,958,159 2,060,575 2,122,848 1,988,769 1,795,951
Share-based payments (see Note 1) (3,420) (3,266) (7,904) (6,537) (7,088)
Capitalization of development costs (see Note 2) 157,900 176,818 193,780 201,717 215,452
Income taxes (see Note 3) 9,186 8,478 5,969 4,794 3,361
Shareholders’ equity under IFRS 2,121,825 2,242,605 2,314,693 2,188,743 2,007,676
Notes to the reconciliation from U.S. GAAP to IFRS
Note 1 Share-based Payments
Under IFRS, ASML applies IFRS 2, “Share-based Payments” beginning from January 1, 2004. In
accordance with IFRS 2, ASML records as an expense the fair value of its share-based payments with
respect to stock options and stock granted to its employees after November 7, 2002. Under IFRSs, a
deferred tax asset is computed on the basis of the tax deduction for the share-based payments every period
under the applicable tax law and is recognized to the extent it is probable that future taxable profit will be
available against which these deductible temporary differences will be utilized. Therefore, changes in the
Company’s share price do affect the deferred tax asset at period-end and result in adjustments to the
deferred tax asset.
As of January 1, 2006, ASML applies SFAS No. 123(R) “Share-Based Payment” which is a revision of SFAS
No.123. SFAS 123(R) requires companies to recognize the cost of employee services received in exchange
for awards of equity instruments based upon the grant-date fair value of those instruments. FAS 123(R)’s
general principle is that a deferred tax asset is established as the Company recognizes compensation costs
for commercial purposes for awards that are expected to result in a tax deduction under existing tax law.
Under U.S. GAAP, the deferred tax recorded on share-based compensation is computed on the basis of the
expense recognized in the financial statements. Therefore, changes in the Company’s share price do not
affect the deferred tax asset recorded in the Company’s financial statements.
Note 2 Capitalization of development costs
Under IFRS, ASML applies IAS 38, “Intangible Assets”. In accordance with IAS 38, capitalized development
expenditures are amortized over the expected useful life of the related product generally ranging between
one and three years. Amortization starts when the developed product is ready for volume production. In
2008, we recognized an impairment charge for an amount of EUR 18.3 million.
Under U.S. GAAP, ASML applies SFAS No. 2, “Accounting for Research and Development Costs”. In
accordance with SFAS No. 2, ASML charges costs relating to research and development to operating
expense as incurred.
9. Note 3 Income taxes
Under IFRS, ASML applies IAS 12, “Income Taxes” beginning from January 1, 2005. In accordance with IAS
12 unrealized net income resulting from intercompany transactions that are eliminated from the carrying
amount of assets on consolidation, give rise to a temporary difference for which deferred taxes must be
recognized on consolidation. The deferred taxes are calculated based on the tax rate applicable in the
purchaser’s tax jurisdiction.
Under U.S. GAAP, the elimination of unrealized net income from intercompany transactions that are
eliminated from the carrying amount of assets on consolidation, give rise to a temporary difference for which
prepaid taxes must be recognized on consolidation. Contrary to IFRS, the prepaid taxes under U.S. GAAP
are calculated based on the tax rate applicable in the seller’s tax jurisdiction.
quot;Safe Harborquot; Statement under the US Private Securities Litigation Reform Act of 1995: the matters
discussed in this document may include forward-looking statements, including statements made about our
outlook, realization of backlog, IC unit demand, financial results, average sales price, gross margin and
expenses. These forward looking statements are subject to risks and uncertainties including, but not limited
to: economic conditions, credit market deterioration on consumer confidence which could affect our
customers, product demand and semiconductor equipment industry capacity, worldwide demand and
manufacturing capacity utilization for semiconductors (the principal product of our customer base),
competitive products and pricing, manufacturing efficiencies, new product development and customer
acceptance of new products, ability to enforce patents and protect intellectual property rights, the outcome
of intellectual property litigation, availability of raw materials and critical manufacturing equipment, trade
environment, changes in exchange rates and other risks indicated in the risk factors included in ASML’s
Annual Report on Form 20-F and other filings with the US Securities and Exchange Commission.
10. 1
All quarterly information in this press release is unaudited.
2
The calculation of diluted net income per ordinary share assumes the exercise of options issued under ASML stock option plans as such
exercises would have a dilutive effect.