Networks: Some Notes
•
0 gefällt mir•415 views

A presentation I gave for GS 197: Culture and its Global Entanglements, an undergrad class at University of the Philippines Diliman

Empfohlen
Empfohlen
Weitere ähnliche Inhalte
Was ist angesagt?
Was ist angesagt? (16)
Andere mochten auch
Ähnlich wie Networks: Some Notes
Ähnlich wie Networks: Some Notes (20)
Mehr von Diego Maranan
Mehr von Diego Maranan (12)
Kürzlich hochgeladen
Kürzlich hochgeladen (20)
Networks: Some Notes
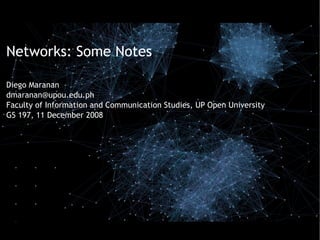
- 1. Networks: Some Notes Diego Maranan dmaranan@upou.edu.ph Faculty of Information and Communication Studies, UP Open University GS 197, 11 December 2008
- 2. slides omitted from last time email addresses issues/questions/reactions from previous class (there are no stupid questions)
- 3. Networks: A special kind of graph ● Graph: A collection of nodes interconnected by paths ● Network: A collection of nodes interconnected by communication paths
- 4. What does this have to do with culture? Analyzing networks may provide answers to interesting and important questions regarding anything that can be represented as a network: bodies of knowledge communities organizations
- 5. Are “artificial” groups consistent with de facto, “naturally-occuring” groups? How robust is the network to ruptures? Who/what is on the periphery? Which are nodes connecting different sub-groups? How should we treat these nodes differently? What does the shape of the network suggest about how knowledge circulates in the network
- 6. Examples
- 7. The Network of Scientific Knowledge (Boyard, 2005) Maps generated using eight different journal- journal similarity measures “Biochemistry appears as the most interdisciplinary discipline in science.”
- 8. The Internet on Jan 16, 2005 www.opte.org
- 9. “This image shows the hierarchical on structure of the Internet, based the connections between individual nodes (such as service providers). Three distinct regions are apparent: an inner core of highly connected nodes, an outer periphery of isolated networks, and a mantle-like mass of peer- connected nodes. The bigger the node, the more connections it has. Those nodes that are closest to the center are connected to http://www.technologyreview.com/player/07/06/19Rowe/1.aspx more well-connected nodes than are those on the periphery.”
- 10. “TheInternetAtare about 80of thenodes core: the center core through which most traffic flows. Remove the core, and 70 percent of the other nodes are still able to function through peer-to-peer connections. http://www.technologyreview.com/player/07/06/19Rowe/2.aspx
- 11. “Thethe Internet At the veryoredge of periphery: are 5,000 so isolated nodes that are the most dependent upon the core and become cut off if the core is removed or shut down. Yet those nodes within this periphery are able to stay connected because of their peer-to-peer connections. http://www.technologyreview.com/player/07/06/19Rowe/3.aspx
- 12. Mycelium (fungi) “Nature's original Internet” (Paul Stamets, 2007)
- 13. The notion of the rhizome (Deleuze and Guattari,1987) ● Connective – Connections are possible at any point ● Heterogenous – Unlike items can be connected ● Robust/“asignifying rupture” – e.g., peer-to-peer connections that allow the Internet to function even when the most highly- connected nodes are remocd
- 14. Network economics Scarcity does not increase value: How useful was it to have owned a fax machine when it first came out? http://flickr.com/photos/nbr/2707844343/sizes/o/
- 15. My facebook network generated using http://nexus.ludios.net Social Networks (1) Social networking
- 16. Subgroups in my network Social Networks: Linking
- 17. nodes connecting subgroups orphaned nodes and subgroups
- 18. Social network analysis Developed at the Human-Computer Interaction Lab at University of Maryland Simultaneously presents statisical analysis alongside social network analysis graph1 SNAs can be used to examine power relations2 Screenshot from http://www.cs.umd.edu/hcil/socialaction [1] Adam Perer, & Ben Shneiderman. (2008). Integrating Statistics and Visualization: Case Studies of Gaining Clarity during Exploratory Data Analysis. In Proceedings of the ACM Conference on Human Factors in Computing Systems. Florence, Italy. [2] e.g., Padgett, J. F., & Ansell, C. K. (1993). Robust Action and the Rise of the Medici, 1400-1434. American Journal of Sociology, 98(6), 1259.
- 20. Some Networked Art Projects I'm Working On
- 21. Open Source Dance http://www.slideshare.net/diegomaranan/open-source-dance-presentation/ Building dance communities through sharing Creative Commons-licensed choreography and tracking the flow of choreographic ideas across dance communities
- 22. Independent Cinema Portal http://www.slideshare.net/diegomaranan/proposal-for-a-portal-to-philippine-cinema-using-data- visualization-techniques-presentation/ Facilitating insights into independent cinemas in the Philippines (but can be extended easily to cover global cinemas) using data publicly available on the web and data visualization techniques
- 23. The Apology Project http://sites.google.com/site/diegomarananprojects/todo/on-hold/The-Apology-Project A Web 2.0 platform for public apologies
- 24. salamat