
Recommended
More Related Content
What's hot
What's hot (20)
Similar to Correlation of height and shoe size
Similar to Correlation of height and shoe size (20)
More from deloti
Recently uploaded
Recently uploaded (20)
Correlation of height and shoe size
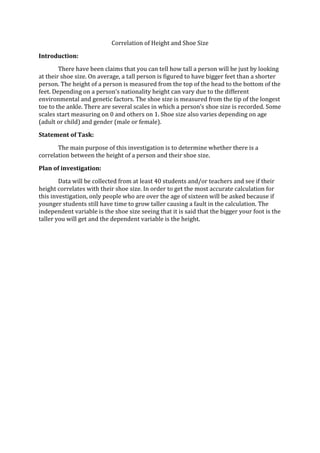
- 1. Correlation of Height and Shoe Size<br />Introduction:<br />There have been claims that you can tell how tall a person will be just by looking at their shoe size. On average, a tall person is figured to have bigger feet than a shorter person. The height of a person is measured from the top of the head to the bottom of the feet. Depending on a person’s nationality height can vary due to the different environmental and genetic factors. The shoe size is measured from the tip of the longest toe to the ankle. There are several scales in which a person’s shoe size is recorded. Some scales start measuring on 0 and others on 1. Shoe size also varies depending on age (adult or child) and gender (male or female).<br />Statement of Task:<br />The main purpose of this investigation is to determine whether there is a correlation between the height of a person and their shoe size.<br />Plan of investigation:<br />Data will be collected from at least 40 students and/or teachers and see if their height correlates with their shoe size. In order to get the most accurate calculation for this investigation, only people who are over the age of sixteen will be asked because if younger students still have time to grow taller causing a fault in the calculation. The independent variable is the shoe size seeing that it is said that the bigger your foot is the taller you will get and the dependent variable is the height.<br />Collected Data<br />Table 1: Height and Shoe Size of 40 students between the ages of 16-19<br /># of StudentsHeightShoe Size# of StudentsHeightShoe Size11535211708.521546221719315462317310415562417485158525174106159726174971606271751281615281751191636291769101647301771011165731178111216563217811131657331781214166103417910.5151679.53517911.5161671036179111716810371801318168938180121917010.53918312.5201709.54018513<br />Table SEQ Table ARABIC 1: Table 1 displays the data that was collected from each number of students for their height and shoe size.<br />Data Analysis/Mathematical Processes<br />First off we will look at a logger pro generated scatter plot of the collected data<br />Graph SEQ Graph ARABIC 1: Graph 1 shows the height vs. shoe size on a scatter plot. So far it seems to have a positive correlation, and its strength is moderate.<br />Standard Deviation Calculations<br />Standard deviation measures the variability/ dispersion of the particular variable, in this case the height and shoe sizes. The formula for the standard deviation is:<br />Sx=x2n-x2 Sy=y2n-y2<br />Standard Deviation forx:<br />Sx=115549640-169.752<br />Sx = 8.613495672<br />8.81 is the standard deviation for x, the height. This indicates a condensed range of data yet sufficient for a statistical analysis.<br />Standard Deviation fory:<br />Sy=3490.75240-9.03752<br />Sy = 2.3648<br />2.36 is the standard deviation for y, the shoe size. This is somewhat the same as the height’s standard deviation; this indicates a condensed range of data although it remains sufficient for statistical analysis.<br />Least Square Regression<br />Least square regression calculations identify the relationship between the independent variable, x, and the dependent variable, y. the least square regression is given by the following equation:<br />y-y= SxySx2 (x-x) where Sxy = xyn - xy<br />Sxy= 6208840- (169.75)(9.0375)<br />Sxy=18.084375 <br />Therefore:<br />y-9.0375=18.08437574.19230769x-169.75<br />y-9.0375=.2437499242x-169.75<br />y-9.0375=.2437499242x-41.38492133<br />y=.2437499242x-50.42242133<br />y=.2437499242x-50.42242133 is the least squares regression equation for this particular set of data. As can be seen later on in graph 2<br />The following is the previously displayed logger pro generated graph with the programmes calculation of the least square regression line.<br />Graph 2: Scatter Plot with Line of best fit<br />Graph SEQ Graph ARABIC 2: this graph indicates that there is a strong correlation. this is also indicated through the value of the correlation coefficient, 0.89913.<br />Line of Best Fit Calculations:<br />y- y= sxysx2x-x<br />y-9.0375=18.0843758.5051455012x-169.75<br />y=0.25x-33.4<br />Parson’s correlation coefficient:<br />Parson’s correlation coefficient indicates the strength of the relationship between the two variables (shoe size vs. height). The formula for the correlation coefficient is:<br /> r=SxySxSy where Sx=(x-x)2n , Sy=(y-y)2nSx=(6790-169.75)240 Sy=(361.5-9.0375)240<br />To which<br />r=SxySxSy= 18.0843758.5051455012.364815682<br />r=0.89913<br />The correlation of determination is used to predict the future outcome based on the data collected, it is given in terms ofr2.<br />To which r2= .8084347569<br />With this being said it is safe to say that the strength of the two variable’s (height and shoe size) correlation is strong.<br />Chi-Square Test<br />Chi-squared test measures the independence of two variables and whether they are related or not. The following equation is used:<br />Observed Values:<br />B1B2TotalA1aba+bA2cdc+dTotala+cb+dN<br />Calculations of Expected Values:<br />B1B2TotalA1a+b(a+c)Na+b(b+d)Na+bA2a+c(c+d)Nb+d(c+d)Nc+dTotala+cb+dN<br />x2=(observed value-expected value)2expected value<br />Degree of freedom measures the number of values in the calculation that can vary:<br />Df=r-1(c-1)<br />r = rowc = column<br />Null Hypothesis: Height and shoe size are independent Alternative Hypothesis: Height and shoe size are not independent<br />Table 2: Observed Values<br />5 -> 910 -> 13Total153 -> 16914418170 -> 18551722Total192140<br />Table SEQ Table ARABIC 2: This table shows the observed values of the Height vs. Shoe Size. Both data sets has been grouped in order to be put in a 2 by 2 table.<br />Table 3: Calculations for the Expected Values:<br />5 -> 910 -> 13Total153 -> 16918(19)4018(21)4018170 -> 18519(22)4021(22)4022Total192140<br />Table SEQ Table ARABIC 3: This table shows the individual calculations for each of the expected values.<br />Table 4: Expected Values<br />5 -> 910 -> 13Total153 -> 1698.559.4518170 -> 18510.4511.5522Total192140<br />Table 4 shows the expected values, retrieved by calculations in table 2.<br />x2=(14-8.55)28.55+(4-9.45)29.45+(5-10.45)210.45+(17-11.55)211.55<br />x2=11.031<br />Df=2-12-1->1 degree of freefom<br />The x^2 critical value at 5% significance with 1 degree of freedom is 3.841. As the chi square value (11.031) > than the critical value, the null hypothesis has been rejected. Hence, the alternative is supported and we can conclude that the height and shoe size are NOT independent.<br />Discussion<br />Data Interpretation<br />Graph 2 clearly shows that the two variables, height and shoe size, not only have a positive linear but they also have a strong correlation. This is supported by the value of r^2 =0.808, which was generated along with the logger pro. Furthermore, it is also supported by the Pearson’s correlation coefficient, which in its turn shows r^2 as 0.808. Thus, all these calculations support the notion that a person’s height is affected by the size of their shoe size.<br />When you look at the chi squared value, x^211.031, you can clearly see that the null hypothesis is not supported, meaning that the alternate hypothesis takes into affect showing that the height is dependent on the shoe size.<br />This should be taken into note that with the height and shoe size being investigated to see if there is a correlation between them, you can clearly see that on normal circumstances the height can be determined by the size of your shoes. Being that the bigger your shoes size the taller you will become.<br />Limitations<br />The limitations of this investigation are that the data that was collected cannot be account for all the people in the world. The data collected was a mixture of all races, ranging from Asians to Europeans, etc. Due to the different ethnic races and ancestry line there could be different outcomes. There are also anomalies where a person that is short can have bigger feet that a person who is taller than them. The data was also collected from both men and women, which have different ranges of shoe sizes. The shoe sizes for women are normally smaller than men’s shoe sizes. Therefore causing the data collected to have a high uncertainty.<br />Another limitation is that seeing that the growth in a person doesn’t stop still a certain age (men 21-25, women 18-21) thus altering their final shoe sizes and height.<br />Appendix <br />Table 5: Coefficient of determination table<br />valueStrength of correlationr2=0No correlationVery weak correlationWeak correlationModerate correlationStrong correlationVery strong correlationr2=1Perfect correlation<br />Table 5: This table shoes the correlation of determintaion in order to find the strength of the data that was collected and put on the scatter plot.<br />Work Citied <br />Coad, Mal, Whiffen, Owen, Haese, Haese, Bruce, Mathematics for the<br />internationalstudent Mathematical Students SL, Adelaide, 2004 <br />