
Empfohlen
Weitere ähnliche Inhalte
Was ist angesagt?
Was ist angesagt? (20)
Ähnlich wie NSOM-TERS for Opaque Samples in Liquid
Ähnlich wie NSOM-TERS for Opaque Samples in Liquid (20)
Mehr von Sisubalan Selvan
Mehr von Sisubalan Selvan (20)
Kürzlich hochgeladen
Kürzlich hochgeladen (20)
NSOM-TERS for Opaque Samples in Liquid
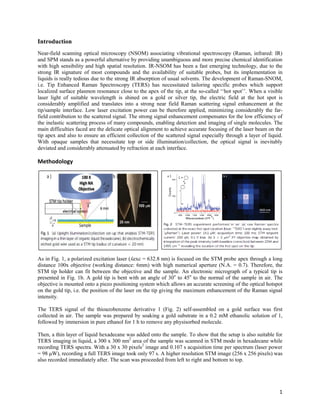
- 1. 1 Introduction Near-field scanning optical microscopy (NSOM) associating vibrational spectroscopy (Raman, infrared: IR) and SPM stands as a powerful alternative by providing unambiguous and more precise chemical identification with high sensibility and high spatial resolution. IR-NSOM has been a fast emerging technology, due to the strong IR signature of most compounds and the availability of suitable probes, but its implementation in liquids is really tedious due to the strong IR absorption of usual solvents. The development of Raman-SNOM, i.e. Tip Enhanced Raman Spectroscopy (TERS) has necessitated tailoring specific probes which support localized surface plasmon resonance close to the apex of the tip, at the so-called ‘‘hot spot’’. When a visible laser light of suitable wavelength is shined on a gold or silver tip, the electric field at the hot spot is considerably amplified and translates into a strong near field Raman scattering signal enhancement at the tip/sample interface. Low laser excitation power can be therefore applied, minimizing considerably the far- field contribution to the scattered signal. The strong signal enhancement compensates for the low efficiency of the inelastic scattering process of many compounds, enabling detection and imaging of single molecules. The main difficulties faced are the delicate optical alignment to achieve accurate focusing of the laser beam on the tip apex and also to ensure an efficient collection of the scattered signal especially through a layer of liquid. With opaque samples that necessitate top or side illumination/collection, the optical signal is inevitably deviated and considerably attenuated by refraction at each interface. Methodology As in Fig. 1, a polarized excitation laser (ʎexc = 632.8 nm) is focused on the STM probe apex through a long distance 100x objective (working distance: 6mm) with high numerical aperture (N.A. = 0.7). Therefore, the STM tip holder can fit between the objective and the sample. An electronic micrograph of a typical tip is presented in Fig. 1b. A gold tip is bent with an angle of 30o to 45o to the normal of the sample in air. The objective is mounted onto a piezo positioning system which allows an accurate screening of the optical hotspot on the gold tip, i.e. the position of the laser on the tip giving the maximum enhancement of the Raman signal intensity. The TERS signal of the thioazobenzene derivative 1 (Fig. 2) self-assembled on a gold surface was first collected in air. The sample was prepared by soaking a gold substrate in a 0.2 mM ethanolic solution of 1, followed by immersion in pure ethanol for 1 h to remove any physisorbed molecule. Then, a thin layer of liquid hexadecane was added onto the sample. To show that the setup is also suitable for TERS imaging in liquid, a 300 x 300 nm2 area of the sample was scanned in STM mode in hexadecane while recording TERS spectra. With a 30 x 30 pixels2 image and 0.107 s acquisition time per spectrum (laser power = 98 μW), recording a full TERS image took only 97 s. A higher resolution STM image (256 x 256 pixels) was also recorded immediately after. The scan was proceeded from left to right and bottom to top.
- 2. 2 Result and Discussions Fig. 2a displays two Raman spectra of 1 collected at the exact hot spot location and also slightly away, highlighting respectively the strong near field signal (TERS) and the extremely weak far-field contribution (microRaman) using only 14.1 mW of laser power. Particularly, the bands at 1143, 1415, 1443 and 1465 cm-1 appear with a large signal/noise ratio as already reported in the literature. A typical Raman mapping of the integrated spectrum intensity between 1394 and 1495 cm-1 during a XY objective map is presented in Fig. 2b and confirms the strong enhancement of the signal around the hotspot location and the abrupt drop of the intensity in its close proximity (600 nm). As in Fig. 2b, screening of the tip hotspot is achieved by performing an objective mapping, i.e. a raster scanning of the objective in the directions parallel (XY) and normal (XZ, YZ) to the sample surface synchronized with the registering of the overall Raman signal intensity, while maintaining the tip at the tunnel contact with the sample. This sample-liquid hexadecane combination represents an ideal system to evaluate the possible screening of the sample signal by the surrounding solvent since the Raman spectrum of pure hexadecane presented in Fig.2 displays several bands that overlap with those of 1. Using this specific solvent that has a low dielectric constant, no electrical insulation of the STM tip is required to avoid current leakage due to electrochemical reactions during tip polarization. The main limitation of the configuration lies in the tip/ liquid meniscus that interferes with the optical path. The height and radius of curvature of this meniscus strongly depends on the diameter and angle of the tip. Under liquid thickness of 2–20 mm, it allows an accurate focusing of the laser on the tip. Under such conditions, search of the hot spot in liquid became possible. The spectra at the exact hotspot (blue) and slightly off (red) can be appeared. Meanwhile, the comparison between low and high resolution STM images shows that a 30 x 30 pixels2 image is sufficient to evidence topography details, like pin holes present over the gold surface. Furthermore, in the high resolution image, the topography is well-described meaning that the STMTERS tip was sharp enough to minimize convolution effects. A TERS map obtained by integrating the band intensity of 1 between 1125 and 1162 cm-1 , reveals that the signal intensity on the lower left part of the image is more intense. Such local intensity fluctuations would never be detected in microRaman. Conclusion To conclude, using an upright optical configuration, it is possible to implement TERS imaging of an opaque sample in contact with an organic liquid, with fast acquisition time and minimal laser power. With this set-up, the efficient excitation/collection of the scattered Raman signal enables extraction of the chemical signature of a molecular monolayer from the one of the surrounding solvent. To achieve such performances, the liquid thickness has to be optimized (around 20 mm at most here), in order to reduce the distortion of the optical path and the loss of signal at the tip/liquid interface (meniscus). These promising results pave the road to TERS imaging in other solvents or electrolytes. Throughout this research, I found out that it is difficult to identify the surface of an opaque sample in organic liquid due to the strong IR absorption of the solvent. So it is necessary to use (Tip-enhanced Raman spectroscopy) TERS at which it requires both confocal microscope and a Scanning Probe Microscope (SPM). With this understanding of the project, I can finally apply this method for my final year project to scan the surface topography of a material especially semiconductor or nanomaterial that soaked into an organic liquid as a medium to be used as an extra testing method. This approach also might help me in the sample characterization to get a more accurate and reliable readings compared to the usual SPM or Raman Spectroscopy.