SlideShare a Scribd company logo
1 of 57
Perceived Racial and Ethnic Composition of
Neighborhood and Perceived Risk of Crime
TED CHIRICOS, Florida State University
RANEE McENTIRE, Florida State University
MARC GERTZ, Florida State University
This paper examines the relationship between perceived racial
and ethnic composition of neighborhood
and criminal threat, which is operationalized as the perceived
risk of criminal victimization. To address this
question, we use interviews with a statewide random sample of
3,000 Florida residents conducted in the fall of
1996. This is the first assessment of this issue to include
Hispanics-the largest and fastest growing minority in
the State-as both respondents and as ethnic "others" whose
presence may be a source of perceived risk for some.
For the full sample, OLS regressions show that perceived risk of
victimization is influenced by the perception that
either Hispanics or blacks live nearby. The effects of the
perception that Hispanics live nearby are consistently
stronger than those associated with the perceived proximity of
blacks. Analyses for subsamples show that whites
are threatened by Hispanics and blacks, but only in South
Florida where they are slightly outnumbered by those
two groups. Hispanics are also threatened by the presence of
blacks and other Hispanics, but only outside of
South Florida where they are greatly outnumbered by blacks and
whites. The results support a core assumption
of the "social threat" perspective, which presumes the
mobilization of social control is influenced by the percep-
tion of criminal threat associated with the perceived proximity
of racial others. These results also suggest that
crime threat may be "ethnicity coded" as well as "race coded"
and may, in certain contexts, have more effect on
those who are in a minority status than on the dominant
majority.
The equation of criminal threat with the presence of blacks is
nothing new in American
culture (Hawkins 1995). But in recent years, the typification of
crime as a black male threat
has achieved iconic proportions. From Willie Horton to Charles
Stuart to Susan Smith, the fac-
ile link of race and crime has been used to gain electoral
advantage and to confound the
search for justice (Anderson 1995).' The same putative threat is
routinely invoked to justify
things as profound as the shooting of unarmed black men by
New York City police and as pro-
saic as the non-delivery of pizza and the "unavailability" of taxi
cabs in predominantly black
neighborhoods (West 1994).
So pervasive is the presumption of criminal threat in relation to
black men that observers
as disparate as James Q. Wilson and the reverend Jesse Jackson
have expressed similar senti-
ments on the issue. In a speech decrying black on black crime,
Jackson acknowledged feeling
"relief" when an approaching urban stranger was not a young
black male (Cohen 1993:A23)
and Wilson argued that "it is not racism that makes whites
uneasy about blacks . .. it is fear.
Fear of crime, of drugs, of gangs, of violence" (1992:A16).
The authors are grateful to Gary Kleck and the anonymous
reviewers for this journal for helpful commentary on
an earlier draft of this paper. An earlier version of this paper
was presented at the annual meeting of the American Soci-
ety of Criminology (November, 1998). Direct correspondence
to: Ted Chiricos, School of Criminology and Criminal Jus-
tice, Florida State University, Tallahassee, FL 32306. E-mail:
[email protected]
1. Stuart in Boston, killed his wife, and Smith in South Carolina
drowned her sons, and for some time in both
cases, police attention was focused on alleged black male
assailants.
SOCIAL PROBLEMS, Vol. 48, No. 3, pages 322-340. ISSN:
0037-7791; online ISSN: 1533-8533
@ 2001 by Society for the Study of Social Problems, Inc. All
rights reserved.
Send requests for permission to reprint to: Rights and
Permissions, University of California Press,
Journals Division, 2000 Center St., Ste. 303, Berkeley, CA
94704-1223.
by guest on N
ovem
ber 27, 2016
http://socpro.oxfordjournals.org/
D
ow
nloaded from
http://socpro.oxfordjournals.org/
Perceived Composition of Neighborhood and Risk of Crime 323
The conflation of race and criminal threat is so well established
that some regard popular
discourse about crime and punishment to be part of the
rhetorical code of "modern racism"
(Entman 1990; Gilens 1996), an implicit objective of which is
thought to be the better control
of young black men (Szkowny 1995). Indeed, it is argued that
recent waves of popular anxi-
ety and punitive legislation-despite falling crime rates-are
directly energized by the pre-
sumed link between race and crime (Chiricos 1996; Tonry
1995).
A similar sentiment underlies the "social threat" approach to the
sociology of social con-
trol. With origins in the seminal work of Blalock (1967), those
developing the social threat
perspective argue that aggregate measures of punitiveness will
vary with aggregate measures
of racial composition because the presence of blacks creates a
fear of crime that helps to mobi-
lize punitive responses. An early thematic expression of this
position was articulated by Liska
and Chamlin who extended social threat inquiry from the
analysis of police department size
(Jackson and Carroll 1981; Liska, et al. 1981) to arrest rates in
relation to the racial composi-
tion of cities:
The threat hypothesis underlying the recent work on police size
suggests that a high percentage of
nonwhites produces an emergent property, "perceived threat of
crime," which increases arrest rates
through increasing pressure on police to control crime
(1984:384-5).
Social threat research has since explored the link between racial
composition of place and
various measures of social control, including rates of arrest
(Harer and Steffensmeier 1992;
Liska, et al. 1985), size and funding of police departments
(Chamlin 1989; Chamlin and Liska
1992; Greenberg, et al. 1985; Jackson 1989), individuals'
chances of incarceration (Myers and
Talarico 1986, 1987) and aggregate rates of imprisonment
(Bridges, et al. 1987; Delone 1992).
At the heart of these structural analyses of racial composition,
social threat and social
control are micro-processes involving the lived experiences of
individuals who are situated in
those structural circumstances.2 The racial composition of a
place can only be consequential
for social control if human actors situated in those social
circumstances are aware of the racial
composition, concerned about it and respond in ways that
mobilize control initiatives. This
approach to understanding how structural relationships function
was explicitly recognized by
Blalock in relation to his "power threat" hypothesis when he
asked, "Why should the size of a
minority affect discrimination ... ?" His answer highlights the
importance of individual level
factors operating through situated actors at the heart of
structural relationships:
In asking this kind of "why" question, one is presumably
requesting that individual motivations be
brought into the picture.... Behind this position, I assume, is the
philosophical assumption that
individual goals, motives and needs are major causal agents in
social systems and that adequate
explanation requires that they be taken into account (1967:28).'
Arguably, the most salient individual level process operating at
the core of social threat
relationships is the perception of criminal danger that may be
associated with the perception
that blacks live nearby.4 It is this relationship which is assumed
by most social threat research,
and it is this relationship which the present study examines. We
are not testing the social
threat hypothesis. But in studying the relationship between
perceived racial composition of
neighborhood and perceived threat of crime, we test a
relationship that is presumptively at
the core of social threat explanations of social control. And, as
noted above, that relationship
2. Giddens notes that social structures exist in and through
individual practices and action. Moreover, social struc-
tures "only exist in the reproduced conduct of situated actors"
(1976:127).
3. Blalock (1967) at various points made reference to the "fear
of competition," "fear of power threat," "perception
of competition," and "personality factors" as "intervening
variables in the analysis" informed by his structural model
linking racial competition and discrimination.
4. Another micro-process embedded within social threat
relationships is the willingness of threatened individuals
to call the police, an issue examined by Warner (1992).
by guest on N
ovem
ber 27, 2016
http://socpro.oxfordjournals.org/
D
ow
nloaded from
http://socpro.oxfordjournals.org/
324 CHIRICOS/McENTIRE/GERTZ
is also understood to play a significant role in popular and
political culture and in the daily
structuring of relations between people of different races.
Specifically, in this study we examine whether the perceived
racial and ethnic composition
of neighborhood is related to the perceived risk of crime for a
random sample of 3,000 Florida
adults interviewed in the fall of 1996. Perceived risk is our
measure of criminal threat and for
reasons described below, we assume the perception of
neighborhood racial composition is
more salient for perceived risk than objective measures of that
structural circumstance. This
is the first study of this question to include Hispanics-the
largest and fastest growing minority
in Florida-as both respondents and as ethnic "others" who may
be the source of criminal
threat to some. Most important, we examine the geographical
and social context of this rela-
tionship. We are especially interested in possible differences
between South Florida-which is
the most racially and ethnically diverse region in the state-and
other parts of Florida.
To the extent that we find the perception of crime risk to be
independently related to the
perception of proximate blacks, we will have support for one
causal linkage presumed to be
operating at the heart of social threat explanations of social
control. We will have evidence as
well, of what some have termed "modern racism" and what
others regard as a seriously debil-
itating feature of contemporary race relations. To the extent that
the proximity of Hispanics is
related to crime threat, and to the extent that we find any of
these relationships to be region-
ally contextual, we may have the kind of micro-level data that
Blalock (1967) recognized as
useful for suggesting prospective modifications in macro-
theories of social control.5
Prior Research: Racial Composition of Place
and Perceived Threat of Crime
To date, eight studies have addressed the relationship between
racial composition of place
and perceived threat of crime. Six use an objective measure of
racial composition. Perceived
criminal threat has been operationalized in several ways,
including alternative measures of
fear and a consistent measure of perceived neighborhood
safety.6 We argue below that per-
ceived risk is a less ambiguous and more accessible measure of
threat and we choose to use it.
None of the studies reviewed here operationalized perceived
threat in terms of perceived risk.
The work of Liska and his colleagues (1982) was expressly tied
to the macro-level ques-
tions of race and social control noted above. Their unit of
analysis was cities (N = 26) and
average levels of perceived neighborhood safety were computed
using 1972-73 NCS data.
There was no mention of statistical significance, but after
controlling for crime rates, percent
non-white produced the strongest Betas in multi-variate
estimates for both white and non-
white perceived safety.7 When rates of inter-racial robbery were
controlled, the effects of racial
composition on fear of crime were greatly reduced for whites,
but not for non-whites
(1982:766).
Qualified support for the hypothesized relationship using
objective measures of racial
composition was reported by Ward, et al., (1986) and
Thompson, et al., (1992). The former
found that in up-state New York during 1980, among
predominantly white, elderly (60+)
respondents, the percentage black in one's census tract was
related to perceived neighborhood
safety-but only among those experiencing health or "mastery"
problems (Ward, et al.
5. Blalock considered one value of conceptualizing "intervening
variables" measured at the individual level to be
"... that a careful micro-level analysis of psychological factors
may suggest modifications in the [power threat] theory"
(1967:29).
6. One problem in the study of crime threat-a problem not
limited to studies of racial composition-is the variety
of measures used to operationalize the concept. "Fear,"
"perceived safety," and "perceived risk" have all been used with
some frequency (Ferraro 1995).
7. In the brief discussion of these findings in their 1981 paper,
Liska, et al., mention that "only percentage nonwhite
has a statistically significant effect" (1981:423).
by guest on N
ovem
ber 27, 2016
http://socpro.oxfordjournals.org/
D
ow
nloaded from
http://socpro.oxfordjournals.org/
Perceived Composition of Neighborhood and Risk of Crime 325
1986:335). The Thompson, et al. (1992) study used 1984
Louisiana survey data (N = 1,850)
and found that the black/white ratio of respondent's county was
related to perceived neigh-
borhood safety but not to fear of crime.
Ralph Taylor and Jeannette Covington did two separate analyses
on the basis of their
1982 Baltimore neighborhood data. In the first, after controlling
for a variety of individual and
neighborhood characteristics, they found lower levels of
perceived safety among people living
in predominantly black (>90%) neighborhoods. They also found
lower levels of perceived
neighborhood safety for those "whose racial identity--whether
black or white-diverges more
from neighborhood racial composition." They concluded:
"regardless of the respondent's race ...
those more different racially from their neighbors have more
fear" (Covington and Taylor
1991:243). Taylor and Covington's (1993) second analysis
focused on changes in minority and
youth populations in 66 neighborhoods between 1970 and 1980.
They found that racial com-
position (% Black) predicted perceived safety (both day and
night) independent of the effects
of incivilities, change in minority youth population, and the
presence of unsupervised teenagers.
Like Covington and Taylor, Chiricos, Hogan, and Gertz (1997)
measured racial composi-
tion at the census block level. Their data, based on a survey of
1,850 Tallahassee, Florida adults
in 1994, generated no significant relationships with fear of
crime-for either blacks or
whites-using this objective measure of racial composition. Their
analysis controlled for crime
victim experience and perceptions of crime trends in one's
neighborhood among other factors.
The Tallahassee study also employed a measure of perceived
racial composition, which
asked respondents to estimate the percentages of blacks and
whites among those living within
a mile of their residence. The low bi-variate correlations
between objective and perceptual
measures of racial composition reported for whites (.16) and for
blacks (.30) in this sample are
not surprising in light of national surveys that show whites in
particular greatly overestimate
the proportion of blacks in the general population (Nedau, et al.
1993). Chiricos, et al.
(1997:120) found that the perceptual measure of racial
composition was related to fear of crime,
though only for white respondents who perceived themselves to
be in the racial minority.
Two other studies examined the impact of perceived racial
composition on perceived threat
of crime. Moeller's (1989) Illinois survey in 1981 (N = 764)
asked respondents to describe
their neighborhood in one of five categories ranging from "all
white" to "all black." By itself,
this measure was unrelated to fear (would be afraid to walk
alone at night) in a multi-variate
estimate. Moeller then combined the perceptual measure with
respondent's race and the mul-
tiplicative interaction term was found to be related to the fear of
crime. The author concluded
that, "we can identify white respondents living in racially mixed
neighborhoods as those most
likely to report fear" (Moeller, 1989:216).
Skogan's (1995) assessment of this issue made use of responses
by 1,396 whites to the
GSS survey for the period of 1988-90. The survey did not ask
about racial composition per se,
but it asked whether "blacks lived nearby" and if yes, "how far
away." The response categories
were: "same block," "1-3 blocks," "4-8 blocks," and "none
nearby." Skogan controlled for a
number of factors, including crime victim experience, and found
that "when all of these fac-
tors are controlled for ... [perceived] residential proximity of
blacks . . . remained indepen-
dently linked to fear" (1995:65).
The evidence to date is generally supportive of the premise that
minority presence-
actual or perceived--is related to perceived threat of crime.
Whether threat is operationalized
in terms of fear of crime (Chiricos, et al. 1997; Moeller 1989;
Skogan 1995; Thompson, et al.
1992) or perceived neighborhood safety (Covington and Taylor
1991; Liska, et al. 1982; Taylor and
Covington 1993; Ward, et al. 1986), each study claims at least
some support for this relation-
ship, especially among white respondents.
But the available evidence is limited in several respects. First,
with the exception of Chiricos,
et al. (1997), the data addressing this question are from ten to
almost thirty years old. Much
has happened in recent years that could be relevant for this
relationship. Most important per-
haps, is the media saturated imaging of crime as a black male
phenomenon (Barak 1994).
by guest on N
ovem
ber 27, 2016
http://socpro.oxfordjournals.org/
D
ow
nloaded from
http://socpro.oxfordjournals.org/
326 CHIRICOS/McENTIRE/GERTZ
Important as well is the increasingly politicized nature of the
"crime problem" and the spate of
"get tough" agendas that have become central features of
political rhetoric on the part of both
major parties at almost all levels of government.
In addition, most of the analyses have been limited to white
respondents. The two excep-
tions (Chiricos, et al. 1997; Liska, et al. 1982) include "black"
and "non-white" respondents
respectively, for whom contradictory results are reported. Also,
in previous studies, the mea-
sure of racial composition is limited to a black/white proportion
or ratio. The present research
includes Hispanic respondents and broadens the measure of
perceived racial composition to
include the proportion Hispanic, as well as the proportion black
and white. The evolving racial
and ethnic mix of many parts of this country clearly warrants
these analytical extensions.
The Present Research
This study examines whether perceived racial and ethnic
composition of one's neighbor-
hood is related to perceived threat of crime independent of other
factors that could predict
threat. We analyze this relationship separately for black,
Hispanic, and white Floridians, and
our measures of perceived racial composition include the
proportion of people living within a
mile who are black, white, or Hispanic. We consider whether
these relationships vary by
region, with particular attention paid to South Florida, which
has exceptionally high levels of
crime, an extraordinary mix of racial and ethnic groups, and a
recent history of vigorous polit-
ical and economic competition.
Sample
In August and September of 1996, we interviewed 3,000 Florida
residents by telephone.
Respondents were randomly chosen from adults (18 years and
older) having the most recent
birthday in households accessed by random digit dialing.s
Spanish-speaking interviewers were
used for calls to predominantly Hispanic areas. The final sample
had the following characteris-
tics, which are compared (in parentheses) with the 1996
demographics for Florida: female,
55% (52%); black, 11% (12%); Hispanic, 14% (14%); age 65 or
over, 15% (18.5%).
Dependent Variable: Perceived Risk of Criminal Victimization
To date, research on racial composition and perceived threat of
crime has operationalized
the latter in three ways. The most common approach asked
respondents "how safe" they feel
in their neighborhoods (Covington and Taylor 1991; Liska, et
al. 1982; Taylor and Covington 1993;
Thompson, et al. 1992; Ward, et al. 1986). This measure is
probably best understood as a cognitive
assessment of risk-posed in general terms (Ferraro and
LaGrange 1987). The presumably
affective state of fear was measured two ways. Moeller (1989)
and Skogan (1995) asked
respondents whether there is an area nearby where they "would
be afraid" to walk alone at
night. This measure of fear is somewhat hypothetical since it
poses a situation that many
people would not allow themselves to encounter (Ferraro 1995).
Two studies asked respon-
dents how much they feared specific crimes (Chiricos, et al.
1997; Thompson, et al. 1992).
8. The survey was conducted by The Research Network, Inc., a
public opinion polling firm in Tallahassee, Florida.
A two-stage Mitofsky-Waksberg sampling design was utilized
and a 10 call-back rule was employed before replacement.
A cooperation rate of 80% was realized, meaning that
interviews were completed for 80% of all contacts with eligible
respondents. Cases of unknown eligibility (busy signals, no
answer, and answering machines) and known ineligibility
(business, fax, and disconnected) were excluded from this
calculation as recommended by the American Association for
Public Opinion Research (1998).
by guest on N
ovem
ber 27, 2016
http://socpro.oxfordjournals.org/
D
ow
nloaded from
http://socpro.oxfordjournals.org/
Perceived Composition of Neighborhood and Risk of Crime 327
Ferraro (1995) argued that crime specific, non-hypothetical
measures are probably the
best approach to measurement in this area. We agree and would
add that it seems reasonable
to expect that some people (e.g., young adult males) would be
more willing and able to assess
their chances of victimization (a cognitive judgment of risk)
than to admit they are afraid. Per-
ceived risk of victimization is arguably a more accessible and
unambiguous measure of criminal
threat than fear. For these reasons, our choice to operationalize
perceived criminal threat is a
crime specific measure of perceived risk of victimization.
Respondents were asked this question:
Now I want you to rate the chance that a specific crime will
happen to you during the coming year.
On a scale from one to ten, where one means not at all likely
and ten means very likely, how likely
do you think it is that you will have your car stolen; have
someone break into your house while
you are away; have someone break into your house while you
are there; be robbed or mugged on
the street; be raped or sexually assaulted; be murdered?
Responses across the six crimes were aggregated for each
respondent into a total risk
index (RISK) with an alpha of .90 for the full sample.
Independent Variables
Recent survey data suggest that perceptions of racial
composition of the national popula-
tion seriously distort reality. Whereas blacks comprised only
12% of the population and His-
panics 9% in 1990, a Gallup survey in that year reported that
"the average American" thinks
that America is 32% black and 21% Hispanic (Nedau, et al.
1993:343). Also, Chiricos, et al.
(1997) reported weak bi-variate correlations between actual and
perceived racial composition
for white (.16) and black (.30) respondents, and that only their
perceptual measure was
related to fear. Moreover, if racial composition of one's
neighborhood is going to be relevant
for criminal threat, it must first be perceived (or misperceived)
and be understood as threaten-
ing. Whatever the actual demographics, how they are perceived
by respondents is what
should matter most in the development of threat. For these
reasons, we use perceived racial and
ethnic composition of neighborhood as our principal
independent variable. It is operationalized
by this question:
If you think about your neighborhood and the people living
within a mile of your house-what
percent of those people would you say are White ... African
American ... Hispanic ... Other?
PRCBLK and PRCHISP are the variable names for the perceived
proportion of blacks and
Hispanics living within a mile of the respondent.
Other independent variables used to model risk of crime in this
study include respon-
dents' AGE, measured continuously, household INCOME (five
categories) and three dummy
variables, BLACK (non-black = 0), HISPANIC (non-Hispanic =
0) and FEMALE (male = 0).
Early research reported a positive association between AGE and
measures of fear (Clemente
and Kleiman 1976; Jaycox 1978) but recent work (Bankston and
Thompson 1989; Ferraro
1995) has found otherwise. FEMALE is the trait most often
associated with high levels of per-
ceived risk or fear (Ferraro and Lagrange 1992; Karmen 1991)
and BLACK respondents con-
sistently report higher fear levels than whites (Ortega and Myles
1987; Parker and Ray 1990).
The latter is attributed to a higher risk of victimization or the
presence of "incivilities" in pre-
dominantly black or poor neighborhoods (Covington and Taylor
1991; LaGrange, et al. 1992).
Similar considerations prompt our expectation that INCOME
and EDUCATION will be
inversely related to perceived risk of victimization. Almost no
risk or fear research includes
Hispanic respondents.
Four crime-related predictors of RISK are included. Two are
perceptual and assess
whether the respondent thinks crime has increased during the
past year in the United States
(CRIMEUS) or in one's neighborhood (CRMHOOD). In both
cases (yes = 1) we expect per-
by guest on N
ovem
ber 27, 2016
http://socpro.oxfordjournals.org/
D
ow
nloaded from
http://socpro.oxfordjournals.org/
328 CHIRICOS/McENTIRE/GERTZ
ceived risk to be associated with perceptions of increasing
crime. Whether or not a member of
the respondent's household has been the victim of a crime in the
past year (HVICTIM) is
included as are 1996 Index crime rates for respondents' city of
residence (CRMTTL96). For all
variables used in these analyses Table 1 reports coding
information, means and standard devi-
ations, as well as bi-variate correlations with perceived risk.9
Research Findings
The data are analyzed using ordinary least squares (OLS)
regression.'" There are no appar-
ent problems of multi-collinearity, with tolerance levels
consistently above .70 and no bi-variate
correlations involving independent variables that exceed .38
(education and income)."
Modified Glesjer tests indicate that the assumption of
homoskedasticity is violated with the vari-
ance of errors associated with several independent variables."
As a result, LIMDEP's (7.0) OLS
which uses White's (1980) correction for heteroskedasticity of
standard errors is employed
and all findings reflect this correction. Except for PRCBLK and
PRCHISP, which are theoreti-
cally central to these analyses, non-significant predictors are
eliminated from the final models
presented here." Cases for which data are missing for any
predictor are also eliminated.
The analysis proceeds in three steps. We first examine the
relationship between perceived
risk of victimization and perceptions that blacks and Hispanics
live nearby, using the full sam-
ple of surveyed respondents. Next, we examine that relationship
for black, Hispanic, and
white respondents separately. And finally, we assess that
relationship for black, Hispanic,
and white respondents living in South Florida, and for those
living elsewhere in the state. The
results reported for the full sample (Table 2) and for the sample
disaggregated by race and eth-
nicity (Table 3) should be considered preliminary to the more
fully developed, regionally con-
textual results reported in Table 4.
Table 2 reports the results of the basic regression estimate for
perceived risk using the
entire sample with both perceived percent black and perceived
percent Hispanic as predictors.'4
Unstandardized coefficients are shown with standard errors in
parentheses. These data show
that perceived risk is significantly higher for females, blacks,
Hispanics, and for those who per-
ceive crime increasing in their neighborhood or the nation and
for those who recently experi-
9. Other variables not discussed above (marital and employment
status) are listed in Table 1 because they were
used in preliminary models of RISK but were non-significant
and eliminated.
10. Because city-level crime rates are used in conjunction with
individual level variables, it is possible that the
assumption of independence of error terms may be violated by
the use of a single level OLS regression strategy. That is,
respondents from the same city may share similarities resulting
from their common locality and the effect of the individ-
ual level predictors may then vary, depending on the city. If this
was the case, multiple level modeling would be neces-
sary to capture the nested structure of individuals within cities,
a strategy that Rountree and Land (1996) used in their
census tract level study of perceived risk. To assess this
possibility, an unconditional two-level model was estimated
using HLM5 to determine if there was evidence of city-to-city
variation. The level 1 model contained all predictors that
were significant for the full sample in the original OLS
estimate. The level 2 model, aggregated at the city level, esti-
mated each level 1 predictor with a random residual, thereby
allowing the errors to be dependent within each city. The
intercept in this model was also estimated with a random
residual to determine if the mean level of perceived risk varied
across cities. Statistical significance of a residual variance in
this model would suggest that there is true variability of the
associated individual-level regression coefficient. Statistical
significance of the residual variance of the intercept would
indicate between-city variation in the mean level of perceived
risk. In this instance, none of the variances was
significant, suggesting that the effect of the predictors and the
mean level of perceived risk do not vary significantly
across cities and that multiple level modeling is not necessary
for these data (Tate 1998).
11. The correlation of BLACK and PRCBLK is .46 and for
HISPANIC and PRCHISP is .50, but these appear
together only in the initial equations for the full sample
reported in Table 2.
12. These include FEMALE, BLACK, HISPANIC, INCOME,
PRCBLK and CRIMEUS.
13. We have theoretically grounded assumptions for the
directions of the relationships involving RISK and one-
tailed tests of significance are used throughout.
14. To simplify presentation, we assume it is clear that racial
and ethnic composition are perceptual measures and it
is unnecessary to say "perceived" every time they are
mentioned.
by guest on N
ovem
ber 27, 2016
http://socpro.oxfordjournals.org/
D
ow
nloaded from
http://socpro.oxfordjournals.org/
Perceived Composition of Neighborhood and Risk of Crime 329
Table 1 * Variables Used in the Analysis, Including Bivariate
Correlations with Risk
Variable Name Description and Coding Mean Std. Dev. Risk
Dependent variable
RISK Index-R's overall perceived risk of 21.44 13.24
crime for six crimes. Scale 6-60
(highest risk)
Independent variables
PRCBLK Perceived percentage of Blacks in 19.05 21.88 .137*
neighborhood. Scale 0-100
PRCHISP Perceived percentage of Hispanics in 14.49 22.25
.233*
neighborhood. Scale 0-100
AGE Age of respondent at last birthday 44.38 16.84 -.072*
FEMALE Sex of Respondent .55 .50 .221*
1 = Female, 0 = Male
BLACK Race of respondent--Black .1067 .3087 .166*
1 = Black, 0 = All others
HISPANIC Race of respondent-Hispanic .1400 .3470 .267*
1 = Hispanic, 0 = All others
CRIMEUS Crime in U.S. has increased (perceived) .8518 .3554
.142*
1 = Yes, 0 = No
CRMHOOD Crime in neighborhood has increased .3103 .4627
.114*
(perceived) 1 = Yes, 0 = No
EDUC R's highest level of schooling completed 2.95 1.16 -
.193*
1 = Less than high school
2 = High school / GED
3 = Some college/AA
4 = College graduate
5 = Graduate/Professional
INCOME R's household income past year 2.82 1.20 -.183*
1 = <$15,000
2 = 15,000-29,000
3 = 30,000-49,000
4 = 50,000-75,000
5 = >75,000
CRMTIL96 UCR Index crime rate by city, 1996 10456 4233
.158*
HVICTIM Member of R's household been a .16 .37 .098*
victim of crime in past year
1 = Yes, 0 = No
MARRIED R is currently married .57 .50 -.021*
1 = Yes, 0 = No
EMPLOYED R is currently employed .68 .47 -.026*
1 = Yes, 0 = No
enced criminal victimization. Lower levels of RISK are reported
for respondents with higher
income and education.
Table 2 also shows that for the full sample, PRCBLK and
PRCHISP are both significantly
related to RISK independent of the effects of other predictors,
most importantly, respondent's
victimization experience and their perceptions of crime trends.
This is the first reported evi-
by guest on N
ovem
ber 27, 2016
http://socpro.oxfordjournals.org/
D
ow
nloaded from
http://socpro.oxfordjournals.org/
330 CHIRICOS/McENTIRE/GERTZ
Table 2 * Regression of Risk of Crime on Racial/Ethnic
Composition of Neighborhood
With and Without Controls for Crime Rates--Full Samplea
Variable Risk
FEMALE 5.328***
(.541)
BLACK 7.475***
(1.196)
HISPANIC 6.612***
(1.039)
CRIMEUS 3.298***
(.689)
CRMHOOD 1.967***
(.600)
EDUC -1.070***
(.262)
INCOME -.655**
(.255)
HVICTIM 3.149***
(.719)
CRMTTL96 .190 x 10-3**
(.665 X 10-4)
PRCBLK .032*
(.017)
PRCHISP .083***
(.018)
Constant 14.397
Adjusted R2 .238
N 1769
a Unstandardized coefficients and (standard errors) reported.
* p < .05 ** p < .01 *** p < .001
dence of a link between ethnicity (PRCHISP) and the perceived
threat of crime and it indicates
that such threat is more broadly socially structured than has
been previously described.
For Table 2, standardized Beta coefficients, which are available
on request, suggest that
PRCHISP (.136) is a stronger predictor than PRCBLK (.054)
and stronger as well than victim
experience, crime rates, perceptions of crime trends, income and
education. The Beta value
for PRCBLK is actually smaller than those of all other
predictors. For the full sample of Florida
adults then, the perception that Hispanics live nearby is
apparently more threatening in terms
of crime victim risk than perceptions concerning blacks.
In previous research, a relationship between racial composition
of place and "fear of
crime" is most consistently reported for white respondents
(Liska, et al. 1982; Moeller 1989;
Skogan 1995) and the most recent of these studies (Chiricos, et
al. 1997) found that fear of
crime was related to perceived percent black only among white
respondents. Table 3 shows sep-
arate regression results for RISK among Hispanic, black and
white respondents.
For all three groups, females and respondents with lower
education are more likely to per -
ceive risk of victimization but the influence of other predictors
varies by race and ethnicity of
by guest on N
ovem
ber 27, 2016
http://socpro.oxfordjournals.org/
D
ow
nloaded from
http://socpro.oxfordjournals.org/
Perceived Composition of Neighborhood and Risk of Crime 331
Table 3 * Regression of Risk of Crime on Racial/Ethnic
Composition of
Neighborhood-Racial/Ethnic Subsamplesa
Variable Hispanics Blacks Whites
FEMALE 6.444*** 10.609*** 4.578***
(1.749) (1.973) (.542)
CRIMEUS 8.246*** n.s. 2.697***
(2.500) (.677)
CRMHOOD n.s. 5.320** 1.737**
(2.082) (.605)
EDUC - 1.828** -2.907*** - .867***
(.785) (.873) (.256)
INCOME - 1.632* n.s. n.s.
(.794)
HVICTIM n.s. n.s. 2.742***
(.782)
CRMTTL96 -.626 X 10-4 .487 x 10-3* .197 X. 10-3**
(.228 X 10-3) (.262 X 10-3) (.645 X 10-4)
PRCBLK .087* -.024 .039*
(.047) (.032) (.019)
PRCHISP .088*** .064 .074**
(.028) (.067) (.023)
Constant 24.105 23.677 12.634
Adjusted R' .171 .176 .114
N 270 216 1364
a Unstandardized coefficients and (standard errors) reported.
* p < .05 ** p < .01 *** p < .001
respondent. For example, victim experience increases perceived
risk only for whites while
higher income reduces RISK only for Hispanics. More
important for our central concern is the
fact that neither PRCBLK nor PRCHISP are significant
predictors of perceived victimization risk
among black respondents, but both are significant predictors of
RISK for Hispanics and whites.
Looked at more closely, the results for black respondents
suggest two things. First, the
perception that blacks live nearby in greater numbers may
actually reduce perceived victim risk
among African Americans, while the perception that Hispanics
live nearby increases that risk.
The lack of statistical significance for these results (especially
involving PRCHISP) may be a
function of the small sample size for black respondents, but the
pattern may be worth further
study. Unreported Beta coefficients show that for Hispanic and
white respondents, PRCHISP is
not only a stronger predictor of RISK than PRCBLK, but the
perception that Hispanics live
nearby is-after FEMALE-the strongest predictor of victim risk
for both groups.
To this point we know that for all Floridians, and for specific
demographic groups, ethnic
threat associated with Hispanics is more consequential than
racial threat associated with
blacks in the genesis of perceived victimization risk. Whether
this pattern is consistent across
all of Florida or is limited to South Florida, which has a
substantial Hispanic population, is
examined next.
As noted above, South Florida is among the most racially and
ethnically diverse areas in
by guest on N
ovem
ber 27, 2016
http://socpro.oxfordjournals.org/
D
ow
nloaded from
http://socpro.oxfordjournals.org/
Table 4 * Regression of Risk of Crime on Racial/Ethnic
Composition of Neighborhood for South Florida and Not South
Florida-Racial/Ethnic Subsamplesa
Hispanics Blacks Whites
Not Not Not
Variable South Florida South Florida South Florida South
Florida South Florida South Florida
AGE n.s. n.s. - .095 .168* n.s. n.s.
(.101) (.086)
FEMALE 4.858* 13.097*** 6.006* 12.958*** 5.088***
4.379***
(2.176) (2.038) (3.242) (2.482) (1.162) (.612)
CRIMEUS 7.439** 8.938*** n.s. n.s. 2.874* 2.581***
(3.198) (2.815) (1.538) (.753)
CRMHOOD n.s. n.s. 6.627* 2.913 3.251** 1.326*
(3.001) (2.767) (1.192) (.698)
EDUC - 1.685* - 1.904* -3.357** - 3.015** -.089 -1.087***
(1.010) (1.122) (1.314) (1.115) (.544) (.289)
INCOME - 2.052* .221 n.s. n.s. n.s. n.s.
(.959) (1.135)
HVICTIM n.s. n.s. n.s. n.s. -(1.253 3.796***
.496) (.912)
CRMTTL96 -.453 X 10-3 -.457 X 10-' -.670 X 10-3 .276 X 10-3
.261 X 10-3* .199 X 10-**
(.397 X 10-3) (.311 X 10-3) (.625 X 10-3) (.377 X 10-3) (.138
X 10-3) (.793 x 10-4)
PRCBLK .042 .202** -.073 .007 .105** .030
(.056) (.080) (.055) (.040) (.044) (.021)
PRCHISP .044 .128* -.085 .114 .091"** .057
(.034) (.061) (.104) (.071) (.027) (.039)
P Level Slope Difference for PRCBLK P = .051 P = .119 P =
.062
P Level Slope Difference for PRCHISP P = .115 P = .057 P =
.236
Constant 35.330 13.811 53.057 17.366 7.621 13.704
Adjusted R2 .105 .416 .118 .225 .125 .110
N 195 75 79 134 321 1043
a Unstandardized coefficients and (standard errors) reported.
* p < .05 ** p < .01 *** p < .01
Cc
rrl
N
by guest on N
ovem
ber 27, 2016
http://socpro.oxfordjournals.org/
D
ow
nloaded from
http://socpro.oxfordjournals.org/
Perceived Composition of Neighborhood and Risk of Crime 333
the country. Dade County (Miami) is 56% Hispanic and 20%
black." Growing proportions of
Hispanics pose both an economic and political threat not only to
whites but to blacks as well.'6
This is amplified by the fact that many Cuban immigrants are
economically successful and
quite active politically in parts of South Florida. In
demographic, social, cultural, and other
ways, South Florida is different from the rest of the state. The
question is whether South Florida
makes a contextual difference for how the perceived racial and
ethnic composition of neighbor -
hoods relate to perceived risk of crime.
To address this question, we divided our sample into those who
live in "South Florida"
and those who do not. For these purposes, South Florida is
defined as comprising Broward,
Dade, Monroe and Palm Beach counties, which together have a
population of 4,420,000 or
31% of the entire state. As illustrated in Figure 1, this is the
extreme southeastern tip of Florida
where the population is 32% Hispanic and 19% black. The
remainder of the state, excluding
this area, is 6% Hispanic and 12% black. Looked at another
way, South Florida as we define
it, contains 70% of the state's Hispanic population and 41% of
blacks in the state.
Table 4 summarizes the results of regression estimates of RISK
for those who do and do
not live in South Florida. Separate results are reported for
Hispanic, black, and white respon-
dents. We report as well, the p-levels associated with tests for
the significance of differences
between slopes in the "South Florida" and "Not South Florida"
contexts for PRCBLK and
PRCHISP.
The results in Table 4 show that regardless of where they live,
perceived risk of victimiza-
tion among black respondents is not significantly related to
these measures of perceived racial
and ethnic composition of neighborhood. Again, the small N's
involved likely mitigate the
possibility of significant coefficients for black respondents, but
the signs of the relationship
suggest that within South Florida, the perceived presence of
other blacks or Hispanics, is asso-
ciated with lower perceptions of criminal risk for black
respondents.
The picture for Hispanics and whites is quite different. Both
PRCBLK and PRCHISP pre-
dict RISK for Hispanics-but only if they live outside of South
Florida. And for whites, PRCBLK
and PRCHISP predict RISK-but only for those living within
South Florida. The only statisti-
cally significant regional slope difference in Table 4 involves
PRCBLK among Hispanics, but
two other differences are close to the p < .05 standard.
In sum, it is clear that in the racially and ethnically diverse
context of South Florida, the
threat inducing effects of PRCBLK and PRCHISP are limited to
white respondents. Outside of
South Florida, there are no significant effects of racial and
ethnic composition of neighbor-
hood for whites. But at the same time, outside of South Florida,
Hispanic respondents are threat-
ened in relation to the perceived proximity of other Hispanics
and blacks. The small N's for black
and Hispanic subsamples warrant caution when interpreting
these region specific results.
Discussion
This is the first study of perceived crime threat posed by racial
or ethnic minorities that
includes Hispanic respondents and includes the perceived
proximity of Hispanic residents as a
possible inducement to that threat. This is also the first
assessment of this issue to use crime-
specific risk as a measure of threat, and the first to control for
actual levels of crime using data
more recent than 1982 (Taylor and Covington 1993). By
comparing results from "South Florida"
with those from elsewhere in the state this study provides the
first attempt to determine
whether the relationship between perceived threat and perceived
racial or ethnic composition of
neighborhood is regionally contextual. Our findings are briefly
summarized and then discussed.
15. In 1960, Dade was 5.4% Hispanic and 14.7% black (Warren,
et al. 1990:159).
16. "While the analogy is exaggerated to be sure, former city of
Miami Mayor Maurice Ferre's description of
Miami as the 'Beirut of the West' suggests the depth of the
cleavages that have existed" (Warren, et al. 1990:176).
by guest on N
ovem
ber 27, 2016
http://socpro.oxfordjournals.org/
D
ow
nloaded from
http://socpro.oxfordjournals.org/
334 CHIRICOS/McENTIRE/GERTZ
& aa Holme W O 0 ackson cn r BWash- h ingtadsde Hamilto
Bay nou n s Libert Wakulla wane E
ulf a5 naylor La- Clay Iis Alachua hrisu Dixi hPutna U
Levy Marion
Citrus 1v
Hernando Orge
Pasco sceola
Pinellas Polk Indian ver anate Harde Okee- High hobet.e
Sarasota Desoto land rtin
harlottt Glades REM
Lee Hendry
Monroe
..AW d10~
Figure 1 * Map of Florida, Highlighting South Florida
1. For the full sample, and for Hispanic and white subsamples,
the perception that either
blacks or Hispanics live nearby elevates RISK, independent of
the effects of local crime
rate. However, the nature of those relationships is importantly
conditioned by
whether respondents live in South Florida or not.
2. For black respondents perceived racial and ethnic
composition of neighborhood is not
significantly related to perceived risk. However, there is some
indication that the per-
ceived proximity of other blacks reduces RISK and the
perceived proximity of Hispan-
ics increases RISK for blacks, especially outside of South
Florida.
by guest on N
ovem
ber 27, 2016
http://socpro.oxfordjournals.org/
D
ow
nloaded from
http://socpro.oxfordjournals.org/
Perceived Composition of Neighborhood and Risk of Crime 335
3. For Hispanic respondents living in South Florida, the
perceived proximity of blacks or
other Hispanics is unrelated to RISK. For Hispanics living
outside of South Florida,
blacks and Hispanics living nearby elevate RISK.
4. White respondents living outside of South Florida express no
perceived victim risk in
relation to the perceived proximity of blacks or Hispanics.
Within South Florida,
whites perceive greater RISK when either blacks or Hispanics
are thought to live
nearby.
The finding that perceived risk of criminal victimization is
elevated by the perception that
blacks live in one's neighborhood is consistent with "race
coding" (Gilens 1996), a kind of a
shorthand equation between blackness and crime. Such coding
may play into a diffuse and
generalized "anti-black affect" which is described by some as
central to "modern racism" (Ent-
man 1990, 1992). The use of color as a proxy for danger is
consistent as well with what has
been termed "reasonable" racial discrimination and finds
expression in well publicized
"profiling" of suspects by law enforcement, and the innumerable
suspicions and exclusions
that characterize everyday inter-racial interaction (Kennedy
1997; West 1994).
Though not a test of "social threat" per se, this finding is also
consistent with an essential
micro-process that lies at the core of the social threat
perspective. The only way that racial
composition of place could come to have consequence for social
control initiatives is if people
situated in those circumstances, perceive the racial composition,
experience threat, and then
act in ways that mobilize control. Our data cannot speak to the
mobilization of control, but
the antecedent elements necessary for that mobilization are
demonstrated by these findings.
More important perhaps, is the finding that the threat of crime
is not simply and exclu-
sively a function of the perception that blacks live nearby. To
this point, virtually all of the pop-
ular and academic discourse on crime threat has been framed in
black and white terms. For
example, the criminologist Katheryn Russell recently suggested
that "blacks are the repository
for the American fear of crime" (1998:xiii), and Senator Bill
Bradley observed that "fear of
black crime covers the streets like a sheet of ice" (quoted in
Skogan 1995:60). It is the "black
man" who is most often seen as "today's prevailing criminal
predator" (Barak 1994:137) or is
identified in hoaxes that seek to deflect criminal blame or create
anxiety (Russell 1998:71).
But for this Florida sample, the perception that Hispanics live
nearby in greater numbers is
more strongly related to criminal threat than perceptions about
the residential proximity of
blacks. Using perceived risk of victimization as the measure of
criminal threat, PRCBLK and
PRCHISP are significant for the same subsamples and regional
contexts, but the relative mag-
nitude of standardized Betas consistently favors PRCHISP. This
further suggests that ethnic
diversity may be more threatening than racial diversity in
Florida-a state where the Hispanic
population (14%) has grown to be larger than the black
population (12%).
Inasmuch as the Hispanic population of the United States is
projected to grow faster than
and surpass the black population by the year 2010 (U.S. Bureau
of the Census 1996), it will be
important to assess whether this growing minority will come to
pose the perceived crime
threat elsewhere that it clearly does in Florida. It will also be of
interest to learn whether the
iconography of criminal threat, as reflected in media and
popular rhetoric, comes to include
the putative "menace" of Hispanics-as it has blacks. Whether it
does or not, the current data
suggest there is reason to believe that perceived criminal
"threat" will likely vary by the race
or ethnicity of who is being threatened and by the geo-social
context of where people live.
As noted, where people live-South Florida or not-makes a
substantial difference in
how racial and ethnic differences are linked to perceived
criminal threat. For both Hispanics
and whites, the perception that blacks or Hispanics live nearby
significantly elevates RISK.
However, these relationships hold for Hispanics only outside of
South Florida and they hold for
whites only inside South Florida. Why do whites perceive
greater crime threat in relation to
racial and ethnic others only in South Florida and Hispanics
only outside of South Florida?
by guest on N
ovem
ber 27, 2016
http://socpro.oxfordjournals.org/
D
ow
nloaded from
http://socpro.oxfordjournals.org/
336 CHIRICOS/McENTIRE/GERTZ
The experience of whites in South Florida may be a textbook
example of conditions that
generate what Blalock (1967) called "power threat" and Liska
(1992) broadened to call "social
threat"-which implies the threat of crime. A former majority
(80% in 1960), whites now
comprise 49% of those living in the four counties we have
designated as South Florida.
Though still the single largest group, whites have ceded
considerable economic and political
power and continue to see the "minority" presence of blacks and
Hispanics grow in relation to
their own numbers. It is certainly consistent with a social threat
interpretation, that whites in
South Florida would feel "threatened" by the growing presence
of blacks and Hispanics. That
whites outside of South Florida-where they are a substantial
majority-are not similarly
threatened is also consistent with a social threat interpretation.
The absence of RISK effects among Hispanics living in South
Florida and the responsive-
ness of perceived victim risk to perceived racial and ethnic
diversity for Hispanics living outside
of South Florida may be subject to alternative explanations. One
possibility is that the percep-
tion of victimization risk is so high among Hispanics living in
South Florida, that something of
a "ceiling effect"'7 exists which mitigates the influence of other
factors like perceived racial or
ethnic composition of neighborhood. At first glance, the data
appear consistent with such an
interpretation. Hispanics living in South Florida have mean
RISK levels (31.3) fifty percent
higher than whites (20.1). However, outside of South Florida,
Hispanic RISK (26.3) levels are
forty-two percent higher than those of whites. The similarity of
these RISK levels reduces the
plausibility of a "ceiling effect" interpretation of the pattern of
RISK results for Hispanics.
A second explanation for why Hispanics perceive no criminal
threat in relation to blacks
and Hispanics in South Florida-but are apparently threatened
elsewhere-may involve a
variant of the social threat hypothesis. Within South Florida,
Hispanics are 32% of the popula-
tion and are predominantly either Cuban (56%) or Central/South
American (32%) in ethnic
origin. They are also clearly an ascendant group both
economically and politically. Hispanics
outside of South Florida, comprise only 6% of the population
and are much more ethnically
diverse, with Puerto Rican (36%), Cuban (21%), Central/South
American (21%) and Mexican
(14%) ethnicities substantially represented (Nogle 1999).
It is consistent with a modified social threat perspective to note
that outside of South
Florida, where Hispanics are a small minority and blacks are
twice as prevalent (12%), the
perception of blacks living nearby could be threatening to
Hispanics in ways that it is not in
South Florida. At the same time, the greater ethnic diversity of
Hispanics living outside of
South Florida may account for the increase in RISK associated
with the perception (among
Hispanics) that other Hispanics are living nearby. Within South
Florida, Hispanics are both
more numerous and ethnically homogeneous and the presence of
blacks or other Hispanics
may not be as threatening.
While generally consistent with a social threat interpretation of
RISK, the present findings
may also afford "micro level" evidence of the kind that Blalock
(1967:29) regarded as poten-
tially suggestive of modifications to broader macro-theory. On
the basis of these results it may
be reasonable to suggest that several aspects of social threat
relationships could be theorized
more broadly than was possible to this point. In terms of who is
perceived as threatening, we
might expect future tests of social threat to incorporate
Hispanics and possibly other ethnic
groups as potentially threatening and subject to social control.
Blalock (1967), when first rais-
ing these issues in terms not related to criminal threat, spoke
generally in terms of "minorities"
with blacks as a particularly visible minority that could be
subject to "discrimination." Subse-
quent extensions of these ideas to include criminal threat
narrowed the focus to blacks. The
present data suggest that a broader focus in relation to criminal
threat may well be warranted.
In terms of who is being threatened, the dynamic of social
threat might be reconceptual-
ized to include threats perceived by minority populations, in
addition to those traditionally pre-
17. This concept was first raised in relation to "fear" by Heath
and Petraitis (1987) as a possible explanation for
why television viewing had little apparent influence on fear for
women.
by guest on N
ovem
ber 27, 2016
http://socpro.oxfordjournals.org/
D
ow
nloaded from
http://socpro.oxfordjournals.org/
Perceived Composition of Neighborhood and Risk of Crime 337
sumed to affect majorities. Earlier, Covington and Taylor
(1991) argued that minority status
per se is likely a critical element in the experience of criminal
threat and Chiricos, et al. (1997)
found that whites were threatened only when they believed
themselves to be a minority. We
find that whites (in South Florida) and Hispanics (outside of
South Florida) are only threat-
ened in contexts where their numbers are relatively small.
While social threat traditionally focused on dominant majorities
as potentially threatened
by racial diversity, majority status itself may, in particular
contexts, provide a kind of social
insulation from criminal threat posed by either racial or ethnic
others. The responses to threat
experienced by minorities may well take paths different from
the mobilization of repressive
state controls typically linked to threatened majorities. What
paths they may take and the con-
sequences they may have are matters for subsequent theoretical
and empirical inquiry. But it
is reasonably presumed they will at least include the kinds of
exclusions and social dis tanc-
ing that were heretofore associated with majority response to
perceived threats from minorities.
In short, these data not only broaden our understanding of the
possible sources of threat,
but they extend the potential context of threat to an entirely
different condition than previ-
ously theorized in relation to social threat-the condition of
minority as opposed to majority
status. By doing so these findings underscore the relevance of
Blalock's own observation "that
a careful micro-level analysis of psychological factors" implicit
in the macro theory, may sug-
gest and warrant "modifications in the theory" (1967:29). We
would argue that these data
offer several possibilities for how such modifications might
proceed.
References
American Association for Public Opinion Research
1998 Standard Definitions: Final Dispositions of Case Codes
and Outcome Rates for RDD Telephone Surveys
and In-Person Household Surveys. Ann Arbor, MI: AAPOR.
Anderson, David C.
1995 Crime and the Politics of Hysteria. New York: Random
House, Inc.
Bankston, William B., and Carol Y. Thompson
1989 "Carrying firearms for protection: A causal model."
Sociological Inquiry 59:75-87.
Barak, Gregg
1994 "Between the waves: Mass-mediated themes of crime and
justice." Social Justice 21:133-147.
Blalock, Hubert M.
1967 Toward a Theory ofMinority Group Relations. New York:
John Wiley and Sons.
Bridges, George S.
1987 "Crime, social structure and criminal punishment: White
and non-white rates of
imprisonment." Social Problems 34:345-361.
Bridges, George S., Robert D. Crutchfield, and Edith E.
Simpson
1987 "Crime, social structure and criminal punishment: White
and nonwhite rates of
imprisonment." Social Problems 34:345-359.
Chamlin, Mitchell B.
1989 "A macro social analysis of change in police force size,
1972-1982: Controlling for static
and dynamic influences." The Sociological Quarterly 30:615-
624.
Chamlin, Mitchell B., and Allen E. Liska
1992 "Social structure and crime control revisited: The
declining significance of intergroup
threat." In Social Threat and Social Control, Allen E. Liska, ed.
Albany, NY: SUNY Press.
Chiricos, Ted
1996 "Moral panic as ideology: Race, drugs, violence and
punishment in America." In Race with
Prejudice: Race and Justice in America, Michael J. Lynch and
E. Britt Patterson, eds. New York:
Harrow and Heston.
Chiricos, Ted, Michael Hogan, and Marc Gertz
1997 "Racial composition of neighborhood and fear of crime."
Criminology 35:107-129.
by guest on N
ovem
ber 27, 2016
http://socpro.oxfordjournals.org/
D
ow
nloaded from
http://socpro.oxfordjournals.org/
338 CHIRICOS/McENTIRE/GERTZ
Clemente, Frank, and Michael Kleiman
1976 "Fear of crime among the aged." Gerontologist 16:207-
210.
Cohen, Richard
1993 "Common ground on crime." Washington Post, December
21:A2.
Covington, Jeanette, and Ralph B. Taylor
1991 "Fear of crime in urban residential neighborhoods:
Implications of between- and within-
neighborhood sources for current models." The Sociological
Quarterly 32:231-249.
DeLone, Miriam
1992 Marginal labor and county level punishment patterns.
Ph.D. Dissertation, School of
Criminology, Florida State University, Tallahassee, FL.
Entman, Robert M.
1990 "Modern racism and the images of blacks in local
television news." Critical Studies in Mass
Communications 7:332-345.
Entman, Robert M.
1992 "Blacks in the news: Television, modern racism, and
cultural change." Journalism Quarterly
69:341-361.
Ferraro, Kenneth A.
1995 Fear of Crime: Interpreting Victimization Risk. Albany,
NY: SUNY Press.
Ferraro, Kenneth E, and Randy LaGrange
1987 "The measurement of fear of crime." Sociological Inquiry
57:70-101.
1992 "Are older people most afraid of crime? Reconsidering age
differences in fear of
victimization." Journal of Gerontology Social Sciences
47:S233-244.
Giddens, Anthony
1976 The New Rules of Sociological Method: A Positive
Critique of Interpretive Sociologies. New York:
Basic Books.
Gilens, Martin
1996 "'Race coding' and white opposition to welfare." American
Political Science Review 90:
593-604.
Greenberg, David E, Ronald C. Kessler, and Colin Loftin
1985 "Social inequality and crime control." The Journal of
Criminal Law and Criminology 76:684-
704.
Harer, Miles D., and Darrel Steffensmeier
1992 "The differing effects of economic inequality on black and
white rates of violence." Social
Forces 70:1035-1054.
Hawkins, Darnell E
1995 "Ethnicity, race and crime: A review of selected studies."
In Ethnicity Race and Crime:
Perspectives Across Time and Place, Darnell Hawkins, ed.
Albany, NY: SUNY Press.
Heath, Linda, and John Petraitis
1987 "Television viewing and fear of crime: Where is the mean
world?" Basic and Applied Social
Psychology 8:97-123.
Jackson, Pamela Irving
1989 Minority Group Threat, Crime and Policing. New York:
Praeger Publishers.
Jackson, Pamela Irving, and Leo Carroll
1981 Race and war on crime: The sociopolitical determinants of
municipal police expenditures in
90 non-southern U.S. cities. American Sociological Review
46:290-305.
Jaycox, Victoria
1978 "The elderly's fear of crime: Rational or irrational."
Victimology 3:329-334.
Karmen, Andrew A.
1991 "Victims of crime." In Criminology: A Contemporary
Handbook, Joseph F. Sheley, ed., 121-138.
Belmont, CA: Wadsworth.
Kennedy, Randall
1997 Race, Crime and the Law. New York: Vintage Books.
LaGrange, Randy L., Kenneth F. Ferraro, and Michael Supanic
1992 "Perceived risk and fear of crime: Role of social and
physical incivilities." Journal of Research
in Crime and Delinquency 29:311-334.
Liska, Allen E.
1992 Social Threat and Social Control. Albany, NY: SUNY
Press.
by guest on N
ovem
ber 27, 2016
http://socpro.oxfordjournals.org/
D
ow
nloaded from
http://socpro.oxfordjournals.org/
Perceived Composition of Neighborhood and Risk of Crime 339
Liska, Allen E., and Mitchell B. Chamlin
1984 Social structure and crime control among macrosocial
units. American Journal of Sociology
90:383-395.
Liska, Allen E., Mitchell B. Chamlin, and Mark D. Reed
1985 "Testing the economic production and conflict models of
crime control." Social Forces
64:119-138.
Liska, Allen E., Joseph J. Lawrence, and Michael Benson
1981 "Perspectives on the legal order: The capacity for social
control." American Journal of
Sociology 87:413-426.
Liska, Allen E., Joseph J. Lawrence, and Andrew Sanchirico
1982 "Fear of crime as a social fact." Social Forces 60:761-770.
Moeller, Gertrude L.
1989 "Fear of criminal victimization: The effect of
neighborhood racial composition." Sociological
Inquiry 59:208-221.
Myers, Martha A., and Susette M. Talarico
1986 "The social context of racial discrimination in
sentencing." Social Problems 33:236-251.
1987 The Social Contexts of Criminal Sentencing. New York:
Springer-Verlag.
Nedau, Richard, Richard G. Niemi, and Jeffrey Levine
1993 "Innumeracy about minority populations." Public Opinion
Quarterly 57:332-347.
Nogle, June Marie
1999 Personal communication on 10 March from research
demographer at the Bureau of
Economic and Business Research, University of Florida.
Ortega, Suzanne L., and Jessie L. Myles
1987 "Race and gender effects on the fear of crime: An
interactive model with age." Criminology
25:133-152.
Parker, Kenneth D., and Melvin C. Ray
1990 "Fear of crime: An assessment of related factors."
Sociological Spectrum 10:29-40.
Rountree, Pamela W., and Kenneth C. Land
1996 "Perceived risk versus fear of crime." Social Forces
74:1353-1376.
Russell, Katheryn K.
1998 The Color of Crime. NY: New York University Press.
Skogan, Wesley G.
1995 "Crime and the racial fears of white Americans." The
Annals of the American Academy of
Political and Social Science 539:59-71.
Szkowny, Rick
1994 "No justice, no peace: An interview with Jerome Miller."
The Humanist January/
February:9-19.
Tate, Richard
1998 An Introduction to Modeling Outcomes in the Behavioral
and Social Sciences. Edina, MN: Burgess
Publishing.
Taylor, Ralph B., and Jeanette Covington
1993 "Community structural change and fear of crime." Social
Problems 40:374-395.
Thompson, Carol Y., William B. Bankston, and Roberta L. St.
Pierre
1992 "Parity and disparity among three measures of crime: A
research note." Deviant Behavior: An
Interdisciplinary Journal 13:373-389.
Lonry, Michael
1995 Malign Neglect. NY: Oxford University Press.
U.S. Bureau of the Census
1996 Population Projections of the United States by Age, Sex,
Race, and Hispanic Origin: 1995 to
2050. Current Population Reports, Series P25-1130.
Ward, Russel A., Mark LaGory, and Susan R. Sherman
1986 "Fear of crime among the elderly as person/environment
interaction." The Sociological
Quarterly 27:327-341.
Warner, Barbara D.
1992 "The reporting of crime: A missing link in conflict
theory." In Social Threat and Social Control,
Allen Liska, ed. Albany, NY: SUNY Press.
by guest on N
ovem
ber 27, 2016
http://socpro.oxfordjournals.org/
D
ow
nloaded from
http://socpro.oxfordjournals.org/
340 CHIRICOS/McENTIRE/GERTZ
Warren, Christopher L., John G. Corbett, and John F. Stack, Jr.
1990 "Hispanic ascendancy and tripartite politics in Miami." In
Racial Politics in American Cities,
Rufus P. Browning, Dale Rogers Marshall, and David H. Tabb,
eds. White Plains, NY:
Longman.
West, Comel
1994 Race Matters. New York: Vintage Books.
White, H.
1980 "A heteroskedasticity consistent covariance matrix and a
direct test for heteroskedasticity."
Econometrica 48:817-838.
Wilson, James Q.
1992 "To prevent riots, reduce black crime." The Wall Street
Journal 6, May:A16.
by guest on N
ovem
ber 27, 2016
http://socpro.oxfordjournals.org/
D
ow
nloaded from
http://socpro.oxfordjournals.org/Article Contentsp. [322]p.
323p. 324p. 325p. 326p. 327p. 328p. 329p. 330p. 331p. 332p.
333p. 334p. 335p. 336p. 337p. 338p. 339p. 340Issue Table of
ContentsSocial Problems, Vol. 48, No. 3 (Aug., 2001) pp. 299-
428Front MatterUrban Neighborhoods: Race, Ethnicity,
Poverty, and PoliticsNeighborhood Transition and Social
Organization: The White to Hispanic Case [pp. 299-
321]Perceived Racial and Ethnic Composition of Neighborhood
and Perceived Risk of Crime [pp. 322-340]Ghettos and Barrios:
The Impact of Neighborhood Poverty and Race on Job Matching
among Blacks and Latinos [pp. 341-361]Political Participation
of the Urban Poor [pp. 362-385]Gay/Lesbian Rights Struggles:
The State and Counter-MovementsWho's "In" and Who's "Out":
State Fragmentation and the Struggle over Gay Rights, 1974-
1999 [pp. 386-410]Working Anita Bryant: The Impact of
Christian Anti-Gay Activism on Lesbian and Gay Movement
Claims [pp. 411-428]Back Matter

More Related Content

Similar to Perceived Racial and Ethnic Composition of Neighborhood and .docx

GC LEYRO FINAL DRAFT
GC LEYRO FINAL DRAFTGC LEYRO FINAL DRAFT
GC LEYRO FINAL DRAFTShirley Leyro
 
Crime Waves, Fears, and Social RealityThe American criminal just.docx
Crime Waves, Fears, and Social RealityThe American criminal just.docxCrime Waves, Fears, and Social RealityThe American criminal just.docx
Crime Waves, Fears, and Social RealityThe American criminal just.docxwillcoxjanay
 
Crime Waves, Fears, and Social RealityThe American criminal just.docx
Crime Waves, Fears, and Social RealityThe American criminal just.docxCrime Waves, Fears, and Social RealityThe American criminal just.docx
Crime Waves, Fears, and Social RealityThe American criminal just.docxfaithxdunce63732
 
Spencer GrantPhotolibrary.docx
Spencer GrantPhotolibrary.docxSpencer GrantPhotolibrary.docx
Spencer GrantPhotolibrary.docxwhitneyleman54422
 
Lab Report Part A - Perceptions and fear of crime: A manipulation of collecti...
Lab Report Part A - Perceptions and fear of crime: A manipulation of collecti...Lab Report Part A - Perceptions and fear of crime: A manipulation of collecti...
Lab Report Part A - Perceptions and fear of crime: A manipulation of collecti...Joshua Walker
 
current trends in criminal justice system
current trends in criminal justice systemcurrent trends in criminal justice system
current trends in criminal justice systemPATRICK MAELO
 
Christian Castillo D2 Summer 2018Outline of Complete Research.docx
Christian Castillo D2 Summer 2018Outline of Complete Research.docxChristian Castillo D2 Summer 2018Outline of Complete Research.docx
Christian Castillo D2 Summer 2018Outline of Complete Research.docxchristinemaritza
 
THE_THEORY_OF_BROKEN_WINDOWS SAMPLE WRITING
THE_THEORY_OF_BROKEN_WINDOWS SAMPLE WRITINGTHE_THEORY_OF_BROKEN_WINDOWS SAMPLE WRITING
THE_THEORY_OF_BROKEN_WINDOWS SAMPLE WRITINGVictor Herrera
 
Violence and Popular CultureViolence exists and has existed in a.docx
Violence and Popular CultureViolence exists and has existed in a.docxViolence and Popular CultureViolence exists and has existed in a.docx
Violence and Popular CultureViolence exists and has existed in a.docxdickonsondorris
 
Running head Overpopulation and violence 1Overpopulation and v.docx
Running head Overpopulation and violence 1Overpopulation and v.docxRunning head Overpopulation and violence 1Overpopulation and v.docx
Running head Overpopulation and violence 1Overpopulation and v.docxjeanettehully
 

Similar to Perceived Racial and Ethnic Composition of Neighborhood and .docx (10)

GC LEYRO FINAL DRAFT
GC LEYRO FINAL DRAFTGC LEYRO FINAL DRAFT
GC LEYRO FINAL DRAFT
 
Crime Waves, Fears, and Social RealityThe American criminal just.docx
Crime Waves, Fears, and Social RealityThe American criminal just.docxCrime Waves, Fears, and Social RealityThe American criminal just.docx
Crime Waves, Fears, and Social RealityThe American criminal just.docx
 
Crime Waves, Fears, and Social RealityThe American criminal just.docx
Crime Waves, Fears, and Social RealityThe American criminal just.docxCrime Waves, Fears, and Social RealityThe American criminal just.docx
Crime Waves, Fears, and Social RealityThe American criminal just.docx
 
Spencer GrantPhotolibrary.docx
Spencer GrantPhotolibrary.docxSpencer GrantPhotolibrary.docx
Spencer GrantPhotolibrary.docx
 
Lab Report Part A - Perceptions and fear of crime: A manipulation of collecti...
Lab Report Part A - Perceptions and fear of crime: A manipulation of collecti...Lab Report Part A - Perceptions and fear of crime: A manipulation of collecti...
Lab Report Part A - Perceptions and fear of crime: A manipulation of collecti...
 
current trends in criminal justice system
current trends in criminal justice systemcurrent trends in criminal justice system
current trends in criminal justice system
 
Christian Castillo D2 Summer 2018Outline of Complete Research.docx
Christian Castillo D2 Summer 2018Outline of Complete Research.docxChristian Castillo D2 Summer 2018Outline of Complete Research.docx
Christian Castillo D2 Summer 2018Outline of Complete Research.docx
 
THE_THEORY_OF_BROKEN_WINDOWS SAMPLE WRITING
THE_THEORY_OF_BROKEN_WINDOWS SAMPLE WRITINGTHE_THEORY_OF_BROKEN_WINDOWS SAMPLE WRITING
THE_THEORY_OF_BROKEN_WINDOWS SAMPLE WRITING
 
Violence and Popular CultureViolence exists and has existed in a.docx
Violence and Popular CultureViolence exists and has existed in a.docxViolence and Popular CultureViolence exists and has existed in a.docx
Violence and Popular CultureViolence exists and has existed in a.docx
 
Running head Overpopulation and violence 1Overpopulation and v.docx
Running head Overpopulation and violence 1Overpopulation and v.docxRunning head Overpopulation and violence 1Overpopulation and v.docx
Running head Overpopulation and violence 1Overpopulation and v.docx
 

More from danhaley45372

Your initial post should be 2-3 paragraphs in length.Inclu.docx
Your initial post should be 2-3 paragraphs in length.Inclu.docxYour initial post should be 2-3 paragraphs in length.Inclu.docx
Your initial post should be 2-3 paragraphs in length.Inclu.docxdanhaley45372
 
Your initial post should be made during Unit 2,  January 21st at 4.docx
Your initial post should be made during Unit 2,  January 21st at 4.docxYour initial post should be made during Unit 2,  January 21st at 4.docx
Your initial post should be made during Unit 2,  January 21st at 4.docxdanhaley45372
 
Your initial post should be at least 450+ words and in APA forma.docx
Your initial post should be at least 450+ words and in APA forma.docxYour initial post should be at least 450+ words and in APA forma.docx
Your initial post should be at least 450+ words and in APA forma.docxdanhaley45372
 
Your initial post should be made during Unit 2, january 21st at 4.docx
Your initial post should be made during Unit 2, january 21st at 4.docxYour initial post should be made during Unit 2, january 21st at 4.docx
Your initial post should be made during Unit 2, january 21st at 4.docxdanhaley45372
 
Your initial post should be made during, Submissions after this time.docx
Your initial post should be made during, Submissions after this time.docxYour initial post should be made during, Submissions after this time.docx
Your initial post should be made during, Submissions after this time.docxdanhaley45372
 
Your essay should address the following.(a) How  is the biologic.docx
Your essay should address the following.(a) How  is the biologic.docxYour essay should address the following.(a) How  is the biologic.docx
Your essay should address the following.(a) How  is the biologic.docxdanhaley45372
 
Your initial post is due by midnight (1159 PM) on Thursday. You mus.docx
Your initial post is due by midnight (1159 PM) on Thursday. You mus.docxYour initial post is due by midnight (1159 PM) on Thursday. You mus.docx
Your initial post is due by midnight (1159 PM) on Thursday. You mus.docxdanhaley45372
 
Your individual sub-topic written (MIN of 1, MAX 3 pages)You.docx
Your individual sub-topic written (MIN of 1, MAX 3 pages)You.docxYour individual sub-topic written (MIN of 1, MAX 3 pages)You.docx
Your individual sub-topic written (MIN of 1, MAX 3 pages)You.docxdanhaley45372
 
Your HR project to develop a centralized model of deliveri.docx
Your HR project to develop a centralized model of deliveri.docxYour HR project to develop a centralized model of deliveri.docx
Your HR project to develop a centralized model of deliveri.docxdanhaley45372
 
Your Immersion Project for this course is essentially ethnographic r.docx
Your Immersion Project for this course is essentially ethnographic r.docxYour Immersion Project for this course is essentially ethnographic r.docx
Your Immersion Project for this course is essentially ethnographic r.docxdanhaley45372
 
Your country just overthrew its dictator, and you are the newly .docx
Your country just overthrew its dictator, and you are the newly .docxYour country just overthrew its dictator, and you are the newly .docx
Your country just overthrew its dictator, and you are the newly .docxdanhaley45372
 
Your have been contracted by HealthFirst Hospital Foundation (HHF),.docx
Your have been contracted by HealthFirst Hospital Foundation (HHF),.docxYour have been contracted by HealthFirst Hospital Foundation (HHF),.docx
Your have been contracted by HealthFirst Hospital Foundation (HHF),.docxdanhaley45372
 
Your group presentationWhat you need to do.docx
Your group presentationWhat you need to do.docxYour group presentationWhat you need to do.docx
Your group presentationWhat you need to do.docxdanhaley45372
 
Your contribution(s) must add significant information to the dis.docx
Your contribution(s) must add significant information to the dis.docxYour contribution(s) must add significant information to the dis.docx
Your contribution(s) must add significant information to the dis.docxdanhaley45372
 
Your good friends have just adopted a four-year-old child. At th.docx
Your good friends have just adopted a four-year-old child. At th.docxYour good friends have just adopted a four-year-old child. At th.docx
Your good friends have just adopted a four-year-old child. At th.docxdanhaley45372
 
Your good friends have just adopted a four-year-old child. At this p.docx
Your good friends have just adopted a four-year-old child. At this p.docxYour good friends have just adopted a four-year-old child. At this p.docx
Your good friends have just adopted a four-year-old child. At this p.docxdanhaley45372
 
Your goals as the IT architect and IT security specialist are to.docx
Your goals as the IT architect and IT security specialist are to.docxYour goals as the IT architect and IT security specialist are to.docx
Your goals as the IT architect and IT security specialist are to.docxdanhaley45372
 
Your essay should address the following problem.(a) What is .docx
Your essay should address the following problem.(a) What is .docxYour essay should address the following problem.(a) What is .docx
Your essay should address the following problem.(a) What is .docxdanhaley45372
 
Your future financial needs will be based on the income you can reas.docx
Your future financial needs will be based on the income you can reas.docxYour future financial needs will be based on the income you can reas.docx
Your future financial needs will be based on the income you can reas.docxdanhaley45372
 
Your friend Lydia is having difficulty taking in the informati.docx
Your friend Lydia is having difficulty taking in the informati.docxYour friend Lydia is having difficulty taking in the informati.docx
Your friend Lydia is having difficulty taking in the informati.docxdanhaley45372
 

More from danhaley45372 (20)

Your initial post should be 2-3 paragraphs in length.Inclu.docx
Your initial post should be 2-3 paragraphs in length.Inclu.docxYour initial post should be 2-3 paragraphs in length.Inclu.docx
Your initial post should be 2-3 paragraphs in length.Inclu.docx
 
Your initial post should be made during Unit 2,  January 21st at 4.docx
Your initial post should be made during Unit 2,  January 21st at 4.docxYour initial post should be made during Unit 2,  January 21st at 4.docx
Your initial post should be made during Unit 2,  January 21st at 4.docx
 
Your initial post should be at least 450+ words and in APA forma.docx
Your initial post should be at least 450+ words and in APA forma.docxYour initial post should be at least 450+ words and in APA forma.docx
Your initial post should be at least 450+ words and in APA forma.docx
 
Your initial post should be made during Unit 2, january 21st at 4.docx
Your initial post should be made during Unit 2, january 21st at 4.docxYour initial post should be made during Unit 2, january 21st at 4.docx
Your initial post should be made during Unit 2, january 21st at 4.docx
 
Your initial post should be made during, Submissions after this time.docx
Your initial post should be made during, Submissions after this time.docxYour initial post should be made during, Submissions after this time.docx
Your initial post should be made during, Submissions after this time.docx
 
Your essay should address the following.(a) How  is the biologic.docx
Your essay should address the following.(a) How  is the biologic.docxYour essay should address the following.(a) How  is the biologic.docx
Your essay should address the following.(a) How  is the biologic.docx
 
Your initial post is due by midnight (1159 PM) on Thursday. You mus.docx
Your initial post is due by midnight (1159 PM) on Thursday. You mus.docxYour initial post is due by midnight (1159 PM) on Thursday. You mus.docx
Your initial post is due by midnight (1159 PM) on Thursday. You mus.docx
 
Your individual sub-topic written (MIN of 1, MAX 3 pages)You.docx
Your individual sub-topic written (MIN of 1, MAX 3 pages)You.docxYour individual sub-topic written (MIN of 1, MAX 3 pages)You.docx
Your individual sub-topic written (MIN of 1, MAX 3 pages)You.docx
 
Your HR project to develop a centralized model of deliveri.docx
Your HR project to develop a centralized model of deliveri.docxYour HR project to develop a centralized model of deliveri.docx
Your HR project to develop a centralized model of deliveri.docx
 
Your Immersion Project for this course is essentially ethnographic r.docx
Your Immersion Project for this course is essentially ethnographic r.docxYour Immersion Project for this course is essentially ethnographic r.docx
Your Immersion Project for this course is essentially ethnographic r.docx
 
Your country just overthrew its dictator, and you are the newly .docx
Your country just overthrew its dictator, and you are the newly .docxYour country just overthrew its dictator, and you are the newly .docx
Your country just overthrew its dictator, and you are the newly .docx
 
Your have been contracted by HealthFirst Hospital Foundation (HHF),.docx
Your have been contracted by HealthFirst Hospital Foundation (HHF),.docxYour have been contracted by HealthFirst Hospital Foundation (HHF),.docx
Your have been contracted by HealthFirst Hospital Foundation (HHF),.docx
 
Your group presentationWhat you need to do.docx
Your group presentationWhat you need to do.docxYour group presentationWhat you need to do.docx
Your group presentationWhat you need to do.docx
 
Your contribution(s) must add significant information to the dis.docx
Your contribution(s) must add significant information to the dis.docxYour contribution(s) must add significant information to the dis.docx
Your contribution(s) must add significant information to the dis.docx
 
Your good friends have just adopted a four-year-old child. At th.docx
Your good friends have just adopted a four-year-old child. At th.docxYour good friends have just adopted a four-year-old child. At th.docx
Your good friends have just adopted a four-year-old child. At th.docx
 
Your good friends have just adopted a four-year-old child. At this p.docx
Your good friends have just adopted a four-year-old child. At this p.docxYour good friends have just adopted a four-year-old child. At this p.docx
Your good friends have just adopted a four-year-old child. At this p.docx
 
Your goals as the IT architect and IT security specialist are to.docx
Your goals as the IT architect and IT security specialist are to.docxYour goals as the IT architect and IT security specialist are to.docx
Your goals as the IT architect and IT security specialist are to.docx
 
Your essay should address the following problem.(a) What is .docx
Your essay should address the following problem.(a) What is .docxYour essay should address the following problem.(a) What is .docx
Your essay should address the following problem.(a) What is .docx
 
Your future financial needs will be based on the income you can reas.docx
Your future financial needs will be based on the income you can reas.docxYour future financial needs will be based on the income you can reas.docx
Your future financial needs will be based on the income you can reas.docx
 
Your friend Lydia is having difficulty taking in the informati.docx
Your friend Lydia is having difficulty taking in the informati.docxYour friend Lydia is having difficulty taking in the informati.docx
Your friend Lydia is having difficulty taking in the informati.docx
 

Recently uploaded

Visit to a blind student's school🧑‍🦯🧑‍🦯(community medicine)
Visit to a blind student's school🧑‍🦯🧑‍🦯(community medicine)Visit to a blind student's school🧑‍🦯🧑‍🦯(community medicine)
Visit to a blind student's school🧑‍🦯🧑‍🦯(community medicine)lakshayb543
 
4.11.24 Mass Incarceration and the New Jim Crow.pptx
4.11.24 Mass Incarceration and the New Jim Crow.pptx4.11.24 Mass Incarceration and the New Jim Crow.pptx
4.11.24 Mass Incarceration and the New Jim Crow.pptxmary850239
 
Active Learning Strategies (in short ALS).pdf
Active Learning Strategies (in short ALS).pdfActive Learning Strategies (in short ALS).pdf
Active Learning Strategies (in short ALS).pdfPatidar M
 
Daily Lesson Plan in Mathematics Quarter 4
Daily Lesson Plan in Mathematics Quarter 4Daily Lesson Plan in Mathematics Quarter 4
Daily Lesson Plan in Mathematics Quarter 4JOYLYNSAMANIEGO
 
Congestive Cardiac Failure..presentation
Congestive Cardiac Failure..presentationCongestive Cardiac Failure..presentation
Congestive Cardiac Failure..presentationdeepaannamalai16
 
Multi Domain Alias In the Odoo 17 ERP Module
Multi Domain Alias In the Odoo 17 ERP ModuleMulti Domain Alias In the Odoo 17 ERP Module
Multi Domain Alias In the Odoo 17 ERP ModuleCeline George
 
Blowin' in the Wind of Caste_ Bob Dylan's Song as a Catalyst for Social Justi...
Blowin' in the Wind of Caste_ Bob Dylan's Song as a Catalyst for Social Justi...Blowin' in the Wind of Caste_ Bob Dylan's Song as a Catalyst for Social Justi...
Blowin' in the Wind of Caste_ Bob Dylan's Song as a Catalyst for Social Justi...DhatriParmar
 
Textual Evidence in Reading and Writing of SHS
Textual Evidence in Reading and Writing of SHSTextual Evidence in Reading and Writing of SHS
Textual Evidence in Reading and Writing of SHSMae Pangan
 
Expanded definition: technical and operational
Expanded definition: technical and operationalExpanded definition: technical and operational
Expanded definition: technical and operationalssuser3e220a
 
Mythology Quiz-4th April 2024, Quiz Club NITW
Mythology Quiz-4th April 2024, Quiz Club NITWMythology Quiz-4th April 2024, Quiz Club NITW
Mythology Quiz-4th April 2024, Quiz Club NITWQuiz Club NITW
 
INTRODUCTION TO CATHOLIC CHRISTOLOGY.pptx
INTRODUCTION TO CATHOLIC CHRISTOLOGY.pptxINTRODUCTION TO CATHOLIC CHRISTOLOGY.pptx
INTRODUCTION TO CATHOLIC CHRISTOLOGY.pptxHumphrey A Beña
 
Beauty Amidst the Bytes_ Unearthing Unexpected Advantages of the Digital Wast...
Beauty Amidst the Bytes_ Unearthing Unexpected Advantages of the Digital Wast...Beauty Amidst the Bytes_ Unearthing Unexpected Advantages of the Digital Wast...
Beauty Amidst the Bytes_ Unearthing Unexpected Advantages of the Digital Wast...DhatriParmar
 
week 1 cookery 8 fourth - quarter .pptx
week 1 cookery 8  fourth  -  quarter .pptxweek 1 cookery 8  fourth  -  quarter .pptx
week 1 cookery 8 fourth - quarter .pptxJonalynLegaspi2
 
Using Grammatical Signals Suitable to Patterns of Idea Development
Using Grammatical Signals Suitable to Patterns of Idea DevelopmentUsing Grammatical Signals Suitable to Patterns of Idea Development
Using Grammatical Signals Suitable to Patterns of Idea Developmentchesterberbo7
 
MS4 level being good citizen -imperative- (1) (1).pdf
MS4 level   being good citizen -imperative- (1) (1).pdfMS4 level   being good citizen -imperative- (1) (1).pdf
MS4 level being good citizen -imperative- (1) (1).pdfMr Bounab Samir
 
DIFFERENT BASKETRY IN THE PHILIPPINES PPT.pptx
DIFFERENT BASKETRY IN THE PHILIPPINES PPT.pptxDIFFERENT BASKETRY IN THE PHILIPPINES PPT.pptx
DIFFERENT BASKETRY IN THE PHILIPPINES PPT.pptxMichelleTuguinay1
 
Decoding the Tweet _ Practical Criticism in the Age of Hashtag.pptx
Decoding the Tweet _ Practical Criticism in the Age of Hashtag.pptxDecoding the Tweet _ Practical Criticism in the Age of Hashtag.pptx
Decoding the Tweet _ Practical Criticism in the Age of Hashtag.pptxDhatriParmar
 
How to Fix XML SyntaxError in Odoo the 17
How to Fix XML SyntaxError in Odoo the 17How to Fix XML SyntaxError in Odoo the 17
How to Fix XML SyntaxError in Odoo the 17Celine George
 
ICS2208 Lecture6 Notes for SL spaces.pdf
ICS2208 Lecture6 Notes for SL spaces.pdfICS2208 Lecture6 Notes for SL spaces.pdf
ICS2208 Lecture6 Notes for SL spaces.pdfVanessa Camilleri
 

Recently uploaded (20)

Visit to a blind student's school🧑‍🦯🧑‍🦯(community medicine)
Visit to a blind student's school🧑‍🦯🧑‍🦯(community medicine)Visit to a blind student's school🧑‍🦯🧑‍🦯(community medicine)
Visit to a blind student's school🧑‍🦯🧑‍🦯(community medicine)
 
4.11.24 Mass Incarceration and the New Jim Crow.pptx
4.11.24 Mass Incarceration and the New Jim Crow.pptx4.11.24 Mass Incarceration and the New Jim Crow.pptx
4.11.24 Mass Incarceration and the New Jim Crow.pptx
 
Active Learning Strategies (in short ALS).pdf
Active Learning Strategies (in short ALS).pdfActive Learning Strategies (in short ALS).pdf
Active Learning Strategies (in short ALS).pdf
 
Daily Lesson Plan in Mathematics Quarter 4
Daily Lesson Plan in Mathematics Quarter 4Daily Lesson Plan in Mathematics Quarter 4
Daily Lesson Plan in Mathematics Quarter 4
 
INCLUSIVE EDUCATION PRACTICES FOR TEACHERS AND TRAINERS.pptx
INCLUSIVE EDUCATION PRACTICES FOR TEACHERS AND TRAINERS.pptxINCLUSIVE EDUCATION PRACTICES FOR TEACHERS AND TRAINERS.pptx
INCLUSIVE EDUCATION PRACTICES FOR TEACHERS AND TRAINERS.pptx
 
Congestive Cardiac Failure..presentation
Congestive Cardiac Failure..presentationCongestive Cardiac Failure..presentation
Congestive Cardiac Failure..presentation
 
Multi Domain Alias In the Odoo 17 ERP Module
Multi Domain Alias In the Odoo 17 ERP ModuleMulti Domain Alias In the Odoo 17 ERP Module
Multi Domain Alias In the Odoo 17 ERP Module
 
Blowin' in the Wind of Caste_ Bob Dylan's Song as a Catalyst for Social Justi...
Blowin' in the Wind of Caste_ Bob Dylan's Song as a Catalyst for Social Justi...Blowin' in the Wind of Caste_ Bob Dylan's Song as a Catalyst for Social Justi...
Blowin' in the Wind of Caste_ Bob Dylan's Song as a Catalyst for Social Justi...
 
Textual Evidence in Reading and Writing of SHS
Textual Evidence in Reading and Writing of SHSTextual Evidence in Reading and Writing of SHS
Textual Evidence in Reading and Writing of SHS
 
Expanded definition: technical and operational
Expanded definition: technical and operationalExpanded definition: technical and operational
Expanded definition: technical and operational
 
Mythology Quiz-4th April 2024, Quiz Club NITW
Mythology Quiz-4th April 2024, Quiz Club NITWMythology Quiz-4th April 2024, Quiz Club NITW
Mythology Quiz-4th April 2024, Quiz Club NITW
 
INTRODUCTION TO CATHOLIC CHRISTOLOGY.pptx
INTRODUCTION TO CATHOLIC CHRISTOLOGY.pptxINTRODUCTION TO CATHOLIC CHRISTOLOGY.pptx
INTRODUCTION TO CATHOLIC CHRISTOLOGY.pptx
 
Beauty Amidst the Bytes_ Unearthing Unexpected Advantages of the Digital Wast...
Beauty Amidst the Bytes_ Unearthing Unexpected Advantages of the Digital Wast...Beauty Amidst the Bytes_ Unearthing Unexpected Advantages of the Digital Wast...
Beauty Amidst the Bytes_ Unearthing Unexpected Advantages of the Digital Wast...
 
week 1 cookery 8 fourth - quarter .pptx
week 1 cookery 8  fourth  -  quarter .pptxweek 1 cookery 8  fourth  -  quarter .pptx
week 1 cookery 8 fourth - quarter .pptx
 
Using Grammatical Signals Suitable to Patterns of Idea Development
Using Grammatical Signals Suitable to Patterns of Idea DevelopmentUsing Grammatical Signals Suitable to Patterns of Idea Development
Using Grammatical Signals Suitable to Patterns of Idea Development
 
MS4 level being good citizen -imperative- (1) (1).pdf
MS4 level   being good citizen -imperative- (1) (1).pdfMS4 level   being good citizen -imperative- (1) (1).pdf
MS4 level being good citizen -imperative- (1) (1).pdf
 
DIFFERENT BASKETRY IN THE PHILIPPINES PPT.pptx
DIFFERENT BASKETRY IN THE PHILIPPINES PPT.pptxDIFFERENT BASKETRY IN THE PHILIPPINES PPT.pptx
DIFFERENT BASKETRY IN THE PHILIPPINES PPT.pptx
 
Decoding the Tweet _ Practical Criticism in the Age of Hashtag.pptx
Decoding the Tweet _ Practical Criticism in the Age of Hashtag.pptxDecoding the Tweet _ Practical Criticism in the Age of Hashtag.pptx
Decoding the Tweet _ Practical Criticism in the Age of Hashtag.pptx
 
How to Fix XML SyntaxError in Odoo the 17
How to Fix XML SyntaxError in Odoo the 17How to Fix XML SyntaxError in Odoo the 17
How to Fix XML SyntaxError in Odoo the 17
 
ICS2208 Lecture6 Notes for SL spaces.pdf
ICS2208 Lecture6 Notes for SL spaces.pdfICS2208 Lecture6 Notes for SL spaces.pdf
ICS2208 Lecture6 Notes for SL spaces.pdf
 

Perceived Racial and Ethnic Composition of Neighborhood and .docx

  • 1. Perceived Racial and Ethnic Composition of Neighborhood and Perceived Risk of Crime TED CHIRICOS, Florida State University RANEE McENTIRE, Florida State University MARC GERTZ, Florida State University This paper examines the relationship between perceived racial and ethnic composition of neighborhood and criminal threat, which is operationalized as the perceived risk of criminal victimization. To address this question, we use interviews with a statewide random sample of 3,000 Florida residents conducted in the fall of 1996. This is the first assessment of this issue to include Hispanics-the largest and fastest growing minority in the State-as both respondents and as ethnic "others" whose presence may be a source of perceived risk for some. For the full sample, OLS regressions show that perceived risk of victimization is influenced by the perception that either Hispanics or blacks live nearby. The effects of the perception that Hispanics live nearby are consistently stronger than those associated with the perceived proximity of blacks. Analyses for subsamples show that whites are threatened by Hispanics and blacks, but only in South Florida where they are slightly outnumbered by those two groups. Hispanics are also threatened by the presence of blacks and other Hispanics, but only outside of South Florida where they are greatly outnumbered by blacks and whites. The results support a core assumption of the "social threat" perspective, which presumes the mobilization of social control is influenced by the percep- tion of criminal threat associated with the perceived proximity
  • 2. of racial others. These results also suggest that crime threat may be "ethnicity coded" as well as "race coded" and may, in certain contexts, have more effect on those who are in a minority status than on the dominant majority. The equation of criminal threat with the presence of blacks is nothing new in American culture (Hawkins 1995). But in recent years, the typification of crime as a black male threat has achieved iconic proportions. From Willie Horton to Charles Stuart to Susan Smith, the fac- ile link of race and crime has been used to gain electoral advantage and to confound the search for justice (Anderson 1995).' The same putative threat is routinely invoked to justify things as profound as the shooting of unarmed black men by New York City police and as pro- saic as the non-delivery of pizza and the "unavailability" of taxi cabs in predominantly black neighborhoods (West 1994). So pervasive is the presumption of criminal threat in relation to black men that observers as disparate as James Q. Wilson and the reverend Jesse Jackson have expressed similar senti- ments on the issue. In a speech decrying black on black crime, Jackson acknowledged feeling "relief" when an approaching urban stranger was not a young black male (Cohen 1993:A23) and Wilson argued that "it is not racism that makes whites uneasy about blacks . .. it is fear. Fear of crime, of drugs, of gangs, of violence" (1992:A16). The authors are grateful to Gary Kleck and the anonymous
  • 3. reviewers for this journal for helpful commentary on an earlier draft of this paper. An earlier version of this paper was presented at the annual meeting of the American Soci- ety of Criminology (November, 1998). Direct correspondence to: Ted Chiricos, School of Criminology and Criminal Jus- tice, Florida State University, Tallahassee, FL 32306. E-mail: [email protected] 1. Stuart in Boston, killed his wife, and Smith in South Carolina drowned her sons, and for some time in both cases, police attention was focused on alleged black male assailants. SOCIAL PROBLEMS, Vol. 48, No. 3, pages 322-340. ISSN: 0037-7791; online ISSN: 1533-8533 @ 2001 by Society for the Study of Social Problems, Inc. All rights reserved. Send requests for permission to reprint to: Rights and Permissions, University of California Press, Journals Division, 2000 Center St., Ste. 303, Berkeley, CA 94704-1223. by guest on N ovem ber 27, 2016 http://socpro.oxfordjournals.org/ D ow nloaded from http://socpro.oxfordjournals.org/
  • 4. Perceived Composition of Neighborhood and Risk of Crime 323 The conflation of race and criminal threat is so well established that some regard popular discourse about crime and punishment to be part of the rhetorical code of "modern racism" (Entman 1990; Gilens 1996), an implicit objective of which is thought to be the better control of young black men (Szkowny 1995). Indeed, it is argued that recent waves of popular anxi- ety and punitive legislation-despite falling crime rates-are directly energized by the pre- sumed link between race and crime (Chiricos 1996; Tonry 1995). A similar sentiment underlies the "social threat" approach to the sociology of social con- trol. With origins in the seminal work of Blalock (1967), those developing the social threat perspective argue that aggregate measures of punitiveness will vary with aggregate measures of racial composition because the presence of blacks creates a fear of crime that helps to mobi- lize punitive responses. An early thematic expression of this position was articulated by Liska and Chamlin who extended social threat inquiry from the analysis of police department size (Jackson and Carroll 1981; Liska, et al. 1981) to arrest rates in relation to the racial composi- tion of cities: The threat hypothesis underlying the recent work on police size suggests that a high percentage of nonwhites produces an emergent property, "perceived threat of crime," which increases arrest rates through increasing pressure on police to control crime
  • 5. (1984:384-5). Social threat research has since explored the link between racial composition of place and various measures of social control, including rates of arrest (Harer and Steffensmeier 1992; Liska, et al. 1985), size and funding of police departments (Chamlin 1989; Chamlin and Liska 1992; Greenberg, et al. 1985; Jackson 1989), individuals' chances of incarceration (Myers and Talarico 1986, 1987) and aggregate rates of imprisonment (Bridges, et al. 1987; Delone 1992). At the heart of these structural analyses of racial composition, social threat and social control are micro-processes involving the lived experiences of individuals who are situated in those structural circumstances.2 The racial composition of a place can only be consequential for social control if human actors situated in those social circumstances are aware of the racial composition, concerned about it and respond in ways that mobilize control initiatives. This approach to understanding how structural relationships function was explicitly recognized by Blalock in relation to his "power threat" hypothesis when he asked, "Why should the size of a minority affect discrimination ... ?" His answer highlights the importance of individual level factors operating through situated actors at the heart of structural relationships: In asking this kind of "why" question, one is presumably requesting that individual motivations be brought into the picture.... Behind this position, I assume, is the philosophical assumption that
  • 6. individual goals, motives and needs are major causal agents in social systems and that adequate explanation requires that they be taken into account (1967:28).' Arguably, the most salient individual level process operating at the core of social threat relationships is the perception of criminal danger that may be associated with the perception that blacks live nearby.4 It is this relationship which is assumed by most social threat research, and it is this relationship which the present study examines. We are not testing the social threat hypothesis. But in studying the relationship between perceived racial composition of neighborhood and perceived threat of crime, we test a relationship that is presumptively at the core of social threat explanations of social control. And, as noted above, that relationship 2. Giddens notes that social structures exist in and through individual practices and action. Moreover, social struc- tures "only exist in the reproduced conduct of situated actors" (1976:127). 3. Blalock (1967) at various points made reference to the "fear of competition," "fear of power threat," "perception of competition," and "personality factors" as "intervening variables in the analysis" informed by his structural model linking racial competition and discrimination. 4. Another micro-process embedded within social threat relationships is the willingness of threatened individuals to call the police, an issue examined by Warner (1992). by guest on N ovem
  • 7. ber 27, 2016 http://socpro.oxfordjournals.org/ D ow nloaded from http://socpro.oxfordjournals.org/ 324 CHIRICOS/McENTIRE/GERTZ is also understood to play a significant role in popular and political culture and in the daily structuring of relations between people of different races. Specifically, in this study we examine whether the perceived racial and ethnic composition of neighborhood is related to the perceived risk of crime for a random sample of 3,000 Florida adults interviewed in the fall of 1996. Perceived risk is our measure of criminal threat and for reasons described below, we assume the perception of neighborhood racial composition is more salient for perceived risk than objective measures of that structural circumstance. This is the first study of this question to include Hispanics-the largest and fastest growing minority in Florida-as both respondents and as ethnic "others" who may be the source of criminal threat to some. Most important, we examine the geographical and social context of this rela- tionship. We are especially interested in possible differences
  • 8. between South Florida-which is the most racially and ethnically diverse region in the state-and other parts of Florida. To the extent that we find the perception of crime risk to be independently related to the perception of proximate blacks, we will have support for one causal linkage presumed to be operating at the heart of social threat explanations of social control. We will have evidence as well, of what some have termed "modern racism" and what others regard as a seriously debil- itating feature of contemporary race relations. To the extent that the proximity of Hispanics is related to crime threat, and to the extent that we find any of these relationships to be region- ally contextual, we may have the kind of micro-level data that Blalock (1967) recognized as useful for suggesting prospective modifications in macro- theories of social control.5 Prior Research: Racial Composition of Place and Perceived Threat of Crime To date, eight studies have addressed the relationship between racial composition of place and perceived threat of crime. Six use an objective measure of racial composition. Perceived criminal threat has been operationalized in several ways, including alternative measures of fear and a consistent measure of perceived neighborhood safety.6 We argue below that per- ceived risk is a less ambiguous and more accessible measure of threat and we choose to use it. None of the studies reviewed here operationalized perceived threat in terms of perceived risk.
  • 9. The work of Liska and his colleagues (1982) was expressly tied to the macro-level ques- tions of race and social control noted above. Their unit of analysis was cities (N = 26) and average levels of perceived neighborhood safety were computed using 1972-73 NCS data. There was no mention of statistical significance, but after controlling for crime rates, percent non-white produced the strongest Betas in multi-variate estimates for both white and non- white perceived safety.7 When rates of inter-racial robbery were controlled, the effects of racial composition on fear of crime were greatly reduced for whites, but not for non-whites (1982:766). Qualified support for the hypothesized relationship using objective measures of racial composition was reported by Ward, et al., (1986) and Thompson, et al., (1992). The former found that in up-state New York during 1980, among predominantly white, elderly (60+) respondents, the percentage black in one's census tract was related to perceived neighborhood safety-but only among those experiencing health or "mastery" problems (Ward, et al. 5. Blalock considered one value of conceptualizing "intervening variables" measured at the individual level to be "... that a careful micro-level analysis of psychological factors may suggest modifications in the [power threat] theory" (1967:29).
  • 10. 6. One problem in the study of crime threat-a problem not limited to studies of racial composition-is the variety of measures used to operationalize the concept. "Fear," "perceived safety," and "perceived risk" have all been used with some frequency (Ferraro 1995). 7. In the brief discussion of these findings in their 1981 paper, Liska, et al., mention that "only percentage nonwhite has a statistically significant effect" (1981:423). by guest on N ovem ber 27, 2016 http://socpro.oxfordjournals.org/ D ow nloaded from http://socpro.oxfordjournals.org/ Perceived Composition of Neighborhood and Risk of Crime 325 1986:335). The Thompson, et al. (1992) study used 1984 Louisiana survey data (N = 1,850) and found that the black/white ratio of respondent's county was related to perceived neigh- borhood safety but not to fear of crime. Ralph Taylor and Jeannette Covington did two separate analyses on the basis of their 1982 Baltimore neighborhood data. In the first, after controlling
  • 11. for a variety of individual and neighborhood characteristics, they found lower levels of perceived safety among people living in predominantly black (>90%) neighborhoods. They also found lower levels of perceived neighborhood safety for those "whose racial identity--whether black or white-diverges more from neighborhood racial composition." They concluded: "regardless of the respondent's race ... those more different racially from their neighbors have more fear" (Covington and Taylor 1991:243). Taylor and Covington's (1993) second analysis focused on changes in minority and youth populations in 66 neighborhoods between 1970 and 1980. They found that racial com- position (% Black) predicted perceived safety (both day and night) independent of the effects of incivilities, change in minority youth population, and the presence of unsupervised teenagers. Like Covington and Taylor, Chiricos, Hogan, and Gertz (1997) measured racial composi- tion at the census block level. Their data, based on a survey of 1,850 Tallahassee, Florida adults in 1994, generated no significant relationships with fear of crime-for either blacks or whites-using this objective measure of racial composition. Their analysis controlled for crime victim experience and perceptions of crime trends in one's neighborhood among other factors. The Tallahassee study also employed a measure of perceived racial composition, which asked respondents to estimate the percentages of blacks and whites among those living within a mile of their residence. The low bi-variate correlations
  • 12. between objective and perceptual measures of racial composition reported for whites (.16) and for blacks (.30) in this sample are not surprising in light of national surveys that show whites in particular greatly overestimate the proportion of blacks in the general population (Nedau, et al. 1993). Chiricos, et al. (1997:120) found that the perceptual measure of racial composition was related to fear of crime, though only for white respondents who perceived themselves to be in the racial minority. Two other studies examined the impact of perceived racial composition on perceived threat of crime. Moeller's (1989) Illinois survey in 1981 (N = 764) asked respondents to describe their neighborhood in one of five categories ranging from "all white" to "all black." By itself, this measure was unrelated to fear (would be afraid to walk alone at night) in a multi-variate estimate. Moeller then combined the perceptual measure with respondent's race and the mul- tiplicative interaction term was found to be related to the fear of crime. The author concluded that, "we can identify white respondents living in racially mixed neighborhoods as those most likely to report fear" (Moeller, 1989:216). Skogan's (1995) assessment of this issue made use of responses by 1,396 whites to the GSS survey for the period of 1988-90. The survey did not ask about racial composition per se, but it asked whether "blacks lived nearby" and if yes, "how far away." The response categories were: "same block," "1-3 blocks," "4-8 blocks," and "none nearby." Skogan controlled for a
  • 13. number of factors, including crime victim experience, and found that "when all of these fac- tors are controlled for ... [perceived] residential proximity of blacks . . . remained indepen- dently linked to fear" (1995:65). The evidence to date is generally supportive of the premise that minority presence- actual or perceived--is related to perceived threat of crime. Whether threat is operationalized in terms of fear of crime (Chiricos, et al. 1997; Moeller 1989; Skogan 1995; Thompson, et al. 1992) or perceived neighborhood safety (Covington and Taylor 1991; Liska, et al. 1982; Taylor and Covington 1993; Ward, et al. 1986), each study claims at least some support for this relation- ship, especially among white respondents. But the available evidence is limited in several respects. First, with the exception of Chiricos, et al. (1997), the data addressing this question are from ten to almost thirty years old. Much has happened in recent years that could be relevant for this relationship. Most important per- haps, is the media saturated imaging of crime as a black male phenomenon (Barak 1994). by guest on N ovem ber 27, 2016 http://socpro.oxfordjournals.org/ D ow
  • 14. nloaded from http://socpro.oxfordjournals.org/ 326 CHIRICOS/McENTIRE/GERTZ Important as well is the increasingly politicized nature of the "crime problem" and the spate of "get tough" agendas that have become central features of political rhetoric on the part of both major parties at almost all levels of government. In addition, most of the analyses have been limited to white respondents. The two excep- tions (Chiricos, et al. 1997; Liska, et al. 1982) include "black" and "non-white" respondents respectively, for whom contradictory results are reported. Also, in previous studies, the mea- sure of racial composition is limited to a black/white proportion or ratio. The present research includes Hispanic respondents and broadens the measure of perceived racial composition to include the proportion Hispanic, as well as the proportion black and white. The evolving racial and ethnic mix of many parts of this country clearly warrants these analytical extensions. The Present Research This study examines whether perceived racial and ethnic composition of one's neighbor- hood is related to perceived threat of crime independent of other factors that could predict threat. We analyze this relationship separately for black,
  • 15. Hispanic, and white Floridians, and our measures of perceived racial composition include the proportion of people living within a mile who are black, white, or Hispanic. We consider whether these relationships vary by region, with particular attention paid to South Florida, which has exceptionally high levels of crime, an extraordinary mix of racial and ethnic groups, and a recent history of vigorous polit- ical and economic competition. Sample In August and September of 1996, we interviewed 3,000 Florida residents by telephone. Respondents were randomly chosen from adults (18 years and older) having the most recent birthday in households accessed by random digit dialing.s Spanish-speaking interviewers were used for calls to predominantly Hispanic areas. The final sample had the following characteris- tics, which are compared (in parentheses) with the 1996 demographics for Florida: female, 55% (52%); black, 11% (12%); Hispanic, 14% (14%); age 65 or over, 15% (18.5%). Dependent Variable: Perceived Risk of Criminal Victimization To date, research on racial composition and perceived threat of crime has operationalized the latter in three ways. The most common approach asked respondents "how safe" they feel in their neighborhoods (Covington and Taylor 1991; Liska, et al. 1982; Taylor and Covington 1993; Thompson, et al. 1992; Ward, et al. 1986). This measure is probably best understood as a cognitive
  • 16. assessment of risk-posed in general terms (Ferraro and LaGrange 1987). The presumably affective state of fear was measured two ways. Moeller (1989) and Skogan (1995) asked respondents whether there is an area nearby where they "would be afraid" to walk alone at night. This measure of fear is somewhat hypothetical since it poses a situation that many people would not allow themselves to encounter (Ferraro 1995). Two studies asked respon- dents how much they feared specific crimes (Chiricos, et al. 1997; Thompson, et al. 1992). 8. The survey was conducted by The Research Network, Inc., a public opinion polling firm in Tallahassee, Florida. A two-stage Mitofsky-Waksberg sampling design was utilized and a 10 call-back rule was employed before replacement. A cooperation rate of 80% was realized, meaning that interviews were completed for 80% of all contacts with eligible respondents. Cases of unknown eligibility (busy signals, no answer, and answering machines) and known ineligibility (business, fax, and disconnected) were excluded from this calculation as recommended by the American Association for Public Opinion Research (1998). by guest on N ovem ber 27, 2016 http://socpro.oxfordjournals.org/ D ow nloaded from
  • 17. http://socpro.oxfordjournals.org/ Perceived Composition of Neighborhood and Risk of Crime 327 Ferraro (1995) argued that crime specific, non-hypothetical measures are probably the best approach to measurement in this area. We agree and would add that it seems reasonable to expect that some people (e.g., young adult males) would be more willing and able to assess their chances of victimization (a cognitive judgment of risk) than to admit they are afraid. Per- ceived risk of victimization is arguably a more accessible and unambiguous measure of criminal threat than fear. For these reasons, our choice to operationalize perceived criminal threat is a crime specific measure of perceived risk of victimization. Respondents were asked this question: Now I want you to rate the chance that a specific crime will happen to you during the coming year. On a scale from one to ten, where one means not at all likely and ten means very likely, how likely do you think it is that you will have your car stolen; have someone break into your house while you are away; have someone break into your house while you are there; be robbed or mugged on the street; be raped or sexually assaulted; be murdered? Responses across the six crimes were aggregated for each respondent into a total risk index (RISK) with an alpha of .90 for the full sample. Independent Variables
  • 18. Recent survey data suggest that perceptions of racial composition of the national popula- tion seriously distort reality. Whereas blacks comprised only 12% of the population and His- panics 9% in 1990, a Gallup survey in that year reported that "the average American" thinks that America is 32% black and 21% Hispanic (Nedau, et al. 1993:343). Also, Chiricos, et al. (1997) reported weak bi-variate correlations between actual and perceived racial composition for white (.16) and black (.30) respondents, and that only their perceptual measure was related to fear. Moreover, if racial composition of one's neighborhood is going to be relevant for criminal threat, it must first be perceived (or misperceived) and be understood as threaten- ing. Whatever the actual demographics, how they are perceived by respondents is what should matter most in the development of threat. For these reasons, we use perceived racial and ethnic composition of neighborhood as our principal independent variable. It is operationalized by this question: If you think about your neighborhood and the people living within a mile of your house-what percent of those people would you say are White ... African American ... Hispanic ... Other? PRCBLK and PRCHISP are the variable names for the perceived proportion of blacks and Hispanics living within a mile of the respondent. Other independent variables used to model risk of crime in this study include respon-
  • 19. dents' AGE, measured continuously, household INCOME (five categories) and three dummy variables, BLACK (non-black = 0), HISPANIC (non-Hispanic = 0) and FEMALE (male = 0). Early research reported a positive association between AGE and measures of fear (Clemente and Kleiman 1976; Jaycox 1978) but recent work (Bankston and Thompson 1989; Ferraro 1995) has found otherwise. FEMALE is the trait most often associated with high levels of per- ceived risk or fear (Ferraro and Lagrange 1992; Karmen 1991) and BLACK respondents con- sistently report higher fear levels than whites (Ortega and Myles 1987; Parker and Ray 1990). The latter is attributed to a higher risk of victimization or the presence of "incivilities" in pre- dominantly black or poor neighborhoods (Covington and Taylor 1991; LaGrange, et al. 1992). Similar considerations prompt our expectation that INCOME and EDUCATION will be inversely related to perceived risk of victimization. Almost no risk or fear research includes Hispanic respondents. Four crime-related predictors of RISK are included. Two are perceptual and assess whether the respondent thinks crime has increased during the past year in the United States (CRIMEUS) or in one's neighborhood (CRMHOOD). In both cases (yes = 1) we expect per- by guest on N ovem ber 27, 2016 http://socpro.oxfordjournals.org/
  • 20. D ow nloaded from http://socpro.oxfordjournals.org/ 328 CHIRICOS/McENTIRE/GERTZ ceived risk to be associated with perceptions of increasing crime. Whether or not a member of the respondent's household has been the victim of a crime in the past year (HVICTIM) is included as are 1996 Index crime rates for respondents' city of residence (CRMTTL96). For all variables used in these analyses Table 1 reports coding information, means and standard devi- ations, as well as bi-variate correlations with perceived risk.9 Research Findings The data are analyzed using ordinary least squares (OLS) regression.'" There are no appar- ent problems of multi-collinearity, with tolerance levels consistently above .70 and no bi-variate correlations involving independent variables that exceed .38 (education and income)." Modified Glesjer tests indicate that the assumption of homoskedasticity is violated with the vari- ance of errors associated with several independent variables." As a result, LIMDEP's (7.0) OLS which uses White's (1980) correction for heteroskedasticity of standard errors is employed
  • 21. and all findings reflect this correction. Except for PRCBLK and PRCHISP, which are theoreti- cally central to these analyses, non-significant predictors are eliminated from the final models presented here." Cases for which data are missing for any predictor are also eliminated. The analysis proceeds in three steps. We first examine the relationship between perceived risk of victimization and perceptions that blacks and Hispanics live nearby, using the full sam- ple of surveyed respondents. Next, we examine that relationship for black, Hispanic, and white respondents separately. And finally, we assess that relationship for black, Hispanic, and white respondents living in South Florida, and for those living elsewhere in the state. The results reported for the full sample (Table 2) and for the sample disaggregated by race and eth- nicity (Table 3) should be considered preliminary to the more fully developed, regionally con- textual results reported in Table 4. Table 2 reports the results of the basic regression estimate for perceived risk using the entire sample with both perceived percent black and perceived percent Hispanic as predictors.'4 Unstandardized coefficients are shown with standard errors in parentheses. These data show that perceived risk is significantly higher for females, blacks, Hispanics, and for those who per- ceive crime increasing in their neighborhood or the nation and for those who recently experi- 9. Other variables not discussed above (marital and employment status) are listed in Table 1 because they were
  • 22. used in preliminary models of RISK but were non-significant and eliminated. 10. Because city-level crime rates are used in conjunction with individual level variables, it is possible that the assumption of independence of error terms may be violated by the use of a single level OLS regression strategy. That is, respondents from the same city may share similarities resulting from their common locality and the effect of the individ- ual level predictors may then vary, depending on the city. If this was the case, multiple level modeling would be neces- sary to capture the nested structure of individuals within cities, a strategy that Rountree and Land (1996) used in their census tract level study of perceived risk. To assess this possibility, an unconditional two-level model was estimated using HLM5 to determine if there was evidence of city-to-city variation. The level 1 model contained all predictors that were significant for the full sample in the original OLS estimate. The level 2 model, aggregated at the city level, esti- mated each level 1 predictor with a random residual, thereby allowing the errors to be dependent within each city. The intercept in this model was also estimated with a random residual to determine if the mean level of perceived risk varied across cities. Statistical significance of a residual variance in this model would suggest that there is true variability of the associated individual-level regression coefficient. Statistical significance of the residual variance of the intercept would indicate between-city variation in the mean level of perceived risk. In this instance, none of the variances was significant, suggesting that the effect of the predictors and the mean level of perceived risk do not vary significantly
  • 23. across cities and that multiple level modeling is not necessary for these data (Tate 1998). 11. The correlation of BLACK and PRCBLK is .46 and for HISPANIC and PRCHISP is .50, but these appear together only in the initial equations for the full sample reported in Table 2. 12. These include FEMALE, BLACK, HISPANIC, INCOME, PRCBLK and CRIMEUS. 13. We have theoretically grounded assumptions for the directions of the relationships involving RISK and one- tailed tests of significance are used throughout. 14. To simplify presentation, we assume it is clear that racial and ethnic composition are perceptual measures and it is unnecessary to say "perceived" every time they are mentioned. by guest on N ovem ber 27, 2016 http://socpro.oxfordjournals.org/ D ow nloaded from http://socpro.oxfordjournals.org/ Perceived Composition of Neighborhood and Risk of Crime 329
  • 24. Table 1 * Variables Used in the Analysis, Including Bivariate Correlations with Risk Variable Name Description and Coding Mean Std. Dev. Risk Dependent variable RISK Index-R's overall perceived risk of 21.44 13.24 crime for six crimes. Scale 6-60 (highest risk) Independent variables PRCBLK Perceived percentage of Blacks in 19.05 21.88 .137* neighborhood. Scale 0-100 PRCHISP Perceived percentage of Hispanics in 14.49 22.25 .233* neighborhood. Scale 0-100 AGE Age of respondent at last birthday 44.38 16.84 -.072* FEMALE Sex of Respondent .55 .50 .221* 1 = Female, 0 = Male BLACK Race of respondent--Black .1067 .3087 .166* 1 = Black, 0 = All others HISPANIC Race of respondent-Hispanic .1400 .3470 .267* 1 = Hispanic, 0 = All others CRIMEUS Crime in U.S. has increased (perceived) .8518 .3554 .142* 1 = Yes, 0 = No CRMHOOD Crime in neighborhood has increased .3103 .4627 .114*
  • 25. (perceived) 1 = Yes, 0 = No EDUC R's highest level of schooling completed 2.95 1.16 - .193* 1 = Less than high school 2 = High school / GED 3 = Some college/AA 4 = College graduate 5 = Graduate/Professional INCOME R's household income past year 2.82 1.20 -.183* 1 = <$15,000 2 = 15,000-29,000 3 = 30,000-49,000 4 = 50,000-75,000 5 = >75,000 CRMTIL96 UCR Index crime rate by city, 1996 10456 4233 .158* HVICTIM Member of R's household been a .16 .37 .098* victim of crime in past year 1 = Yes, 0 = No MARRIED R is currently married .57 .50 -.021* 1 = Yes, 0 = No EMPLOYED R is currently employed .68 .47 -.026* 1 = Yes, 0 = No enced criminal victimization. Lower levels of RISK are reported for respondents with higher income and education. Table 2 also shows that for the full sample, PRCBLK and
  • 26. PRCHISP are both significantly related to RISK independent of the effects of other predictors, most importantly, respondent's victimization experience and their perceptions of crime trends. This is the first reported evi- by guest on N ovem ber 27, 2016 http://socpro.oxfordjournals.org/ D ow nloaded from http://socpro.oxfordjournals.org/ 330 CHIRICOS/McENTIRE/GERTZ Table 2 * Regression of Risk of Crime on Racial/Ethnic Composition of Neighborhood With and Without Controls for Crime Rates--Full Samplea Variable Risk FEMALE 5.328*** (.541) BLACK 7.475*** (1.196) HISPANIC 6.612***
  • 27. (1.039) CRIMEUS 3.298*** (.689) CRMHOOD 1.967*** (.600) EDUC -1.070*** (.262) INCOME -.655** (.255) HVICTIM 3.149*** (.719) CRMTTL96 .190 x 10-3** (.665 X 10-4) PRCBLK .032* (.017) PRCHISP .083*** (.018) Constant 14.397 Adjusted R2 .238 N 1769
  • 28. a Unstandardized coefficients and (standard errors) reported. * p < .05 ** p < .01 *** p < .001 dence of a link between ethnicity (PRCHISP) and the perceived threat of crime and it indicates that such threat is more broadly socially structured than has been previously described. For Table 2, standardized Beta coefficients, which are available on request, suggest that PRCHISP (.136) is a stronger predictor than PRCBLK (.054) and stronger as well than victim experience, crime rates, perceptions of crime trends, income and education. The Beta value for PRCBLK is actually smaller than those of all other predictors. For the full sample of Florida adults then, the perception that Hispanics live nearby is apparently more threatening in terms of crime victim risk than perceptions concerning blacks. In previous research, a relationship between racial composition of place and "fear of crime" is most consistently reported for white respondents (Liska, et al. 1982; Moeller 1989; Skogan 1995) and the most recent of these studies (Chiricos, et al. 1997) found that fear of crime was related to perceived percent black only among white respondents. Table 3 shows sep- arate regression results for RISK among Hispanic, black and white respondents. For all three groups, females and respondents with lower education are more likely to per - ceive risk of victimization but the influence of other predictors
  • 29. varies by race and ethnicity of by guest on N ovem ber 27, 2016 http://socpro.oxfordjournals.org/ D ow nloaded from http://socpro.oxfordjournals.org/ Perceived Composition of Neighborhood and Risk of Crime 331 Table 3 * Regression of Risk of Crime on Racial/Ethnic Composition of Neighborhood-Racial/Ethnic Subsamplesa Variable Hispanics Blacks Whites FEMALE 6.444*** 10.609*** 4.578*** (1.749) (1.973) (.542) CRIMEUS 8.246*** n.s. 2.697*** (2.500) (.677) CRMHOOD n.s. 5.320** 1.737** (2.082) (.605) EDUC - 1.828** -2.907*** - .867*** (.785) (.873) (.256)
  • 30. INCOME - 1.632* n.s. n.s. (.794) HVICTIM n.s. n.s. 2.742*** (.782) CRMTTL96 -.626 X 10-4 .487 x 10-3* .197 X. 10-3** (.228 X 10-3) (.262 X 10-3) (.645 X 10-4) PRCBLK .087* -.024 .039* (.047) (.032) (.019) PRCHISP .088*** .064 .074** (.028) (.067) (.023) Constant 24.105 23.677 12.634 Adjusted R' .171 .176 .114 N 270 216 1364 a Unstandardized coefficients and (standard errors) reported. * p < .05 ** p < .01 *** p < .001 respondent. For example, victim experience increases perceived risk only for whites while higher income reduces RISK only for Hispanics. More important for our central concern is the fact that neither PRCBLK nor PRCHISP are significant predictors of perceived victimization risk among black respondents, but both are significant predictors of RISK for Hispanics and whites. Looked at more closely, the results for black respondents suggest two things. First, the perception that blacks live nearby in greater numbers may actually reduce perceived victim risk
  • 31. among African Americans, while the perception that Hispanics live nearby increases that risk. The lack of statistical significance for these results (especially involving PRCHISP) may be a function of the small sample size for black respondents, but the pattern may be worth further study. Unreported Beta coefficients show that for Hispanic and white respondents, PRCHISP is not only a stronger predictor of RISK than PRCBLK, but the perception that Hispanics live nearby is-after FEMALE-the strongest predictor of victim risk for both groups. To this point we know that for all Floridians, and for specific demographic groups, ethnic threat associated with Hispanics is more consequential than racial threat associated with blacks in the genesis of perceived victimization risk. Whether this pattern is consistent across all of Florida or is limited to South Florida, which has a substantial Hispanic population, is examined next. As noted above, South Florida is among the most racially and ethnically diverse areas in by guest on N ovem ber 27, 2016 http://socpro.oxfordjournals.org/ D ow nloaded from
  • 32. http://socpro.oxfordjournals.org/ Table 4 * Regression of Risk of Crime on Racial/Ethnic Composition of Neighborhood for South Florida and Not South Florida-Racial/Ethnic Subsamplesa Hispanics Blacks Whites Not Not Not Variable South Florida South Florida South Florida South Florida South Florida South Florida AGE n.s. n.s. - .095 .168* n.s. n.s. (.101) (.086) FEMALE 4.858* 13.097*** 6.006* 12.958*** 5.088*** 4.379*** (2.176) (2.038) (3.242) (2.482) (1.162) (.612) CRIMEUS 7.439** 8.938*** n.s. n.s. 2.874* 2.581*** (3.198) (2.815) (1.538) (.753) CRMHOOD n.s. n.s. 6.627* 2.913 3.251** 1.326* (3.001) (2.767) (1.192) (.698) EDUC - 1.685* - 1.904* -3.357** - 3.015** -.089 -1.087*** (1.010) (1.122) (1.314) (1.115) (.544) (.289) INCOME - 2.052* .221 n.s. n.s. n.s. n.s. (.959) (1.135) HVICTIM n.s. n.s. n.s. n.s. -(1.253 3.796*** .496) (.912)
  • 33. CRMTTL96 -.453 X 10-3 -.457 X 10-' -.670 X 10-3 .276 X 10-3 .261 X 10-3* .199 X 10-** (.397 X 10-3) (.311 X 10-3) (.625 X 10-3) (.377 X 10-3) (.138 X 10-3) (.793 x 10-4) PRCBLK .042 .202** -.073 .007 .105** .030 (.056) (.080) (.055) (.040) (.044) (.021) PRCHISP .044 .128* -.085 .114 .091"** .057 (.034) (.061) (.104) (.071) (.027) (.039) P Level Slope Difference for PRCBLK P = .051 P = .119 P = .062 P Level Slope Difference for PRCHISP P = .115 P = .057 P = .236 Constant 35.330 13.811 53.057 17.366 7.621 13.704 Adjusted R2 .105 .416 .118 .225 .125 .110 N 195 75 79 134 321 1043 a Unstandardized coefficients and (standard errors) reported. * p < .05 ** p < .01 *** p < .01 Cc rrl N by guest on N ovem ber 27, 2016 http://socpro.oxfordjournals.org/ D
  • 34. ow nloaded from http://socpro.oxfordjournals.org/ Perceived Composition of Neighborhood and Risk of Crime 333 the country. Dade County (Miami) is 56% Hispanic and 20% black." Growing proportions of Hispanics pose both an economic and political threat not only to whites but to blacks as well.'6 This is amplified by the fact that many Cuban immigrants are economically successful and quite active politically in parts of South Florida. In demographic, social, cultural, and other ways, South Florida is different from the rest of the state. The question is whether South Florida makes a contextual difference for how the perceived racial and ethnic composition of neighbor - hoods relate to perceived risk of crime. To address this question, we divided our sample into those who live in "South Florida" and those who do not. For these purposes, South Florida is defined as comprising Broward, Dade, Monroe and Palm Beach counties, which together have a population of 4,420,000 or 31% of the entire state. As illustrated in Figure 1, this is the extreme southeastern tip of Florida where the population is 32% Hispanic and 19% black. The remainder of the state, excluding this area, is 6% Hispanic and 12% black. Looked at another way, South Florida as we define
  • 35. it, contains 70% of the state's Hispanic population and 41% of blacks in the state. Table 4 summarizes the results of regression estimates of RISK for those who do and do not live in South Florida. Separate results are reported for Hispanic, black, and white respon- dents. We report as well, the p-levels associated with tests for the significance of differences between slopes in the "South Florida" and "Not South Florida" contexts for PRCBLK and PRCHISP. The results in Table 4 show that regardless of where they live, perceived risk of victimiza- tion among black respondents is not significantly related to these measures of perceived racial and ethnic composition of neighborhood. Again, the small N's involved likely mitigate the possibility of significant coefficients for black respondents, but the signs of the relationship suggest that within South Florida, the perceived presence of other blacks or Hispanics, is asso- ciated with lower perceptions of criminal risk for black respondents. The picture for Hispanics and whites is quite different. Both PRCBLK and PRCHISP pre- dict RISK for Hispanics-but only if they live outside of South Florida. And for whites, PRCBLK and PRCHISP predict RISK-but only for those living within South Florida. The only statisti- cally significant regional slope difference in Table 4 involves PRCBLK among Hispanics, but two other differences are close to the p < .05 standard.
  • 36. In sum, it is clear that in the racially and ethnically diverse context of South Florida, the threat inducing effects of PRCBLK and PRCHISP are limited to white respondents. Outside of South Florida, there are no significant effects of racial and ethnic composition of neighbor- hood for whites. But at the same time, outside of South Florida, Hispanic respondents are threat- ened in relation to the perceived proximity of other Hispanics and blacks. The small N's for black and Hispanic subsamples warrant caution when interpreting these region specific results. Discussion This is the first study of perceived crime threat posed by racial or ethnic minorities that includes Hispanic respondents and includes the perceived proximity of Hispanic residents as a possible inducement to that threat. This is also the first assessment of this issue to use crime- specific risk as a measure of threat, and the first to control for actual levels of crime using data more recent than 1982 (Taylor and Covington 1993). By comparing results from "South Florida" with those from elsewhere in the state this study provides the first attempt to determine whether the relationship between perceived threat and perceived racial or ethnic composition of neighborhood is regionally contextual. Our findings are briefly summarized and then discussed. 15. In 1960, Dade was 5.4% Hispanic and 14.7% black (Warren, et al. 1990:159). 16. "While the analogy is exaggerated to be sure, former city of Miami Mayor Maurice Ferre's description of
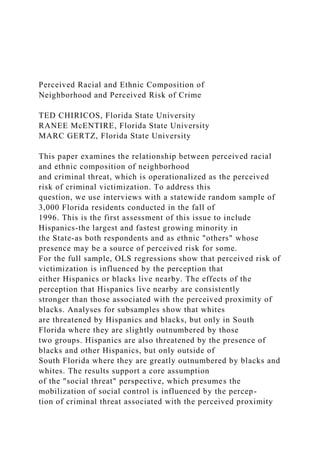
  • 37. Miami as the 'Beirut of the West' suggests the depth of the cleavages that have existed" (Warren, et al. 1990:176). by guest on N ovem ber 27, 2016 http://socpro.oxfordjournals.org/ D ow nloaded from http://socpro.oxfordjournals.org/ 334 CHIRICOS/McENTIRE/GERTZ & aa Holme W O 0 ackson cn r BWash- h ingtadsde Hamilto Bay nou n s Libert Wakulla wane E ulf a5 naylor La- Clay Iis Alachua hrisu Dixi hPutna U Levy Marion Citrus 1v Hernando Orge Pasco sceola Pinellas Polk Indian ver anate Harde Okee- High hobet.e Sarasota Desoto land rtin harlottt Glades REM Lee Hendry
  • 38. Monroe ..AW d10~ Figure 1 * Map of Florida, Highlighting South Florida 1. For the full sample, and for Hispanic and white subsamples, the perception that either blacks or Hispanics live nearby elevates RISK, independent of the effects of local crime rate. However, the nature of those relationships is importantly conditioned by whether respondents live in South Florida or not. 2. For black respondents perceived racial and ethnic composition of neighborhood is not significantly related to perceived risk. However, there is some indication that the per- ceived proximity of other blacks reduces RISK and the perceived proximity of Hispan- ics increases RISK for blacks, especially outside of South Florida. by guest on N ovem ber 27, 2016 http://socpro.oxfordjournals.org/ D ow nloaded from http://socpro.oxfordjournals.org/
  • 39. Perceived Composition of Neighborhood and Risk of Crime 335 3. For Hispanic respondents living in South Florida, the perceived proximity of blacks or other Hispanics is unrelated to RISK. For Hispanics living outside of South Florida, blacks and Hispanics living nearby elevate RISK. 4. White respondents living outside of South Florida express no perceived victim risk in relation to the perceived proximity of blacks or Hispanics. Within South Florida, whites perceive greater RISK when either blacks or Hispanics are thought to live nearby. The finding that perceived risk of criminal victimization is elevated by the perception that blacks live in one's neighborhood is consistent with "race coding" (Gilens 1996), a kind of a shorthand equation between blackness and crime. Such coding may play into a diffuse and generalized "anti-black affect" which is described by some as central to "modern racism" (Ent- man 1990, 1992). The use of color as a proxy for danger is consistent as well with what has been termed "reasonable" racial discrimination and finds expression in well publicized "profiling" of suspects by law enforcement, and the innumerable suspicions and exclusions that characterize everyday inter-racial interaction (Kennedy 1997; West 1994). Though not a test of "social threat" per se, this finding is also consistent with an essential
  • 40. micro-process that lies at the core of the social threat perspective. The only way that racial composition of place could come to have consequence for social control initiatives is if people situated in those circumstances, perceive the racial composition, experience threat, and then act in ways that mobilize control. Our data cannot speak to the mobilization of control, but the antecedent elements necessary for that mobilization are demonstrated by these findings. More important perhaps, is the finding that the threat of crime is not simply and exclu- sively a function of the perception that blacks live nearby. To this point, virtually all of the pop- ular and academic discourse on crime threat has been framed in black and white terms. For example, the criminologist Katheryn Russell recently suggested that "blacks are the repository for the American fear of crime" (1998:xiii), and Senator Bill Bradley observed that "fear of black crime covers the streets like a sheet of ice" (quoted in Skogan 1995:60). It is the "black man" who is most often seen as "today's prevailing criminal predator" (Barak 1994:137) or is identified in hoaxes that seek to deflect criminal blame or create anxiety (Russell 1998:71). But for this Florida sample, the perception that Hispanics live nearby in greater numbers is more strongly related to criminal threat than perceptions about the residential proximity of blacks. Using perceived risk of victimization as the measure of criminal threat, PRCBLK and PRCHISP are significant for the same subsamples and regional contexts, but the relative mag-
  • 41. nitude of standardized Betas consistently favors PRCHISP. This further suggests that ethnic diversity may be more threatening than racial diversity in Florida-a state where the Hispanic population (14%) has grown to be larger than the black population (12%). Inasmuch as the Hispanic population of the United States is projected to grow faster than and surpass the black population by the year 2010 (U.S. Bureau of the Census 1996), it will be important to assess whether this growing minority will come to pose the perceived crime threat elsewhere that it clearly does in Florida. It will also be of interest to learn whether the iconography of criminal threat, as reflected in media and popular rhetoric, comes to include the putative "menace" of Hispanics-as it has blacks. Whether it does or not, the current data suggest there is reason to believe that perceived criminal "threat" will likely vary by the race or ethnicity of who is being threatened and by the geo-social context of where people live. As noted, where people live-South Florida or not-makes a substantial difference in how racial and ethnic differences are linked to perceived criminal threat. For both Hispanics and whites, the perception that blacks or Hispanics live nearby significantly elevates RISK. However, these relationships hold for Hispanics only outside of South Florida and they hold for whites only inside South Florida. Why do whites perceive greater crime threat in relation to racial and ethnic others only in South Florida and Hispanics only outside of South Florida?
  • 42. by guest on N ovem ber 27, 2016 http://socpro.oxfordjournals.org/ D ow nloaded from http://socpro.oxfordjournals.org/ 336 CHIRICOS/McENTIRE/GERTZ The experience of whites in South Florida may be a textbook example of conditions that generate what Blalock (1967) called "power threat" and Liska (1992) broadened to call "social threat"-which implies the threat of crime. A former majority (80% in 1960), whites now comprise 49% of those living in the four counties we have designated as South Florida. Though still the single largest group, whites have ceded considerable economic and political power and continue to see the "minority" presence of blacks and Hispanics grow in relation to their own numbers. It is certainly consistent with a social threat interpretation, that whites in South Florida would feel "threatened" by the growing presence of blacks and Hispanics. That whites outside of South Florida-where they are a substantial majority-are not similarly
  • 43. threatened is also consistent with a social threat interpretation. The absence of RISK effects among Hispanics living in South Florida and the responsive- ness of perceived victim risk to perceived racial and ethnic diversity for Hispanics living outside of South Florida may be subject to alternative explanations. One possibility is that the percep- tion of victimization risk is so high among Hispanics living in South Florida, that something of a "ceiling effect"'7 exists which mitigates the influence of other factors like perceived racial or ethnic composition of neighborhood. At first glance, the data appear consistent with such an interpretation. Hispanics living in South Florida have mean RISK levels (31.3) fifty percent higher than whites (20.1). However, outside of South Florida, Hispanic RISK (26.3) levels are forty-two percent higher than those of whites. The similarity of these RISK levels reduces the plausibility of a "ceiling effect" interpretation of the pattern of RISK results for Hispanics. A second explanation for why Hispanics perceive no criminal threat in relation to blacks and Hispanics in South Florida-but are apparently threatened elsewhere-may involve a variant of the social threat hypothesis. Within South Florida, Hispanics are 32% of the popula- tion and are predominantly either Cuban (56%) or Central/South American (32%) in ethnic origin. They are also clearly an ascendant group both economically and politically. Hispanics outside of South Florida, comprise only 6% of the population and are much more ethnically diverse, with Puerto Rican (36%), Cuban (21%), Central/South
  • 44. American (21%) and Mexican (14%) ethnicities substantially represented (Nogle 1999). It is consistent with a modified social threat perspective to note that outside of South Florida, where Hispanics are a small minority and blacks are twice as prevalent (12%), the perception of blacks living nearby could be threatening to Hispanics in ways that it is not in South Florida. At the same time, the greater ethnic diversity of Hispanics living outside of South Florida may account for the increase in RISK associated with the perception (among Hispanics) that other Hispanics are living nearby. Within South Florida, Hispanics are both more numerous and ethnically homogeneous and the presence of blacks or other Hispanics may not be as threatening. While generally consistent with a social threat interpretation of RISK, the present findings may also afford "micro level" evidence of the kind that Blalock (1967:29) regarded as poten- tially suggestive of modifications to broader macro-theory. On the basis of these results it may be reasonable to suggest that several aspects of social threat relationships could be theorized more broadly than was possible to this point. In terms of who is perceived as threatening, we might expect future tests of social threat to incorporate Hispanics and possibly other ethnic groups as potentially threatening and subject to social control. Blalock (1967), when first rais- ing these issues in terms not related to criminal threat, spoke generally in terms of "minorities" with blacks as a particularly visible minority that could be
  • 45. subject to "discrimination." Subse- quent extensions of these ideas to include criminal threat narrowed the focus to blacks. The present data suggest that a broader focus in relation to criminal threat may well be warranted. In terms of who is being threatened, the dynamic of social threat might be reconceptual- ized to include threats perceived by minority populations, in addition to those traditionally pre- 17. This concept was first raised in relation to "fear" by Heath and Petraitis (1987) as a possible explanation for why television viewing had little apparent influence on fear for women. by guest on N ovem ber 27, 2016 http://socpro.oxfordjournals.org/ D ow nloaded from http://socpro.oxfordjournals.org/ Perceived Composition of Neighborhood and Risk of Crime 337 sumed to affect majorities. Earlier, Covington and Taylor (1991) argued that minority status
  • 46. per se is likely a critical element in the experience of criminal threat and Chiricos, et al. (1997) found that whites were threatened only when they believed themselves to be a minority. We find that whites (in South Florida) and Hispanics (outside of South Florida) are only threat- ened in contexts where their numbers are relatively small. While social threat traditionally focused on dominant majorities as potentially threatened by racial diversity, majority status itself may, in particular contexts, provide a kind of social insulation from criminal threat posed by either racial or ethnic others. The responses to threat experienced by minorities may well take paths different from the mobilization of repressive state controls typically linked to threatened majorities. What paths they may take and the con- sequences they may have are matters for subsequent theoretical and empirical inquiry. But it is reasonably presumed they will at least include the kinds of exclusions and social dis tanc- ing that were heretofore associated with majority response to perceived threats from minorities. In short, these data not only broaden our understanding of the possible sources of threat, but they extend the potential context of threat to an entirely different condition than previ- ously theorized in relation to social threat-the condition of minority as opposed to majority status. By doing so these findings underscore the relevance of Blalock's own observation "that a careful micro-level analysis of psychological factors" implicit in the macro theory, may sug- gest and warrant "modifications in the theory" (1967:29). We
  • 47. would argue that these data offer several possibilities for how such modifications might proceed. References American Association for Public Opinion Research 1998 Standard Definitions: Final Dispositions of Case Codes and Outcome Rates for RDD Telephone Surveys and In-Person Household Surveys. Ann Arbor, MI: AAPOR. Anderson, David C. 1995 Crime and the Politics of Hysteria. New York: Random House, Inc. Bankston, William B., and Carol Y. Thompson 1989 "Carrying firearms for protection: A causal model." Sociological Inquiry 59:75-87. Barak, Gregg 1994 "Between the waves: Mass-mediated themes of crime and justice." Social Justice 21:133-147. Blalock, Hubert M. 1967 Toward a Theory ofMinority Group Relations. New York: John Wiley and Sons. Bridges, George S. 1987 "Crime, social structure and criminal punishment: White and non-white rates of imprisonment." Social Problems 34:345-361. Bridges, George S., Robert D. Crutchfield, and Edith E. Simpson 1987 "Crime, social structure and criminal punishment: White
  • 48. and nonwhite rates of imprisonment." Social Problems 34:345-359. Chamlin, Mitchell B. 1989 "A macro social analysis of change in police force size, 1972-1982: Controlling for static and dynamic influences." The Sociological Quarterly 30:615- 624. Chamlin, Mitchell B., and Allen E. Liska 1992 "Social structure and crime control revisited: The declining significance of intergroup threat." In Social Threat and Social Control, Allen E. Liska, ed. Albany, NY: SUNY Press. Chiricos, Ted 1996 "Moral panic as ideology: Race, drugs, violence and punishment in America." In Race with Prejudice: Race and Justice in America, Michael J. Lynch and E. Britt Patterson, eds. New York: Harrow and Heston. Chiricos, Ted, Michael Hogan, and Marc Gertz 1997 "Racial composition of neighborhood and fear of crime." Criminology 35:107-129. by guest on N ovem ber 27, 2016 http://socpro.oxfordjournals.org/ D ow
  • 49. nloaded from http://socpro.oxfordjournals.org/ 338 CHIRICOS/McENTIRE/GERTZ Clemente, Frank, and Michael Kleiman 1976 "Fear of crime among the aged." Gerontologist 16:207- 210. Cohen, Richard 1993 "Common ground on crime." Washington Post, December 21:A2. Covington, Jeanette, and Ralph B. Taylor 1991 "Fear of crime in urban residential neighborhoods: Implications of between- and within- neighborhood sources for current models." The Sociological Quarterly 32:231-249. DeLone, Miriam 1992 Marginal labor and county level punishment patterns. Ph.D. Dissertation, School of Criminology, Florida State University, Tallahassee, FL. Entman, Robert M. 1990 "Modern racism and the images of blacks in local television news." Critical Studies in Mass Communications 7:332-345. Entman, Robert M.
  • 50. 1992 "Blacks in the news: Television, modern racism, and cultural change." Journalism Quarterly 69:341-361. Ferraro, Kenneth A. 1995 Fear of Crime: Interpreting Victimization Risk. Albany, NY: SUNY Press. Ferraro, Kenneth E, and Randy LaGrange 1987 "The measurement of fear of crime." Sociological Inquiry 57:70-101. 1992 "Are older people most afraid of crime? Reconsidering age differences in fear of victimization." Journal of Gerontology Social Sciences 47:S233-244. Giddens, Anthony 1976 The New Rules of Sociological Method: A Positive Critique of Interpretive Sociologies. New York: Basic Books. Gilens, Martin 1996 "'Race coding' and white opposition to welfare." American Political Science Review 90: 593-604. Greenberg, David E, Ronald C. Kessler, and Colin Loftin 1985 "Social inequality and crime control." The Journal of Criminal Law and Criminology 76:684- 704. Harer, Miles D., and Darrel Steffensmeier 1992 "The differing effects of economic inequality on black and white rates of violence." Social
  • 51. Forces 70:1035-1054. Hawkins, Darnell E 1995 "Ethnicity, race and crime: A review of selected studies." In Ethnicity Race and Crime: Perspectives Across Time and Place, Darnell Hawkins, ed. Albany, NY: SUNY Press. Heath, Linda, and John Petraitis 1987 "Television viewing and fear of crime: Where is the mean world?" Basic and Applied Social Psychology 8:97-123. Jackson, Pamela Irving 1989 Minority Group Threat, Crime and Policing. New York: Praeger Publishers. Jackson, Pamela Irving, and Leo Carroll 1981 Race and war on crime: The sociopolitical determinants of municipal police expenditures in 90 non-southern U.S. cities. American Sociological Review 46:290-305. Jaycox, Victoria 1978 "The elderly's fear of crime: Rational or irrational." Victimology 3:329-334. Karmen, Andrew A. 1991 "Victims of crime." In Criminology: A Contemporary Handbook, Joseph F. Sheley, ed., 121-138. Belmont, CA: Wadsworth. Kennedy, Randall
  • 52. 1997 Race, Crime and the Law. New York: Vintage Books. LaGrange, Randy L., Kenneth F. Ferraro, and Michael Supanic 1992 "Perceived risk and fear of crime: Role of social and physical incivilities." Journal of Research in Crime and Delinquency 29:311-334. Liska, Allen E. 1992 Social Threat and Social Control. Albany, NY: SUNY Press. by guest on N ovem ber 27, 2016 http://socpro.oxfordjournals.org/ D ow nloaded from http://socpro.oxfordjournals.org/ Perceived Composition of Neighborhood and Risk of Crime 339 Liska, Allen E., and Mitchell B. Chamlin 1984 Social structure and crime control among macrosocial units. American Journal of Sociology 90:383-395. Liska, Allen E., Mitchell B. Chamlin, and Mark D. Reed 1985 "Testing the economic production and conflict models of
  • 53. crime control." Social Forces 64:119-138. Liska, Allen E., Joseph J. Lawrence, and Michael Benson 1981 "Perspectives on the legal order: The capacity for social control." American Journal of Sociology 87:413-426. Liska, Allen E., Joseph J. Lawrence, and Andrew Sanchirico 1982 "Fear of crime as a social fact." Social Forces 60:761-770. Moeller, Gertrude L. 1989 "Fear of criminal victimization: The effect of neighborhood racial composition." Sociological Inquiry 59:208-221. Myers, Martha A., and Susette M. Talarico 1986 "The social context of racial discrimination in sentencing." Social Problems 33:236-251. 1987 The Social Contexts of Criminal Sentencing. New York: Springer-Verlag. Nedau, Richard, Richard G. Niemi, and Jeffrey Levine 1993 "Innumeracy about minority populations." Public Opinion Quarterly 57:332-347. Nogle, June Marie 1999 Personal communication on 10 March from research demographer at the Bureau of Economic and Business Research, University of Florida. Ortega, Suzanne L., and Jessie L. Myles 1987 "Race and gender effects on the fear of crime: An interactive model with age." Criminology
  • 54. 25:133-152. Parker, Kenneth D., and Melvin C. Ray 1990 "Fear of crime: An assessment of related factors." Sociological Spectrum 10:29-40. Rountree, Pamela W., and Kenneth C. Land 1996 "Perceived risk versus fear of crime." Social Forces 74:1353-1376. Russell, Katheryn K. 1998 The Color of Crime. NY: New York University Press. Skogan, Wesley G. 1995 "Crime and the racial fears of white Americans." The Annals of the American Academy of Political and Social Science 539:59-71. Szkowny, Rick 1994 "No justice, no peace: An interview with Jerome Miller." The Humanist January/ February:9-19. Tate, Richard 1998 An Introduction to Modeling Outcomes in the Behavioral and Social Sciences. Edina, MN: Burgess Publishing. Taylor, Ralph B., and Jeanette Covington 1993 "Community structural change and fear of crime." Social Problems 40:374-395. Thompson, Carol Y., William B. Bankston, and Roberta L. St. Pierre
  • 55. 1992 "Parity and disparity among three measures of crime: A research note." Deviant Behavior: An Interdisciplinary Journal 13:373-389. Lonry, Michael 1995 Malign Neglect. NY: Oxford University Press. U.S. Bureau of the Census 1996 Population Projections of the United States by Age, Sex, Race, and Hispanic Origin: 1995 to 2050. Current Population Reports, Series P25-1130. Ward, Russel A., Mark LaGory, and Susan R. Sherman 1986 "Fear of crime among the elderly as person/environment interaction." The Sociological Quarterly 27:327-341. Warner, Barbara D. 1992 "The reporting of crime: A missing link in conflict theory." In Social Threat and Social Control, Allen Liska, ed. Albany, NY: SUNY Press. by guest on N ovem ber 27, 2016 http://socpro.oxfordjournals.org/ D ow nloaded from
  • 56. http://socpro.oxfordjournals.org/ 340 CHIRICOS/McENTIRE/GERTZ Warren, Christopher L., John G. Corbett, and John F. Stack, Jr. 1990 "Hispanic ascendancy and tripartite politics in Miami." In Racial Politics in American Cities, Rufus P. Browning, Dale Rogers Marshall, and David H. Tabb, eds. White Plains, NY: Longman. West, Comel 1994 Race Matters. New York: Vintage Books. White, H. 1980 "A heteroskedasticity consistent covariance matrix and a direct test for heteroskedasticity." Econometrica 48:817-838. Wilson, James Q. 1992 "To prevent riots, reduce black crime." The Wall Street Journal 6, May:A16. by guest on N ovem ber 27, 2016 http://socpro.oxfordjournals.org/ D ow nloaded from
  • 57. http://socpro.oxfordjournals.org/Article Contentsp. [322]p. 323p. 324p. 325p. 326p. 327p. 328p. 329p. 330p. 331p. 332p. 333p. 334p. 335p. 336p. 337p. 338p. 339p. 340Issue Table of ContentsSocial Problems, Vol. 48, No. 3 (Aug., 2001) pp. 299- 428Front MatterUrban Neighborhoods: Race, Ethnicity, Poverty, and PoliticsNeighborhood Transition and Social Organization: The White to Hispanic Case [pp. 299- 321]Perceived Racial and Ethnic Composition of Neighborhood and Perceived Risk of Crime [pp. 322-340]Ghettos and Barrios: The Impact of Neighborhood Poverty and Race on Job Matching among Blacks and Latinos [pp. 341-361]Political Participation of the Urban Poor [pp. 362-385]Gay/Lesbian Rights Struggles: The State and Counter-MovementsWho's "In" and Who's "Out": State Fragmentation and the Struggle over Gay Rights, 1974- 1999 [pp. 386-410]Working Anita Bryant: The Impact of Christian Anti-Gay Activism on Lesbian and Gay Movement Claims [pp. 411-428]Back Matter