Corruption Perceptions Index 2010
•
1 like•1,482 views

The document is a summary of the 2010 Corruption Perceptions Index published by Transparency International. It finds that nearly three quarters of 178 countries score below five on a scale of ten (very clean) to zero (highly corrupt), indicating a serious global corruption problem. Denmark, New Zealand and Singapore rank as the top three least corrupt countries, while Somalia, Myanmar and Afghanistan rank as the most corrupt. The summary calls for greater transparency and accountability worldwide to address corruption and restore trust, especially in efforts to solve global problems.

Recommended
Recommended
More Related Content
What's hot
What's hot (20)
Similar to Corruption Perceptions Index 2010
Similar to Corruption Perceptions Index 2010 (20)
More from Andy Dabydeen
More from Andy Dabydeen (20)
Recently uploaded
Recently uploaded (20)
Corruption Perceptions Index 2010
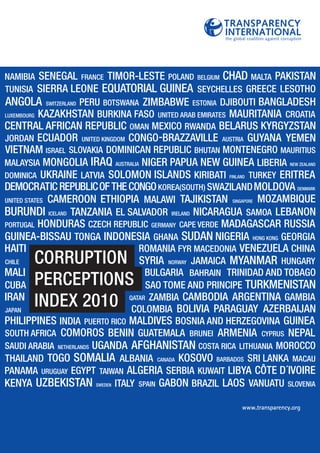
- 1. CORRUPTION PERCEPTIONS INDEX 2010 www.transparency.org TRANSPARENCY INTERNATIONALthe global coalition against corruption
- 2. www.transparency.org Every effort has been made to verify the accuracy of the information contained in this report. All information was believed to be correct as of October 2010. Nevertheless, Transparency International cannot accept responsibility for the consequences of its use for other purposes or in other contexts. ISBN: 978-3-935711-60-9 ©2010 Transparency International. All rights reserved. Design: Sophie Everett Printed on 100% recycled paper. CONTENTS 2010 RESULTS 2 WHAT IS THE CORRUPTION PERCEPTIONS INDEX? 4 2010 FACTS 5 VISUALISING THE CORRUPTION PERCEPTIONS INDEX 6 RESULTS BY REGION AMERICAS 8 ASIA PACIFIC 9 EASTERN EUROPE AND CENTRAL ASIA 10 EUROPEAN UNION AND WESTERN EUROPE 11 MIDDLE EAST AND NORTH AFRICA 12 SUB-SAHARAN AFRICA 13 ANNEX A: SHORT METHODOLOGICAL NOTE 15 ANNEX B: SOURCES OF INFORMATION 16 Transparency International (TI) is the global civil society organisation leading the fight against corruption. Through more than 90 chapters worldwide and an international secretariat in Berlin,TI raises awareness of the damaging effects of corruption and works with partners in government, business and civil society to develop and implement effective measures to tackle it.
- 3. 9.0 - 10.0 8.0 - 8.9 7.0 - 7.9 6.0 - 6.9 5.0 - 5.9 4.0 - 4.9 3.0 - 3.9 2.0 -2.9 1.0 - 1.9 0.0 - 0.9 No data Highly Corrupt Very Clean 2010 CPI Score TRANSPARENCY AND ACCOUNTABILITY ARE CRITICAL TO RESTORING TRUST AND TURNING BACK THE TIDE OF CORRUPTION 9.0 - 10.0 8.0 - 8.9 7.0 - 7.9 6.0 - 6.9 5.0 - 5.9 4.0 - 4.9 3.0 - 3.9 2.0 -2.9 1.0 - 1.9 0.0 - 0.9 No data Highly Corrupt Very Clean 2010 CPI Score 1 Denmark 9.3 1 New Zealand 9.3 1 Singapore 9.3 4 Finland 9.2 4 Sweden 9.2 6 Canada 8.9 7 Netherlands 8.8 8 Australia 8.7 8 Switzerland 8.7 10 Norway 8.6 11 Iceland 8.5 11 Luxembourg 8.5 13 Hong Kong 8.4 14 Ireland 8.0 15 Austria 7.9 15 Germany 7.9 17 Barbados 7.8 17 Japan 7.8 19 Qatar 7.7 20 United Kingdom 7.6 21 Chile 7.2 22 Belgium 7.1 22 United States 7.1 24 Uruguay 6.9 25 France 6.8 26 Estonia 6.5 27 Slovenia 6.4 28 Cyprus 6.3 28 United Arab Emirates 6.3 30 Israel 6.1 30 Spain 6.1 32 Portugal 6.0 33 Botswana 5.8 33 Puerto Rico 5.8 33 Taiwan 5.8 36 Bhutan 5.7 37 Malta 5.6 38 Brunei 5.5 39 Korea (South) 5.4 39 Mauritius 5.4 41 Costa Rica 5.3 41 Oman 5.3 41 Poland 5.3 44 Dominica 5.2 45 Cape Verde 5.1 46 Lithuania 5.0 46 Macau 5.0 48 Bahrain 4.9 49 Seychelles 4.8 50 Hungary 4.7 50 Jordan 4.7 50 Saudi Arabia 4.7 53 Czech Republic 4.6 54 Kuwait 4.5 54 South Africa 4.5 56 Malaysia 4.4 56 Namibia 4.4 56 Turkey 4.4 59 Latvia 4.3 59 Slovakia 4.3 91 Bosnia and Herzegovina 3.2 91 Djibouti 3.2 91 Gambia 3.2 91 Guatemala 3.2 91 Kiribati 3.2 91 Sri Lanka 3.2 91 Swaziland 3.2 98 Burkina Faso 3.1 98 Egypt 3.1 98 Mexico 3.1 101 Dominican Republic 3.0 101 Sao Tome & Principe 3.0 101 Tonga 3.0 101 Zambia 3.0 105 Algeria 2.9 105 Argentina 2.9 105 Kazakhstan 2.9 105 Moldova 2.9 105 Senegal 2.9 110 Benin 2.8 110 Bolivia 2.8 110 Gabon 2.8 110 Indonesia 2.8 110 Kosovo 2.8 110 Solomon Islands 2.8 116 Ethiopia 2.7 116 Guyana 2.7 116 Mali 2.7 116 Mongolia 2.7 116 Mozambique 2.7 116 Tanzania 2.7 116 Vietnam 2.7 123 Armenia 2.6 123 Eritrea 2.6 123 Madagascar 2.6 123 Niger 2.6 127 Belarus 2.5 127 Ecuador 2.5 127 Lebanon 2.5 127 Nicaragua 2.5 127 Syria 2.5 127 Timor-Leste 2.5 127 Uganda 2.5 134 Azerbaijan 2.4 134 Bangladesh 2.4 134 Honduras 2.4 134 Nigeria 2.4 134 Philippines 2.4 134 Sierra Leone 2.4 134 Togo 2.4 134 Ukraine 2.4 134 Zimbabwe 2.4 143 Maldives 2.3 143 Mauritania 2.3 143 Pakistan 2.3 146 Cameroon 2.2 146 Côte d'Ivoire 2.2 146 Haiti 2.2 146 Iran 2.2 146 Libya 2.2 146 Nepal 2.2 146 Paraguay 2.2 146 Yemen 2.2 154 Cambodia 2.1 154 Central African Republic 2.1 154 Comoros 2.1 154 Congo-Brazzaville 2.1 154 Guinea-Bissau 2.1 154 Kenya 2.1 154 Laos 2.1 154 Papua New Guinea 2.1 154 Russia 2.1 154 Tajikistan 2.1 164 Democratic Republic of the Congo 2.0 164 Guinea 2.0 164 Kyrgyzstan 2.0 164 Venezuela 2.0 168 Angola 1.9 168 Equatorial Guinea 1.9 170 Burundi 1.8 171 Chad 1.7 172 Sudan 1.6 172 Turkmenistan 1.6 172 Uzbekistan 1.6 175 Iraq 1.5 176 Afghanistan 1.4 176 Myanmar 1.4 178 Somalia 1.1 RANK COUNTRY/ TERRITORY SCORE RANK COUNTRY/ TERRITORY 59 Tunisia 4.3 62 Croatia 4.1 62 FYR Macedonia 4.1 62 Ghana 4.1 62 Samoa 4.1 66 Rwanda 4.0 67 Italy 3.9 68 Georgia 3.8 69 Brazil 3.7 69 Cuba 3.7 69 Montenegro 3.7 69 Romania 3.7 73 Bulgaria 3.6 73 El Salvador 3.6 73 Panama 3.6 73 Trinidad and Tobago 3.6 73 Vanuatu 3.6 78 China 3.5 78 Colombia 3.5 78 Greece 3.5 78 Lesotho 3.5 78 Peru 3.5 78 Serbia 3.5 78 Thailand 3.5 85 Malawi 3.4 85 Morocco 3.4 87 Albania 3.3 87 India 3.3 87 Jamaica 3.3 87 Liberia 3.3 RANK COUNTRY/ TERRITORY SCORE SCORE With governments committing huge sums to tackle the world’s most pressing problems, from the instability of financial markets to climate change and poverty, corruption remains an obstacle to achieving much needed progress. The 2010 Corruption Perceptions Index shows that nearly three quarters of the 178 countries in the index score below five, on a scale from 10 (very clean) to 0 (highly corrupt). These results indicate a serious corruption problem. To address these challenges, governments need to integrate anti-corruption measures in all spheres, from their responses to the financial crisis and climate change to commitments by the international community to eradicate poverty. Transparency International advocates stricter implementation of the UN Convention against Corruption, the only global initiative that provides a framework for putting an end to corruption. Denmark, New Zealand and Singapore are tied at the top of the list with a score of 9.3, followed closely by Finland and Sweden at 9.2. At the bottom is Somalia with a score of 1.1, slightly trailing Myanmar and Afghanistan at 1.4 and Iraq at 1.5. Notable among decliners over the past year are some of the countries most affected by a financial crisis precipitated by transparency and integrity deficits. Among those improving in the past year, the general absence of OECD states underlines the fact that all nations need to bolster their good governance mechanisms. The message is clear: across the globe, transparency and accountability are critical to restoring trust and turning back the tide of corruption. Without them, global policy solutions to many global crises are at risk. 2 3Transparency International Corruption Perceptions Index 2010
- 4. 4 5Transparency International Corruption Perceptions Index 2010 2010 FACTS The 2010 CPI measures the degree to which public sector corruption is perceived to exist in 178 countries around the world. It scores countries on a scale from 10 (very clean) to 0 (highly corrupt). The 2010 results are drawn from 13 surveys and assessments published between January 2009 and September 2010. The 2010 CPI covers two countries fewer than last year’s edition. The slight change resulted from individual sources adjusting the range of countries they assess. These adjustments in coverage made it possible to include Kosovo for the first time, but led to the exclusion of Saint Lucia, Saint Vincent and the Grenadines, and Suriname, for which only two sources of information were available this year. Given its methodology, the CPI is not a tool that is suitable for trend analysis or for monitoring changes in the perceived levels of corruption over time for all countries. Year-to-year changes in a country/territory’s score can result from a change in the perceptions of a country’s performance, a change in the ranking provided by original sources or changes in the methodology resulting from TI’s efforts to improve the index. If a country is featured in one or more specific data sources for both of the last two CPIs (2009 CPI and 2010 CPI), those sources can be used to identify whether there has been a change in perceived levels of corruption in that particular country compared to the previous year. TI has used this approach in 2010 to assess country progress over the past year and to identify what can be considered to be a change in perceptions of corruption. These assessments use two criteria: (a) there is a year-on-year change of at least 0.3 points in a country’s CPI score, and (b) the direction of this change is confirmed by more than half of the data sources evaluating that country. Based on these criteria, the following countries showed an improvement from 2009 to 2010: Bhutan, Chile, Ecuador, FYR Macedonia, Gambia, Haiti, Jamaica, Kuwait and Qatar. The following countries showed deterioration from 2009 to 2010: the Czech Republic, Greece, Hungary, Italy, Madagascar, Niger and the United States. WHAT IS THE CORRUPTION PERCEPTIONS INDEX? Transparency International (TI) defines corruption as the abuse of entrusted power for private gain. This definition encompasses corrupt practices in both the public and private sectors. The Corruption Perceptions Index (CPI) ranks countries according to perception of corruption in the public sector. The CPI is an aggregate indicator that combines different sources of information about corruption, making it possible to compare countries. The 2010 CPI draws on different assessments and business opinion surveys carried out by independent and reputable institutions1 . It captures information about the administrative and political aspects of corruption. Broadly speaking, the surveys and assessments used to compile the index include questions relating to bribery of public officials, kickbacks in public procurement, embezzlement of public funds, and questions that probe the strength and effectiveness of public sector anti-corruption efforts. For a country or territory to be included in the index a minimum of three of the sources that TI uses must assess that country. Thus inclusion in the index depends solely on the availability of information. Perceptions are used because corruption – whether frequency or amount – is to a great extent a hidden activity that is difficult to measure. Over time, perceptions have proved to be a reliable estimate of corruption. Measuring scandals, investigations or prosecutions, while offering ‘non-perception’ data, reflect less on the prevalence of corruption in a country and more on other factors, such as freedom of the press or the efficiency of the judicial system. TI considers it of critical importance to measure both corruption and integrity, and to do so in the public and private sectors at global, national and local levels.2 The CPI is therefore one of many TI measurement tools that serve the fight against corruption. 1 For detailed information on the sources of information please see Annex B and visit our website at www. transparency.org/cpi 2 Examples include National Integrity System assessments, which evaluate the degree of integrity, transparency and accountability in a country’s anti-corruption institutions, and the Bribe Payers Index, which evaluates expert views of the supply of foreign bribery.
- 5. Countries appear in order of rank. Please see country listing on p. 2 for exact country scoring and ranking. DENMARK NEW ZEALAND SINGAPORE FINLAND SWEDEN CANADA NETHERLANDS AUSTRALIA SWITZERLAND NORWAY ICELAND LUXEMBOURG HONG KONG IRELAND AUSTRIA GERMANY BARBADOS JAPAN QATAR UNITED KINGDOM CHILE BELGIUM UNITED STATES URUGUAY FRANCE ESTONIA SLOVENIA CYPRUS UNITED ARAB EMIRATES ISRAEL SPAIN PORTUGAL BOTSWANA PUERTO RICO TAIWAN BHUTAN MALTA BRUNEI KOREA(SOUTH) MAURITIUS COSTA RICA OMAN POLAND DOMINICA CAPE VERDE LITHUANIA MACAU BAHRAIN SEYCHELLES HUNGARY JORDAN SAUDI ARABIA CZECH REPUBLIC KUWAIT SOUTH AFRICA MALAYSIA NAMIBIA TURKEY LATVIA SLOVAKIA TUNISIA CROATIA FYR MACEDONIA GHANA SAMOA RWANDA ITALY GEORGIA BRAZIL CUBA MONTENEGRO ROMANIA BULGARIA EL SALVADOR PANAMA TRINIDAD AND TOBAGO VANUATU CHINA COLOMBIA GREECE LESOTHO PERU SERBIA THAILAND MALAWI MOROCCO ALBANIA INDIA JAMAICA LIBERIA BOSNIA AND HERZEGOVINA DJIBOUTI GAMBIA GUATEMALA KIRIBATI SRI LANKA SWAZILAND BURKINA FASO EGYPT MEXICO DOMINICAN REPUBLIC SAO TOME AND PRINCIPE TONGA ZAMBIA ALGERIA ARGENTINA KAZAKHSTAN MOLDOVA SENEGAL BENIN BOLIVIA GABON INDONESIA KOSOVO SOLOMON ISLANDS ETHIOPIA GUYANA MALI MONGOLIA MOZAMBIQUE TANZANIA VIETNAM ARMENIA ERITREA MADAGASCAR NIGER BELARUS ECUADOR LEBANON NICARAGUA SYRIA TIMOR-LESTE UGANDA AZERBAIJAN BANGLADESH HONDURAS NIGERIA PHILIPPINES SIERRA LEONE TOGO UKRAINE ZIMBABWE MALDIVES MAURITANIA PAKISTAN CAMEROON CÔTE D´IVOIRE HAITI IRAN LIBYA NEPAL PARAGUAY YEMEN CAMBODIA CENTRAL AFRICAN REPUBLIC COMOROS CONGO-BRAZZAVILLE GUINEA-BISSAU KENYA LAOS PAPUA NEW GUINEA RUSSIA TAJIKISTAN DEMOCRATIC REPUBLIC OF THE CONGO GUINEA KYRGYZSTAN VENEZUELA ANGOLA EQUATORIAL GUINEA BURUNDI CHAD SUDAN TURKMENISTAN UZBEKISTAN IRAQ AFGHANISTAN MYANMAR SOMALIA 6 7 VISUALISING THE CORRUPTION PERCEPTIONS INDEX Transparency International Corruption Perceptions Index 2010 9.0 - 10.0 8.0 - 8.9 7.0 - 7.9 6.0 - 6.9 5.0 - 5.9 4.0 - 4.9 3.0 - 3.9 2.0 -2.9 1.0 - 1.9 0.0 - 0.9 Highly Corrupt Very Clean 2010 CPI Score
- 6. RANK REGIONAL RANK COUNTRY / TERRITORY CPI 2010 SCORE 90% CONFIDENCE INTERVAL* SURVEYS USED LOWER BOUND UPPER BOUND 6 1 Canada 8.9 8.7 9.0 6 17 2 Barbados 7.8 7.1 8.5 4 21 3 Chile 7.2 7.0 7.4 7 22 4 United States 7.1 6.5 7.7 8 24 5 Uruguay 6.9 6.5 7.1 5 33 6 Puerto Rico 5.8 5.3 6.4 4 41 7 Costa Rica 5.3 4.7 6.0 5 44 8 Dominica 5.2 4.7 5.8 3 69 9 Brazil 3.7 3.2 4.3 7 69 9 Cuba 3.7 2.6 5.1 3 73 11 El Salvador 3.6 3.4 3.8 5 73 11 Panama 3.6 3.2 4.1 5 73 11 Trinidad and Tobago 3.6 3.0 4.3 4 78 14 Colombia 3.5 3.2 4.0 7 78 14 Peru 3.5 3.4 3.6 7 87 16 Jamaica 3.3 3.0 3.4 5 91 17 Guatemala 3.2 3.0 3.4 5 98 18 Mexico 3.1 2.9 3.3 7 101 19 Dominican Republic 3.0 2.7 3.2 5 105 20 Argentina 2.9 2.6 3.2 7 110 21 Bolivia 2.8 2.5 3.1 6 116 22 Guyana 2.7 2.6 2.8 4 127 23 Ecuador 2.5 2.2 2.7 5 127 23 Nicaragua 2.5 2.2 2.7 6 134 25 Honduras 2.4 2.2 2.7 6 146 26 Haiti 2.2 2.1 2.3 3 146 26 Paraguay 2.2 1.9 2.5 5 164 28 Venezuela 2.0 1.8 2.1 7 RANK REGIONAL RANK COUNTRY / TERRITORY CPI 2010 SCORE 90% CONFIDENCE INTERVAL SURVEYS USED LOWER BOUND UPPER BOUND 1 1 New Zealand 9.3 9.2 9.5 6 1 1 Singapore 9.3 9.2 9.4 9 8 3 Australia 8.7 8.3 9.0 8 13 4 Hong Kong 8.4 8.1 8.7 8 17 5 Japan 7.8 7.5 8.2 8 33 6 Taiwan 5.8 5.5 6.2 9 36 7 Bhutan 5.7 5.1 6.2 4 38 8 Brunei 5.5 4.7 6.1 3 39 9 Korea (South) 5.4 5.1 5.7 9 46 10 Macau 5.0 3.4 5.8 3 56 11 Malaysia 4.4 3.9 4.9 9 62 12 Samoa 4.1 3.4 4.7 3 73 13 Vanuatu 3.6 2.3 5.8 3 78 14 China 3.5 3.0 4.0 9 78 14 Thailand 3.5 3.2 3.9 9 87 16 India 3.3 3.0 3.5 10 91 17 Kiribati 3.2 2.3 4.7 3 91 17 Sri Lanka 3.2 2.9 3.6 7 101 19 Tonga 3.0 2.6 3.3 3 110 20 Indonesia 2.8 2.3 3.2 9 110 20 Solomon Islands 2.8 2.3 3.4 3 116 22 Mongolia 2.7 2.4 3.0 6 116 22 Vietnam 2.7 2.4 3.1 9 127 24 Timor-Leste 2.5 2.1 2.8 5 134 25 Bangladesh 2.4 1.9 3.0 7 134 25 Philippines 2.4 2.1 2.7 9 143 27 Maldives 2.3 1.7 2.7 3 143 27 Pakistan 2.3 2.1 2.6 7 146 29 Nepal 2.2 1.9 2.5 6 154 30 Cambodia 2.1 1.9 2.2 9 154 30 Laos 2.1 1.6 2.6 4 154 30 Papua New Guinea 2.1 1.8 2.5 5 176 33 Afghanistan 1.4 1.2 1.6 4 176 33 Myanmar 1.4 0.9 1.9 3 RESULTS BY REGION: AMERICAS ASIA PACIFIC 8 9 *The confidence intervals reflect the precision of the CPI scores. They indicate the range within which the most accurate value of the CPI score is most likely to fall. The wider a confidence interval is, the less precise the score. Transparency International Corruption Perceptions Index 2010
- 7. RANK REGIONAL RANK COUNTRY / TERRITORY CPI 2010 SCORE 90% CONFIDENCE INTERVAL SURVEYS USED LOWER BOUND UPPER BOUND 56 1 Turkey 4.4 4.0 4.8 7 62 2 Croatia 4.1 3.7 4.5 8 62 2 FYR Macedonia 4.1 3.7 4.5 5 68 4 Georgia 3.8 3.0 4.7 7 69 5 Montenegro 3.7 3.1 4.3 5 78 6 Serbia 3.5 3.1 3.9 6 87 7 Albania 3.3 3.0 3.6 6 91 8 Bosnia and Herzegovina 3.2 2.8 3.5 7 105 9 Kazakhstan 2.9 2.2 3.7 8 105 9 Moldova 2.9 2.7 3.2 6 110 11 Kosovo 2.8 2.7 3.1 3 123 12 Armenia 2.6 2.5 2.8 7 127 13 Belarus 2.5 2.1 3.1 3 134 14 Azerbaijan 2.4 2.1 2.7 7 134 14 Ukraine 2.4 2.1 2.6 8 154 16 Russia 2.1 1.9 2.3 8 154 16 Tajikistan 2.1 1.7 2.5 7 164 18 Kyrgyzstan 2.0 1.8 2.3 7 172 19 Turkmenistan 1.6 1.4 1.8 3 172 19 Uzbekistan 1.6 1.5 1.7 6 RANK REGIONAL RANK COUNTRY / TERRITORY CPI 2010 SCORE 90% CONFIDENCE INTERVAL SURVEYS USED LOWER BOUND UPPER BOUND 1 1 Denmark 9.3 9.1 9.4 6 4 2 Finland 9.2 9.1 9.3 6 4 2 Sweden 9.2 9.1 9.4 6 7 4 Netherlands 8.8 8.7 9.0 6 8 5 Switzerland 8.7 8.3 9.1 6 10 6 Norway 8.6 8.1 9.0 6 11 7 Iceland 8.5 7.7 9.2 5 11 7 Luxembourg 8.5 8.0 8.9 5 14 9 Ireland 8.0 7.7 8.3 6 15 10 Austria 7.9 7.4 8.4 6 15 10 Germany 7.9 7.5 8.3 6 20 12 United Kingdom 7.6 7.3 7.9 6 22 13 Belgium 7.1 6.9 7.2 6 25 14 France 6.8 6.4 7.2 6 26 15 Estonia 6.5 6.1 6.8 8 27 16 Slovenia 6.4 5.9 6.8 8 28 17 Cyprus 6.3 6.0 6.6 4 30 18 Spain 6.1 5.7 6.5 6 32 19 Portugal 6.0 5.4 6.7 6 37 20 Malta 5.6 5.3 5.8 3 41 21 Poland 5.3 5.0 5.5 8 46 22 Lithuania 5.0 4.4 5.5 8 50 23 Hungary 4.7 3.9 5.5 8 53 24 Czech Republic 4.6 4.1 5.1 8 59 25 Latvia 4.3 3.7 4.8 6 59 25 Slovakia 4.3 3.8 4.9 8 67 27 Italy 3.9 3.5 4.4 6 69 28 Romania 3.7 3.3 4.2 8 73 29 Bulgaria 3.6 3.2 4.0 8 78 30 Greece 3.5 3.1 3.9 6 EASTERN EUROPE AND CENTRAL ASIA EUROPEAN UNION AND WESTERN EUROPE 10 11Transparency International Corruption Perceptions Index 2010
- 8. RANK REGIONAL RANK COUNTRY / TERRITORY CPI 2010 SCORE 90% CONFIDENCE INTERVAL SURVEYS USED LOWER BOUND UPPER BOUND 19 1 Qatar 7.7 6.6 8.6 7 28 2 United Arab Emirates 6.3 5.4 7.3 5 30 3 Israel 6.1 5.7 6.6 6 41 4 Oman 5.3 4.1 6.4 5 48 5 Bahrain 4.9 4.1 5.7 5 50 6 Jordan 4.7 4.0 5.5 7 50 6 Saudi Arabia 4.7 3.3 6.0 5 54 8 Kuwait 4.5 3.3 5.9 5 59 9 Tunisia 4.3 3.0 5.6 6 85 10 Morocco 3.4 2.9 3.9 6 91 11 Djibouti 3.2 2.1 4.7 3 98 12 Egypt 3.1 2.9 3.4 6 105 13 Algeria 2.9 2.6 3.2 6 127 14 Lebanon 2.5 2.0 2.9 4 127 14 Syria 2.5 2.1 2.8 5 146 16 Iran 2.2 1.6 3.1 4 146 16 Libya 2.2 2.0 2.4 6 146 16 Yemen 2.2 2.0 2.5 4 175 19 Iraq 1.5 1.2 1.9 3 RANK REGIONAL RANK COUNTRY / TERRITORY CPI 2010 SCORE 90% CONFIDENCE INTERVAL SURVEYS USED LOWER BOUND UPPER BOUND 33 1 Botswana 5.8 5.4 6.2 6 39 2 Mauritius 5.4 4.9 5.9 6 45 3 Cape Verde 5.1 4.1 6.1 4 49 4 Seychelles 4.8 3.0 6.8 3 54 5 South Africa 4.5 4.1 4.8 8 56 6 Namibia 4.4 3.9 4.9 6 62 7 Ghana 4.1 3.4 4.7 7 66 8 Rwanda 4.0 3.2 5.1 5 78 9 Lesotho 3.5 2.8 4.4 6 85 10 Malawi 3.4 2.8 3.9 7 87 11 Liberia 3.3 2.7 3.9 4 91 12 Gambia 3.2 1.9 4.4 5 91 12 Swaziland 3.2 3.1 3.4 4 98 14 Burkina Faso 3.1 2.4 3.8 6 101 15 Sao Tome and Principe 3.0 2.6 3.3 3 101 15 Zambia 3.0 2.7 3.3 7 105 17 Senegal 2.9 2.6 3.1 7 110 18 Benin 2.8 2.3 3.3 6 110 18 Gabon 2.8 2.1 3.3 3 116 20 Ethiopia 2.7 2.4 2.9 7 116 20 Mali 2.7 2.2 3.2 6 116 20 Mozambique 2.7 2.4 3.0 7 116 20 Tanzania 2.7 2.4 2.9 7 123 24 Eritrea 2.6 1.7 3.7 4 123 24 Madagascar 2.6 2.2 2.9 6 123 24 Niger 2.6 2.3 2.9 4 127 27 Uganda 2.5 2.1 2.9 7 134 28 Nigeria 2.4 2.2 2.7 7 134 28 Sierra Leone 2.4 2.1 2.6 5 134 28 Togo 2.4 1.8 3.0 4 134 28 Zimbabwe 2.4 1.8 3.0 7 143 32 Mauritania 2.3 1.9 2.7 6 146 33 Cameroon 2.2 2.0 2.4 7 146 33 Côte d´Ivoire 2.2 1.9 2.5 7 MIDDLE EAST AND NORTH AFRICA SUB-SAHARAN AFRICA Sub-Saharan Africa continued on next page. 12 13Transparency International Corruption Perceptions Index 2010
- 9. The Corruption Perceptions Index (CPI) 2010 is an aggregate indicator that brings together data from sources that cover the past two years. For the 2010 CPI, this includes surveys published between January 2009 and September 2010. DATA SOURCES: • The 2010 CPI is calculated using data from 13 sources by 10 independent institutions. All sources measure the overall extent of corruption (frequency and/or size of bribes) in the public and political sectors, and all sources provide a ranking of countries, i.e. include an assessment of multiple countries. • Evaluation of the extent of corruption in countries/ territories is done by two groups: country experts, both residents and non-residents, and business leaders. In the 2010 CPI, the following seven sources provided data based on expert analysis: African Development Bank, Asian Development Bank, Bertelsmann Foundation, Economist Intelligence Unit, Freedom House, Global Insight and the World Bank. Three sources for the CPI 2010 reflect the evaluations by resident business leaders of their own country, IMD, Political and Economic Risk Consultancy, and the World Economic Forum. • For CPI sources that are surveys, and where multiple years of the same survey are available, data for the past two years is included. • For sources that are scores provided by experts (risk agencies/country analysts), only the most recent iteration of the assessment is included, as these scores are generally peer reviewed and change very little from year to year. STEPS TO CALCULATE THE CPI: 1. The first step to calculate the CPI is to standardise the data provided by the individual sources (that is, translate them into a common scale). We use what is called a matching percentiles technique that takes the ranks of countries reported by each individual source. This method is useful for combining sources that have different distributions. While there is some information loss in this technique, it allows all reported scores to remain within the bounds of the CPI, i.e. to remain between 0 and 10. 2. The second step consists of performing what is called a beta-transformation on the standardised scores. This increases the standard deviation among all countries included in the CPI and makes it possible to differentiate more precisely countries that appear to have similar scores. 3. Finally, the CPI scores are determined by averaging all of the standardised values for each country. RESULTS: • The CPI score and rank are accompanied by the number of sources, the highest and lowest values given to every country by the data sources, the standard deviation and the confidence range for each country. • The confidence range is determined by what is called a bootstrap (non-parametric) methodology, which allows inferences to be drawn on the underlying precision of the results. A 90 per cent confidence range is then established, where there is only a five per cent probability that the value is below and a five per cent probability that the value is above this confidence range. For a more detailed explanation of the CPI method please visit www.transparency.org/cpi ANNEX A: SHORT METHODOLOGICAL NOTE RANK REGIONAL RANK COUNTRY / TERRITORY CPI 2010 SCORE 90% CONFIDENCE INTERVAL SURVEYS USED LOWER BOUND UPPER BOUND 154 35 Central African Republic 2.1 2.0 2.3 4 154 35 Comoros 2.1 1.7 2.6 3 154 35 Congo-Brazzaville 2.1 1.9 2.3 5 154 35 Guinea-Bissau 2.1 2.0 2.1 3 154 35 Kenya 2.1 2.0 2.3 7 164 40 Democratic Republic of the Congo 2.0 1.7 2.3 4 164 40 Guinea 2.0 1.8 2.2 5 168 42 Angola 1.9 1.8 2.0 6 168 42 Equatorial Guinea 1.9 1.7 2.1 3 170 44 Burundi 1.8 1.6 2.0 6 171 45 Chad 1.7 1.6 1.9 6 172 46 Sudan 1.6 1.4 1.9 5 178 47 Somalia 1.1 0.9 1.4 3 SUB-SAHARAN AFRICA CONTINUED 14 15Transparency International Corruption Perceptions Index 2010
- 10. NUMBER 4 5 6 ABBREVIATION CPIA EIU FH SOURCE World Bank (IDA and IBRD) Economist Intelligence Unit Freedom House NAME Country Policy and Institutional Assessment Country Risk Service and Country Forecast Nations in Transit YEAR PUBLISHED 2010 2010 2010 INTERNET http://go.worldbank.org/ S2THWI1X60 www.eiu.com www.freedomhouse.hu/ index.php?option=com_ content&task=view&id=196 WHO WAS SURVEYED? Country teams, experts inside and outside the bank Expert staff assessment Assessment by experts originating from or resident in the respective country SUBJECT ASKED Transparency, accountability, and corruption in the public sector The misuse of public office for private (or political party) gain: including corruption in public procurement, misuse of public funds, corruption in public service, and prosecution of public officials Extent of corruption as practiced in governments, as perceived by the public and as reported in the media, as well as the implementation of anti-corruption initiatives. NUMBER OF REPLIES Not applicable Not applicable Not applicable COVERAGE 77 countries (eligible for IDA funding) 135 countries 29 countries/territories NUMBER 1 2 3 ABBREVIATION ADB AFDB BTI SOURCE Asian Development Bank African Development Bank Bertelsmann Foundation NAME Country Performance Assessment Ratings Country Policy and Institutional Assessments Bertelsmann Transformation Index YEAR PUBLISHED 2010 2010 2009 INTERNET www.adb.org/Documents/ Reports/Country-Performance- Assessment-Exercise/default.asp www.afdb.org/pls/portal/url/ITEM /5008432D529957FAE040C00A 0C3D3A86 www.bertelsmann- transformation-index.de/english WHO WAS SURVEYED? Country teams, experts inside and outside the bank Country teams, experts inside and outside the bank Network of local correspondents and experts inside and outside the organisation SUBJECT ASKED Transparency, accountability, and corruption in the public sector Transparency, accountability, and corruption in the public sector The government’s capacity to punish and contain corruption NUMBER OF REPLIES Not applicable Not applicable Not applicable COVERAGE 28 countries (eligible for ADF funding) 53 countries 128 less developed and transition countries ANNEX B: SOURCES OF INFORMATION 16 17Transparency International Corruption Perceptions Index 2010
- 11. NUMBER 7 8 9 ABBREVIATION GI IMD SOURCE Global Insight IMD International, Switzerland, World Competitiveness Center NAME Country Risk Ratings IMD World Competitiveness Yearbook YEAR PUBLISHED 2010 2009 2010 INTERNET www.globalinsight.com www.imd.ch/wcc WHO WAS SURVEYED? Expert staff assessment Executives in top and middle management in domestic and international companies SUBJECT ASKED The likelihood of encountering corrupt officials, ranging from petty bureaucratic corruption to grand political corruption Category Institutional Framework - State Efficiency: “Bribing and corruption exist/do not exist” NUMBER OF REPLIES Not applicable 3,960 COVERAGE 201 countries 57 countries 58 countries NUMBER 10 11 ABBREVIATION PERC SOURCE Political & Economic Risk Consultancy NAME Asian Intelligence Newsletter YEAR PUBLISHED 2009 2010 INTERNET www.asiarisk.com WHO WAS SURVEYED? Expatriate business executives SUBJECT ASKED How serious do you consider the problem of corruption to be in the public sector? NUMBER OF REPLIES 1,750 2,174 COVERAGE 16 countries 16 countries NUMBER 12 13 ABBREVIATION WEF WEF SOURCE World Economic Forum NAME Global Competitiveness Report YEAR PUBLISHED 2009 2010 INTERNET www.weforum.org WHO WAS SURVEYED? Senior business leaders, domestic and international companies SUBJECT ASKED Undocumented extra payments or bribes connected with 1) exports and imports, 2) public utilities, 3) tax collection, 4) public contracts and 5) judicial decisions are common/never occur NUMBER OF REPLIES More than 12,000 More than 13,000 COVERAGE 133 countries 139 countries 18 19Transparency International Corruption Perceptions Index 2010
- 12. Transparency International International Secretariat Alt-Moabit 96 10559 Berlin Germany Phone: +49 - 30 - 34 38 200 Fax: +49 - 30 - 34 70 39 12 ti@transparency.org www.transparency.org