SlideShare a Scribd company logo
1 of 4
China M&A Briefing – End of Year 2009
Outbound M&A

Based on SmithStreetSolutions M&A data for the months from January to December of 2009, there were
a total of 120 announced outbound deals. The total value of those transactions amounted to USD 54.7
billion, an increase of 4.6% from last year based on 2008 M&A data released by the Ministry of Commerce
(MOFCOM).

The sharp rise in M&A activities, particularly in the second and third quarter, was spurred by a loosening
of government regulations regarding outbound transactions. A series of directives issued by the central
government in March and June attempted to ease prior restrictions and streamline the approval process
by delegating authority to local and provincial governments.

The robustness in Chinese acquisitions abroad is mainly due to the economy’s relative insulation from the
global financial crisis, and has largely been driven by demand in raw commodities, with a total of 29 deals
amounting to USD 41.2 billion in the energy sector. The majority of those deals were concentrated in
North America and Australia. Some of the largest and most notable transactions include Sinopec’s USD
7.24 billion bid for Addax Petroleum as well as China National Petroleum Corp. (CNPC) and PetroChina’s
acquisition of Petro-Canada’s Syrian and Libyan assets for USD 5 billion.

Our data also reveals China’s increasing hunger for foreign technology, as shown in the Technology,
Media, & Telecommunications (TMT) sector, which accounted for 13% of the deals that took place in 2009.
Lenovo, one of China’s fastest emerging brands, continued its international expansion by purchasing U.S.
based startup Switchbox Labs and plant assets from Polish car accessory manufacturer Inter Groclin Auto.
We believe that technology acquisitions will be the biggest undercurrent in Chinese outbound M&A in
2010 as the government continues to encourage the development of Chinese brands to global status.

                                  2009 Quarterly Outbound M&A
             USD Bn
        40                                                     52                                55
                                                                                                 50
        35
                                                                                                 45
        30                                                                                       40
                                          34
        25                                                                                       35
                                                              24.0                               30
        20                               22.6
                                                                                   19            25
        15            15                                                                         20

        10                                                                                       15
                                                                                                 10
         5                                                                         7.1
                      1.0                                                                        5
         0                                                                                       0
                      Q1                  Q2                   Q3                  Q4

                                              Value*         Volume
                                       *Based on announced deal size


                                                                                                         1
2009 Outbound M&A Activity


            Industry Breakdown by Volume                                         Industry Breakdown by Value*


                      Other                                                                              Other
                                    Healthcare                                                   TMT
                        2%                                                      Financial         1%      0%
            Industrials                1%
                                                                                   3%
               5%                                                      Consumer
                                                                      Discretionary
Financial
                                                                           7%
   9%


                                      Basic Materials                              Industrials
             TMT                            33%                                       11%
             13%                                                                                            Energy
                                                                                  Basic Materials            60%
                 Consumer                                                               18%
                                  Energy
                Discretionar
                                   22%
                    15%


            Regional Breakdown by Volume                                         Regional Breakdown by Value*


          Middle                                                                            Africa
                               South America                                                           South America
        East/Central                                                                         3%
                                    2%                                   Middle                             1%
            Asia
             5%                                                        East/Central
                                                                           Asia
                   Africa                                                  11%
                    6%

                                                                                                            Asia/Pacific
               Europe
                                                                                                                37%
                16%                  Asia/Pacific                             North America
                                         50%                                       23%


               North America
                    21%                                                                                Europe
                                                                                                        25%


                                                    *Based on announced deal size


                                                                                                                           2
Inbound M&A

According to SmithStreetSolutions M&A data, there were a total of 135 announced inbound deals
aggregating to USD 10.6 billion. In terms of transaction value, inbound M&A has seen a healthy and
steady rise throughout the year. Franklin Yao, CEO of SmithStreetSolutions, anticipates that inbound deals
will continue to pick up in 2010 due to increased domestic consumption and growing investor confidence
in the Chinese economy.

Our industry analysis shows that the majority of inbound dollars are concentrated in the consumer
discretionary, financial, industrials, and TMT sectors. This reflects three major trends in the Chinese
economy, namely the government’s push to spur private consumption, the restructuring of the Chinese
banking system, and the upgrading of China’s manufacturing sector towards higher value-added products.
Notable tractions include Spanish BBVA’s USD 1.45 billion investment in China Citic Bank, German
engineering manufacturer MAN SE’s USD 781 million investment in Sinotruk, and Japanese brewer Asahi’s
USD 667 million bid for Tsingtao Brewery. In terms of volume however, inbound deals are more evenly
spread out amongst various industries.

The Asia-Pacific region contributed nearly half (44%) of China’s inbound M&A by value, followed by
Europe (29%) and North America (27%). The U.S. was the single largest source of investment, with a
25.3% total share of inbound M&A value, driven by U.S. investors shifting resources to Asia for more
attractive returns.


                                  2009 Quarterly Inbound M&A
         USD Bn

         6                                                                                    50
                                         40                  42
         5                                                                                    40
                                                                                 32
         4
                                                                                              30
         3           21                                                          3.5
                                                             2.7                              20
         2                               2.6
                     1.8                                                                      10
         1

         0                                                                                    0
                     Q1                  Q2                  Q3                  Q4

                                               Value*          Volume


                                     *Based on announced deal size


                                                                                                       3
2009 Inbound M&A Activity


 Industry Breakdown by Volume                                                Industry Breakdown by Value*

                      Utilities                                                          Utilities
                        2%                                             Basic Materials     2%                Energy
Healthcare
                                                                Healthcare 2%                                 1%
   7%
                                                                   3%

                                                                  Other
     Other                                                         4%
                                      TMT
      8%
                                      23%                                       TMT                       Consumer
  Financial                                                                     10%                      Discretionary
     8%                                                                                                      33%

 Energy                              Consumer
                                                                               Industrials
   8%                               Discretionary
                                                                                  21%
  Basic Materials                        20%
                                                                                                     Financial
        10%
                      Industrials                                                                      24%
                         14%


Regional Breakdown by Volume                                                Regional Breakdown by Value*


     Middle                  Africa
   East/Central               1%
       Asia
        1%


       Europe
        17%                                                                     North Am erica
                                                                                     27%
                                                                                                            Asia/Pacific
                                  North America
                                                                                                                44%
                                       46%

       Asia/Pacific                                                                       Europe
           35%                                                                             29%


                                              *Based on announced deal size


                                                                                                                           4

More Related Content

What's hot

Obama social media campaign
Obama social media campaignObama social media campaign
Obama social media campaign
Kushal Setty
 
goodrich 4B172891-2E0A-4999-8551-09E2E82DAE5F_20090310JPMSlides
goodrich  4B172891-2E0A-4999-8551-09E2E82DAE5F_20090310JPMSlidesgoodrich  4B172891-2E0A-4999-8551-09E2E82DAE5F_20090310JPMSlides
goodrich 4B172891-2E0A-4999-8551-09E2E82DAE5F_20090310JPMSlides
finance44
 
Marketing in uncertain times
Marketing in uncertain timesMarketing in uncertain times
Marketing in uncertain times
Kantar
 
2006* Farnborough Airshow ApresentaçãO AviaçãO Comercial
2006* Farnborough Airshow   ApresentaçãO AviaçãO Comercial2006* Farnborough Airshow   ApresentaçãO AviaçãO Comercial
2006* Farnborough Airshow ApresentaçãO AviaçãO Comercial
Embraer RI
 
IFC Investor Presentation Q2 2011 August
IFC Investor Presentation Q2 2011 AugustIFC Investor Presentation Q2 2011 August
IFC Investor Presentation Q2 2011 August
Intact
 
European union - The Euro Debate
European union - The Euro DebateEuropean union - The Euro Debate
European union - The Euro Debate
mattbentley34
 
Johnson & Johnson: Pharmaceutical Business Review
Johnson & Johnson: Pharmaceutical Business ReviewJohnson & Johnson: Pharmaceutical Business Review
Johnson & Johnson: Pharmaceutical Business Review
investorrelation
 

What's hot (16)

KBank capital market perspectives jan 18 trade
KBank capital market perspectives jan 18 tradeKBank capital market perspectives jan 18 trade
KBank capital market perspectives jan 18 trade
 
T españa for_citi_10th_tconference_100323
T españa for_citi_10th_tconference_100323T españa for_citi_10th_tconference_100323
T españa for_citi_10th_tconference_100323
 
『英国のモバイル広告市場:ケーススタディ 』
『英国のモバイル広告市場:ケーススタディ 』『英国のモバイル広告市場:ケーススタディ 』
『英国のモバイル広告市場:ケーススタディ 』
 
Obama social media campaign
Obama social media campaignObama social media campaign
Obama social media campaign
 
goodrich 4B172891-2E0A-4999-8551-09E2E82DAE5F_20090310JPMSlides
goodrich  4B172891-2E0A-4999-8551-09E2E82DAE5F_20090310JPMSlidesgoodrich  4B172891-2E0A-4999-8551-09E2E82DAE5F_20090310JPMSlides
goodrich 4B172891-2E0A-4999-8551-09E2E82DAE5F_20090310JPMSlides
 
Economia global
Economia globalEconomia global
Economia global
 
Middle Market M&A Platform Business Pitch
Middle Market M&A Platform Business PitchMiddle Market M&A Platform Business Pitch
Middle Market M&A Platform Business Pitch
 
Marketing in uncertain times
Marketing in uncertain timesMarketing in uncertain times
Marketing in uncertain times
 
2006* Farnborough Airshow ApresentaçãO AviaçãO Comercial
2006* Farnborough Airshow   ApresentaçãO AviaçãO Comercial2006* Farnborough Airshow   ApresentaçãO AviaçãO Comercial
2006* Farnborough Airshow ApresentaçãO AviaçãO Comercial
 
"Growth: hope or reality?"
"Growth: hope or reality?""Growth: hope or reality?"
"Growth: hope or reality?"
 
Q3 2012 Marketbeat Presentation Eng Main
Q3 2012 Marketbeat Presentation Eng MainQ3 2012 Marketbeat Presentation Eng Main
Q3 2012 Marketbeat Presentation Eng Main
 
IFC Investor Presentation Q2 2011 August
IFC Investor Presentation Q2 2011 AugustIFC Investor Presentation Q2 2011 August
IFC Investor Presentation Q2 2011 August
 
European union - The Euro Debate
European union - The Euro DebateEuropean union - The Euro Debate
European union - The Euro Debate
 
RIF2LE - Integral Approach to Strategic Intelligence
RIF2LE - Integral Approach to Strategic IntelligenceRIF2LE - Integral Approach to Strategic Intelligence
RIF2LE - Integral Approach to Strategic Intelligence
 
The Solar Future DE - Karl Kuhlman "Can solar PV compete with grid energy in ...
The Solar Future DE - Karl Kuhlman "Can solar PV compete with grid energy in ...The Solar Future DE - Karl Kuhlman "Can solar PV compete with grid energy in ...
The Solar Future DE - Karl Kuhlman "Can solar PV compete with grid energy in ...
 
Johnson & Johnson: Pharmaceutical Business Review
Johnson & Johnson: Pharmaceutical Business ReviewJohnson & Johnson: Pharmaceutical Business Review
Johnson & Johnson: Pharmaceutical Business Review
 

Viewers also liked

Impressions about valencia (1)
Impressions about valencia (1)Impressions about valencia (1)
Impressions about valencia (1)
Natasha Dzhurkova
 
Presentación Voluntary Horizons en Español
Presentación Voluntary Horizons en EspañolPresentación Voluntary Horizons en Español
Presentación Voluntary Horizons en Español
voluntaryhorizons
 
Flujograma Fca
Flujograma FcaFlujograma Fca
Flujograma Fca
azucena7
 
Hfjchejkhcekrjfhckhkjfherkjfht
HfjchejkhcekrjfhckhkjfherkjfhtHfjchejkhcekrjfhckhkjfherkjfht
Hfjchejkhcekrjfhckhkjfherkjfht
Hiep La
 

Viewers also liked (20)

Netiqueta
NetiquetaNetiqueta
Netiqueta
 
Opening Suffolk School Art Exhibition
Opening Suffolk School Art ExhibitionOpening Suffolk School Art Exhibition
Opening Suffolk School Art Exhibition
 
capacitarh
capacitarhcapacitarh
capacitarh
 
Impressions about valencia (1)
Impressions about valencia (1)Impressions about valencia (1)
Impressions about valencia (1)
 
Educacion 20 2011_secundaria
Educacion 20 2011_secundariaEducacion 20 2011_secundaria
Educacion 20 2011_secundaria
 
¿Qué es global Alumni Global Search? Análisis
¿Qué es global Alumni Global Search? Análisis¿Qué es global Alumni Global Search? Análisis
¿Qué es global Alumni Global Search? Análisis
 
Secondbrain introduction to UXnet Meetup
Secondbrain introduction to UXnet MeetupSecondbrain introduction to UXnet Meetup
Secondbrain introduction to UXnet Meetup
 
Ny lähtee Loposesta!
Ny lähtee Loposesta!Ny lähtee Loposesta!
Ny lähtee Loposesta!
 
Αυτοχθονες λαοί - Μπαντου
 Αυτοχθονες λαοί - Μπαντου Αυτοχθονες λαοί - Μπαντου
Αυτοχθονες λαοί - Μπαντου
 
D m
D mD m
D m
 
Presentación Voluntary Horizons en Español
Presentación Voluntary Horizons en EspañolPresentación Voluntary Horizons en Español
Presentación Voluntary Horizons en Español
 
Flujograma Fca
Flujograma FcaFlujograma Fca
Flujograma Fca
 
Musica
MusicaMusica
Musica
 
Hfjchejkhcekrjfhckhkjfherkjfht
HfjchejkhcekrjfhckhkjfherkjfhtHfjchejkhcekrjfhckhkjfherkjfht
Hfjchejkhcekrjfhckhkjfherkjfht
 
Infinity wood
Infinity woodInfinity wood
Infinity wood
 
Manualfb Mp 100126050347 Phpapp02
Manualfb Mp 100126050347 Phpapp02Manualfb Mp 100126050347 Phpapp02
Manualfb Mp 100126050347 Phpapp02
 
A14
A14A14
A14
 
about Social Media
about Social Mediaabout Social Media
about Social Media
 
Lunch on the sky
Lunch on the skyLunch on the sky
Lunch on the sky
 
En historie om ruteinformasjon på mobiler i Norge
En historie om ruteinformasjon på mobiler i NorgeEn historie om ruteinformasjon på mobiler i Norge
En historie om ruteinformasjon på mobiler i Norge
 

Similar to China Ma Briefing End Of Year 2009

WEG 2Q10 Results Conference Call Presentation
WEG 2Q10 Results Conference Call PresentationWEG 2Q10 Results Conference Call Presentation
WEG 2Q10 Results Conference Call Presentation
WEG
 
EXFO - Marketing with RBC markets - March 2012
EXFO - Marketing with RBC markets - March 2012EXFO - Marketing with RBC markets - March 2012
EXFO - Marketing with RBC markets - March 2012
emarketingexfo
 
Korea Fund, Inc. Second Quarter 2012
Korea Fund, Inc. Second Quarter 2012Korea Fund, Inc. Second Quarter 2012
Korea Fund, Inc. Second Quarter 2012
Company Spotlight
 
Intralinks Deal Flow Indicator 2009 Q3
Intralinks Deal Flow Indicator 2009 Q3Intralinks Deal Flow Indicator 2009 Q3
Intralinks Deal Flow Indicator 2009 Q3
Alasdair Kilgour
 
du pont 4Q08 Conference Call Slides
du pont 4Q08 Conference Call Slidesdu pont 4Q08 Conference Call Slides
du pont 4Q08 Conference Call Slides
finance9
 
Tele2 Fourth quarter 2012
Tele2 Fourth quarter 2012Tele2 Fourth quarter 2012
Tele2 Fourth quarter 2012
Tele2
 
WEG 3Q10 Results Conference Call Presentation
WEG 3Q10 Results Conference Call PresentationWEG 3Q10 Results Conference Call Presentation
WEG 3Q10 Results Conference Call Presentation
WEG
 
2013 cloud it metering survey results
2013 cloud it metering survey results 2013 cloud it metering survey results
2013 cloud it metering survey results
Valencell, Inc.
 
Perspective 2020
Perspective 2020Perspective 2020
Perspective 2020
Abhishek Shah
 

Similar to China Ma Briefing End Of Year 2009 (20)

Optimum ventures - Bevo Agro - Take Private Proposal
Optimum ventures - Bevo Agro - Take Private ProposalOptimum ventures - Bevo Agro - Take Private Proposal
Optimum ventures - Bevo Agro - Take Private Proposal
 
Heavy Reading - Mobile Operator Perspectives: Monetization Optimization and V...
Heavy Reading - Mobile Operator Perspectives: Monetization Optimization and V...Heavy Reading - Mobile Operator Perspectives: Monetization Optimization and V...
Heavy Reading - Mobile Operator Perspectives: Monetization Optimization and V...
 
On line banking
On line bankingOn line banking
On line banking
 
Korea fund4q presentation
Korea fund4q presentationKorea fund4q presentation
Korea fund4q presentation
 
WEG 2Q10 Results Conference Call Presentation
WEG 2Q10 Results Conference Call PresentationWEG 2Q10 Results Conference Call Presentation
WEG 2Q10 Results Conference Call Presentation
 
After-sales service: why do Capital goods and heavy equipment companies leave...
After-sales service: why do Capital goods and heavy equipment companies leave...After-sales service: why do Capital goods and heavy equipment companies leave...
After-sales service: why do Capital goods and heavy equipment companies leave...
 
EXFO - Marketing with RBC markets - March 2012
EXFO - Marketing with RBC markets - March 2012EXFO - Marketing with RBC markets - March 2012
EXFO - Marketing with RBC markets - March 2012
 
Korea Supplement
Korea SupplementKorea Supplement
Korea Supplement
 
Korea Fund, Inc. Second Quarter 2012
Korea Fund, Inc. Second Quarter 2012Korea Fund, Inc. Second Quarter 2012
Korea Fund, Inc. Second Quarter 2012
 
Intralinks Deal Flow Indicator 2009 Q3
Intralinks Deal Flow Indicator 2009 Q3Intralinks Deal Flow Indicator 2009 Q3
Intralinks Deal Flow Indicator 2009 Q3
 
SU Student Investment Fund - Fall 2010
SU Student Investment Fund - Fall 2010SU Student Investment Fund - Fall 2010
SU Student Investment Fund - Fall 2010
 
WEG Q3 2012 Conference Call
WEG Q3 2012 Conference CallWEG Q3 2012 Conference Call
WEG Q3 2012 Conference Call
 
Sri Lanka Stock Market Quarterly earnings update sep 2011
Sri Lanka Stock Market Quarterly earnings update sep 2011Sri Lanka Stock Market Quarterly earnings update sep 2011
Sri Lanka Stock Market Quarterly earnings update sep 2011
 
Perspective 2020 - Nasscom
Perspective 2020 -  NasscomPerspective 2020 -  Nasscom
Perspective 2020 - Nasscom
 
du pont 4Q08 Conference Call Slides
du pont 4Q08 Conference Call Slidesdu pont 4Q08 Conference Call Slides
du pont 4Q08 Conference Call Slides
 
Tele2 Fourth quarter 2012
Tele2 Fourth quarter 2012Tele2 Fourth quarter 2012
Tele2 Fourth quarter 2012
 
WEG 3Q10 Results Conference Call Presentation
WEG 3Q10 Results Conference Call PresentationWEG 3Q10 Results Conference Call Presentation
WEG 3Q10 Results Conference Call Presentation
 
2013 cloud it metering survey results
2013 cloud it metering survey results 2013 cloud it metering survey results
2013 cloud it metering survey results
 
Anatoly Chubais speaking at Stanford Faculty Club
Anatoly Chubais speaking at Stanford Faculty ClubAnatoly Chubais speaking at Stanford Faculty Club
Anatoly Chubais speaking at Stanford Faculty Club
 
Perspective 2020
Perspective 2020Perspective 2020
Perspective 2020
 

Recently uploaded

State Space Tutorial.pptxjjjjjjjjjjjjjjj
State Space Tutorial.pptxjjjjjjjjjjjjjjjState Space Tutorial.pptxjjjjjjjjjjjjjjj
State Space Tutorial.pptxjjjjjjjjjjjjjjj
joshuaclack73
 
wiley-cpa-review-focus-notes revieww.pdf
wiley-cpa-review-focus-notes revieww.pdfwiley-cpa-review-focus-notes revieww.pdf
wiley-cpa-review-focus-notes revieww.pdf
allysaamping
 
一比一原版UNL毕业证成绩单如何办理
一比一原版UNL毕业证成绩单如何办理一比一原版UNL毕业证成绩单如何办理
一比一原版UNL毕业证成绩单如何办理
fafzen
 
Introduction to Economics II Chapter 28 Unemployment (1).pdf
Introduction to Economics II Chapter 28 Unemployment (1).pdfIntroduction to Economics II Chapter 28 Unemployment (1).pdf
Introduction to Economics II Chapter 28 Unemployment (1).pdf
Safa444074
 

Recently uploaded (20)

What exchange can I sell my pi coins in 2024
What exchange can I sell my pi coins in 2024What exchange can I sell my pi coins in 2024
What exchange can I sell my pi coins in 2024
 
Maximize Your Business Potential with Falcon Invoice Discounting
Maximize Your Business Potential with Falcon Invoice DiscountingMaximize Your Business Potential with Falcon Invoice Discounting
Maximize Your Business Potential with Falcon Invoice Discounting
 
Consumer rights and its importance and value
Consumer rights and its importance and valueConsumer rights and its importance and value
Consumer rights and its importance and value
 
Can a Pi network coin ever be sold out: I am ready to sell mine.
Can a Pi network coin ever be sold out: I am ready to sell mine.Can a Pi network coin ever be sold out: I am ready to sell mine.
Can a Pi network coin ever be sold out: I am ready to sell mine.
 
Will pi network launch in 2024: what's the update.
Will pi network launch in 2024: what's the update.Will pi network launch in 2024: what's the update.
Will pi network launch in 2024: what's the update.
 
how do i sell pi coins in Pakistan at the best rate.
how do i sell pi coins in Pakistan at the best rate.how do i sell pi coins in Pakistan at the best rate.
how do i sell pi coins in Pakistan at the best rate.
 
Jio Financial service Multibagger 2024 from India stock Market
Jio Financial service  Multibagger 2024 from India stock MarketJio Financial service  Multibagger 2024 from India stock Market
Jio Financial service Multibagger 2024 from India stock Market
 
How can I sell my Pi coins in Vietnam easily?
How can I sell my Pi coins in Vietnam easily?How can I sell my Pi coins in Vietnam easily?
How can I sell my Pi coins in Vietnam easily?
 
State Space Tutorial.pptxjjjjjjjjjjjjjjj
State Space Tutorial.pptxjjjjjjjjjjjjjjjState Space Tutorial.pptxjjjjjjjjjjjjjjj
State Space Tutorial.pptxjjjjjjjjjjjjjjj
 
wiley-cpa-review-focus-notes revieww.pdf
wiley-cpa-review-focus-notes revieww.pdfwiley-cpa-review-focus-notes revieww.pdf
wiley-cpa-review-focus-notes revieww.pdf
 
how do I get a legit pi buyer in the internet (2024)
how do I get a legit pi buyer in the internet (2024)how do I get a legit pi buyer in the internet (2024)
how do I get a legit pi buyer in the internet (2024)
 
Human Capital: Education and Health in Economic Development
Human Capital:  Education and Health      in Economic DevelopmentHuman Capital:  Education and Health      in Economic Development
Human Capital: Education and Health in Economic Development
 
How to exchange my pi coins on HTX in 2024
How to exchange my pi coins on HTX in 2024How to exchange my pi coins on HTX in 2024
How to exchange my pi coins on HTX in 2024
 
How do I sell my Pi Network currency in 2024?
How do I sell my Pi Network currency in 2024?How do I sell my Pi Network currency in 2024?
How do I sell my Pi Network currency in 2024?
 
一比一原版UNL毕业证成绩单如何办理
一比一原版UNL毕业证成绩单如何办理一比一原版UNL毕业证成绩单如何办理
一比一原版UNL毕业证成绩单如何办理
 
Abhay Bhutada: A Journey of Transformation and Leadership
Abhay Bhutada: A Journey of Transformation and LeadershipAbhay Bhutada: A Journey of Transformation and Leadership
Abhay Bhutada: A Journey of Transformation and Leadership
 
Population Growth and Economic Development
Population Growth and  Economic DevelopmentPopulation Growth and  Economic Development
Population Growth and Economic Development
 
Abhay Bhutada’s Plan to Boost Financial Growth in 2024
Abhay Bhutada’s Plan to Boost Financial Growth in 2024Abhay Bhutada’s Plan to Boost Financial Growth in 2024
Abhay Bhutada’s Plan to Boost Financial Growth in 2024
 
how do I cash out pi network coin in 2024.
how do I cash out pi network coin in 2024.how do I cash out pi network coin in 2024.
how do I cash out pi network coin in 2024.
 
Introduction to Economics II Chapter 28 Unemployment (1).pdf
Introduction to Economics II Chapter 28 Unemployment (1).pdfIntroduction to Economics II Chapter 28 Unemployment (1).pdf
Introduction to Economics II Chapter 28 Unemployment (1).pdf
 

China Ma Briefing End Of Year 2009

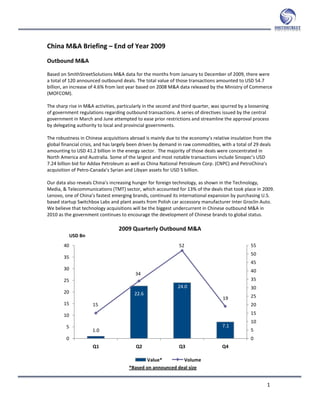
  • 1. China M&A Briefing – End of Year 2009 Outbound M&A Based on SmithStreetSolutions M&A data for the months from January to December of 2009, there were a total of 120 announced outbound deals. The total value of those transactions amounted to USD 54.7 billion, an increase of 4.6% from last year based on 2008 M&A data released by the Ministry of Commerce (MOFCOM). The sharp rise in M&A activities, particularly in the second and third quarter, was spurred by a loosening of government regulations regarding outbound transactions. A series of directives issued by the central government in March and June attempted to ease prior restrictions and streamline the approval process by delegating authority to local and provincial governments. The robustness in Chinese acquisitions abroad is mainly due to the economy’s relative insulation from the global financial crisis, and has largely been driven by demand in raw commodities, with a total of 29 deals amounting to USD 41.2 billion in the energy sector. The majority of those deals were concentrated in North America and Australia. Some of the largest and most notable transactions include Sinopec’s USD 7.24 billion bid for Addax Petroleum as well as China National Petroleum Corp. (CNPC) and PetroChina’s acquisition of Petro-Canada’s Syrian and Libyan assets for USD 5 billion. Our data also reveals China’s increasing hunger for foreign technology, as shown in the Technology, Media, & Telecommunications (TMT) sector, which accounted for 13% of the deals that took place in 2009. Lenovo, one of China’s fastest emerging brands, continued its international expansion by purchasing U.S. based startup Switchbox Labs and plant assets from Polish car accessory manufacturer Inter Groclin Auto. We believe that technology acquisitions will be the biggest undercurrent in Chinese outbound M&A in 2010 as the government continues to encourage the development of Chinese brands to global status. 2009 Quarterly Outbound M&A USD Bn 40 52 55 50 35 45 30 40 34 25 35 24.0 30 20 22.6 19 25 15 15 20 10 15 10 5 7.1 1.0 5 0 0 Q1 Q2 Q3 Q4 Value* Volume *Based on announced deal size 1
  • 2. 2009 Outbound M&A Activity Industry Breakdown by Volume Industry Breakdown by Value* Other Other Healthcare TMT 2% Financial 1% 0% Industrials 1% 3% 5% Consumer Discretionary Financial 7% 9% Basic Materials Industrials TMT 33% 11% 13% Energy Basic Materials 60% Consumer 18% Energy Discretionar 22% 15% Regional Breakdown by Volume Regional Breakdown by Value* Middle Africa South America South America East/Central 3% 2% Middle 1% Asia 5% East/Central Asia Africa 11% 6% Asia/Pacific Europe 37% 16% Asia/Pacific North America 50% 23% North America 21% Europe 25% *Based on announced deal size 2
  • 3. Inbound M&A According to SmithStreetSolutions M&A data, there were a total of 135 announced inbound deals aggregating to USD 10.6 billion. In terms of transaction value, inbound M&A has seen a healthy and steady rise throughout the year. Franklin Yao, CEO of SmithStreetSolutions, anticipates that inbound deals will continue to pick up in 2010 due to increased domestic consumption and growing investor confidence in the Chinese economy. Our industry analysis shows that the majority of inbound dollars are concentrated in the consumer discretionary, financial, industrials, and TMT sectors. This reflects three major trends in the Chinese economy, namely the government’s push to spur private consumption, the restructuring of the Chinese banking system, and the upgrading of China’s manufacturing sector towards higher value-added products. Notable tractions include Spanish BBVA’s USD 1.45 billion investment in China Citic Bank, German engineering manufacturer MAN SE’s USD 781 million investment in Sinotruk, and Japanese brewer Asahi’s USD 667 million bid for Tsingtao Brewery. In terms of volume however, inbound deals are more evenly spread out amongst various industries. The Asia-Pacific region contributed nearly half (44%) of China’s inbound M&A by value, followed by Europe (29%) and North America (27%). The U.S. was the single largest source of investment, with a 25.3% total share of inbound M&A value, driven by U.S. investors shifting resources to Asia for more attractive returns. 2009 Quarterly Inbound M&A USD Bn 6 50 40 42 5 40 32 4 30 3 21 3.5 2.7 20 2 2.6 1.8 10 1 0 0 Q1 Q2 Q3 Q4 Value* Volume *Based on announced deal size 3
  • 4. 2009 Inbound M&A Activity Industry Breakdown by Volume Industry Breakdown by Value* Utilities Utilities 2% Basic Materials 2% Energy Healthcare Healthcare 2% 1% 7% 3% Other Other 4% TMT 8% 23% TMT Consumer Financial 10% Discretionary 8% 33% Energy Consumer Industrials 8% Discretionary 21% Basic Materials 20% Financial 10% Industrials 24% 14% Regional Breakdown by Volume Regional Breakdown by Value* Middle Africa East/Central 1% Asia 1% Europe 17% North Am erica 27% Asia/Pacific North America 44% 46% Asia/Pacific Europe 35% 29% *Based on announced deal size 4