
Empfohlen
Weitere ähnliche Inhalte
Was ist angesagt?
Was ist angesagt? (17)
Andere mochten auch
Ähnlich wie Physics On the Road-Lesson 13
Ähnlich wie Physics On the Road-Lesson 13 (20)
Mehr von cstraughan
Mehr von cstraughan (17)
Kürzlich hochgeladen
Kürzlich hochgeladen (20)
Physics On the Road-Lesson 13
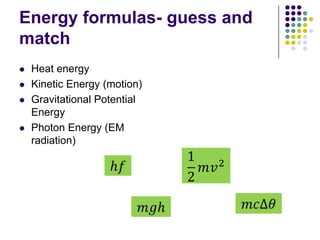
- 1. Energy formulas- guess and match Heat energy Kinetic Energy (motion) Gravitational Potential Energy Photon Energy (EM radiation)
- 2. Transport Engineering 1 Physics on the Road Lesson 12
- 3. LI… Investigate stopping distances Use graphs to analyse stopping distances
- 4. Stopping distances - revision
- 5. Stopping distances – made up of 2 parts
- 6. Plotting graph - data Speed km/h Speed m/s Reaction distance/ m Braking distance /m Stopping distance /m 50 21 21 60 25 31 70 29 42 80 33 55 90 37 70 100 42 85 110 46 104 Plot a graph of reaction distance against speed and braking distance against speed
- 7. Analysing the graphs 1. Use the gradient of the first graph and v=s/t to calculate the reaction time used. Draw a conclusion. 2. What do you notice about the speed against braking distance graph? Plot a new graph to investigate. 3. Use the equations of motion and the table below to plot a graph of braking time against speed. What do you notice? Initial speed (u) m/s u2 s a t
- 8. LI… Use ideas of work done, momentum and kinetic energy to explain vehicle motion Use W=Fd (or E=Fd), p=mv and Ek= ½ mv2
- 9. Braking – what happens A moving object has kinetic energy A stationary object has none Brakes apply a force on the wheels The brakes use frictional forces Brake discs and shoes heat up KE Force Braking distance Work done = force x distance Work done is energy and measured in Joules (J)
- 10. Work done and kinetic energy Brakes do work (apply a force over a distance) to transfer the kinetic energy of the vehicle. 1. Explain your speed braking distance graphs using these ideas 2. A goods train has mass of 2400 tonnes and travels at 100km/h. Calculate it’s kinetic energy. It takes 1 ½ km to stop. Calculate the force of it’s brakes. Work done = kinetic energy by brakes of vehicle Fd = ½ mv2 For a braking vehicle F - the brake force d – braking distance m- mass of the vehicle V – is the speed of the vehicle
- 11. Momentum Momentum of an object depends upon it’s mass and velocity. As a vehicle brakes it’s velocity and so it’s momentum is reduced over time So when a car brakes the loss of momentum is the braking force applied over time. Force x time = mass x acceleration x time momentum = mass x velocity p=mv F x t= m x a x t Ft = m x v-u x t t Ft = mv - mu Ft=Δp a=v-u/t Force x time = change in momentum