
Recommandé
Contenu connexe
En vedette
En vedette (20)
Similaire à Eurobserver Pv Barometer 2009
Similaire à Eurobserver Pv Barometer 2009 (20)
Eurobserver Pv Barometer 2009
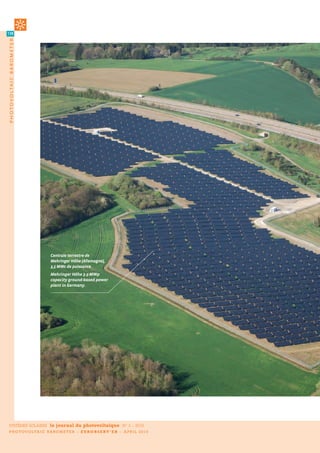
- 1. 128 photovoltaic b arometer Juwi Centrale terrestre de Mehringer Höhe (Allemagne), 3,5 MWc de puissance. e r er ö e 3.5- p c p c t ro -b se po er p t Ger . SYSTÈMES SOLAIRES le journal du photovoltaïque N° 3 – 2010 P H O T OV O L T A I C B A R O M E T E R – E U R O B S E R V ’ E R – A P R I L 2 0 1 0
- 2. 15 861,2 MWc/MWp 129 b aromètre photovoltaïque dans l’UE/in the EU BaroMètrE PHotoVoLtaÏQUE PHoToVoLTAIC bAromETEr Une étude réalisée par EurObserv’ER. st c rr e o t b E rObser ’E . e marché mondial du photovoltaïque a heglobalphotovoltaicmarketexpanded Lcontinuésaprogressionen2009.L’ondede Tagainin2009.Germanysetanewsystem chocgénéréeparleverrouillagedumarchéibé- installationrecordwhilethecapacitybuild-up riqueapuêtrecontenuegrâceàunnouveau ofthemajorsolarphotovoltaicmarketscon- record d’installation en allemagne et par la tainedthefalloutgeneratedbytheIberian montée en puissance des nouveaux grands marketderailment.TheEuropeanUnionhas marchés du solaire photovoltaïque. L’Union thehighestphotovoltaicplantcapacity,with européenneresteleprincipallieud’implanta- almost5.5GWpinstalledin2009. tiondescentralesphotovoltaïques,avecprès de5,5GWcinstallésdurantl’année2009. 78,1 % de la puissance installée dans le monde +5485,1 MWc/MWp installés dans l’UE durant l’année 2009 +52,9 % croissance du parc de l’UE en 2009 l’ont été dans l’UE additional capacity installed entre 2008 et 2009 of the 2009 world installed capacity in the EU during 2009 growth of the EU installed base was in the EU between 2008 and 2009 SYSTÈMES SOLAIRES le journal du photovoltaïque N° 3 – 2010 B A R O M È T R E P H O T OV O L T A Ï Q U E – E U R O B S E R V ’ E R – A V R I L 2 0 1 0
- 3. 130 photovoltaic b arometer es premières estimations des princi- l’énergie (AIE PVPS) à celles récemment deux installations allemandes, celle de L paux marchés mondiaux du photo- voltaïque établissent une puissance supplémentaire de l’ordre de 7 GWc, soit publiées par l’Epia (Association de l’in- Strasskirchen (54 MWc) et celle de Lieberose dustrie photovoltaïque européenne), le (53 MWc), mises en service en 2009. Le grou- marché japonais passerait de 225,3 à 484 pe américain SunEdison a même annoncé une croissance de l’ordre de 16,6 % par rap- MWc et celui des États- en mars dernier la construc- port à 2008 (6 GWc). Ce chiffre reste provi- Unis de 338 à 475 MWc, soit Le marché chinois tion d’une centrale de 72 soire et pourrait être consolidé à la hausse respectivement les troisiè- devrait atteindre au MWc dans la province ita- dans les prochains mois. Pour cette même me et quatrième marchés moins 500 MWc en 2010. lienne de Rovigo en Vénétie raison, le niveau d’installation de 2008 est mondiaux. Le marché chi- The Chinese market (nord-est de l’Italie). La nettement supérieur à celui annoncé dans nois est également très should rise to at least construction commencera notre précédent baromètre (Systèmes prometteur. Le CREIA (Chi- 500 MWp in 2010. au début du second se- Solaires, Le Journal du Photovoltaïque n° 1). nese Renewable Energy mestre 2010 et sera pleine- La plus forte consolidation vient d’Alle- Industries Association, Association des ment opérationnelle en fin d’année. Par magne, où l’Agence fédérale du réseau industries chinoises des énergies renou- comparaison, la plus grande centrale pho- (Bundesnetzagentur) a, pour la première velables) estime ce marché à 215 MWc en tovoltaïque sur toiture, installée en 2008 sur fois, publié un historique précis des rac- 2009. Il devrait, selon cette même source, l’usine de General Motors à Saragosse, en cordements photovoltaïques bénéficiant atteindre au moins 500 MWc en 2010, et Espagne, atteint 11,8 MWc de puissance. de la loi énergies renouvelables (EEG). peut-être même dépasser le GWc. Le marché des applications non reliées au La croissance mondiale enregistrée en La forte augmentation du volume d’instal- réseau progresse également, mais il est 2009 sera cependant plus faible qu’en lation réalisée ces deux dernières années plus difficile à mesurer faute d’études 2008, année où le marché avait plus que s’explique principalement par une hausse exhaustives. Ce marché est de plus en plus doublé par rapport à 2007. Hors Union de la rentabilité financière des projets de tourné vers les applications non domes- européenne (UE), les marchés américains grande puissance. On commence même à tiques (infrastructure de télécommunica- et japonais restent les plus importants. Si voir apparaître des centrales terrestres de tion, éclairage public, chargeurs pour télé- l’on compare les données d’installations plusieurs dizaines de mégawatts. Actuelle- phone et portable, bornes autoroutières, de 2008 des experts nationaux du Pro- ment, la plus grande ferme solaire en Euro- parcmètres, etc.). gramme des systèmes d’alimentation pho- pe, construite en 2008, de 60 MWc, est située tovoltaïques de l’Agence internationale de à Olmedilla, en Espagne. Elle est suivie de Installation d’un système photovoltaïque intégré sur un hangar agricole. I st to o te r te p oto o t c s ste o rc t r b r . Drachenbronn (Alsace, France). Ademe SYSTÈMES SOLAIRES le journal du photovoltaïque N° 3 – 2010 P H O T OV O L T A I C B A R O M E T E R – E U R O B S E R V ’ E R – A P R I L 2 0 1 0
- 4. 131 b aromètre photovoltaïque irst estimates of the main global photovoltaic markets put America and Japan are the biggest markets outside the European F additional capacity at around 7 GWp, equivalent to 16.6% growth over 2008 (6 GWp). However this is a provisional fig- ure, which could be revised upwards in the coming months, in the Union. The Japanese market will rise from 225.3 to 484 MWp and the US market from 338 to 475 MWp, making them the number three and number four world markets respectively, if we compare same way the 2008 installation level is much higher than we pre- the 2008 installation data from the IEA PVPS national experts with dicted in our previous barometer (Systèmes Solaires, Le Journal du the recent EPIA (European Photovoltaic Industry Association) Photovoltaïque n° 1). The highest consolidation was in Germany data. The Chinese market is also full of promise with CREIA (the where for the first time the Federal Network Agency (Bundesnet- Chinese Renewable Energies Industry Association) putting this zagentur) published an accurate log of photovoltaic system con- market at 215 MWp in 2009, reckoning that it should rise to at least nections that were assisted by the renewable energies law (EEG). 500 MWp in 2010, and possibly pass the 1 GWp mark. However world growth recorded for 2009 will fall short of its 2008 performance, when the market more than doubled its 2007 level. Tabl. n° 1 Puissance photovoltaïque installée dans l’Union européenne durant l’année 2008 et 2009* (en MWc). Photovoltaic capacity installed in the European Union during 2008 and 2009* (in MWp). 2008 2009* Réseau Hors réseau Réseau Hors réseau Total Total On-grid Off-grid On-grid Off-grid Germany , , , , , , Italy , , , , , , Czech Republic , , , , , , Belgium , , , , , , France , , , , , , Spain , , , , , , Greece , , , , , , Portugal , , , , , , United Kingdom , , , , , , Netherlands , , , , , , Slovenia , , , , , , Austria , , , , , , Bulgaria , , , , , , Finland , , , , , , Luxembourg , , , , , , Denmark , , , , , , Malta , , , , , , Cyprus , , , , , , Sweden , , , , , , Hungary , , , , , , Romania , , , , , , Slovakia , , , , , , Estonia , , , , , , Poland , , , , , , Lithuania , , , , , , Ireland , , , , , , Latvia , , , , , , totalEU27 5064,432 9,696 5074,128 5474,867 10,276 5485,143 *Estimation. Est te. – Les décimales sont séparées par une virgule. ec s re r tte t co . Source : EurObserv'ER 2010. SYSTÈMES SOLAIRES le journal du photovoltaïque N° 3 – 2010 B A R O M È T R E P H O T OV O L T A Ï Q U E – E U R O B S E R V ’ E R – A V R I L 2 0 1 0
- 5. 132 photovoltaic b arometer Tabl. n° 2 Puissance photovoltaïque cumulée dans les pays de l’Union européenne en 2008 et 2009* (en MWc). Cumulated photovoltaic capacity in the European Union countries at the end of 2008 and 2009* (in MWp). 2008 2009* Réseau Hors réseau Réseau Hors réseau Total Total On-grid Off-grid On-grid Off-grid Germany , , , , , , Spain , , , , , , Italy , , , , , , Czech Republic , , , , , , Belgium , , , , , , France , , , , , , Portugal , , , , , , Netherlands , , , , , , Greece , , , , , , Austria , , , , , , United Kingdom , , , , , , Luxembourg , , , , , , Sweden , , , , , , Slovenia , , , , , , Finland , , , , , , Bulgaria , , , , , , Denmark , , , , , , Cyprus , , , , , , Malta , , , , , , Poland , , , , , , Hungary , , , , , , Romania , , , , , , Ireland , , , , , , Slovakia , , , , , , Estonia , , , , , , Lithuania , , , , , , Latvia , , , , , , totalEU27 10 249,931 126,130 10 376,061 15 724,798 136,406 15 861,204 *Estimation. Est te. Les éc es so t sép rées p r e r e. ec s re r tte t co . Source : EurObserv'ER 2010. exactement) (tableau 2). La puissance la principale destination du marché mon- L’Union eUropéenne, moyenne par habitant se situe désormais à dial du photo voltaïque, puisqu’elle a principaLe destination 31,6 Wc contre 20,8 Wc en accueilli 78,1 % du volume d’ins- de La prodUction mondiaLe 2008 (tableau 3). L’année 2009 est une bonne année 31,6 Wc/Wp tallation (avec un marché mon- dial estimé à 7 GWc). L’effondrement du marché espagnol n’a pu pour un grand nombre de la puissance par habitant L’Union européenne reste par que ralentir la croissance de celui de l’Union pays de l’Union (Italie, dans l’UE fin 2009 conséquent la principale zone européenne. Selon les premières estima- République tchèque, Bel- capacity per capita in the de production d’électricité so- tions disponibles, la puissance installée de gique…), consolidant le EU at the end of 2009 laire. Celle-ci devrait tourner l’UE durant l’année 2009 devrait atteindre développement futur de la autour de 13,5 TWh en 2009, 5 485,1 MWc, soit 8,1 % de plus qu’en 2008 filière européenne, qui sera moins dépen- contre 7,4 TWh en 2008. (tableau 1). Sa puissance cumulée attein- dant de la taille du marché allemand. Le drait donc près de 16 GWc (15 861,2 MWc vieux continent est d’ailleurs resté en 2009 SYSTÈMES SOLAIRES le journal du photovoltaïque N° 3 – 2010 P H O T OV O L T A I C B A R O M E T E R – E U R O B S E R V ’ E R – A P R I L 2 0 1 0
- 6. 135 b aromètre photovoltaïque The main reason for the rise in installation volume over the past Tabl. n° 3 two years is the higher profitability of high-capacity projects. Puissance photovoltaïque par habitant des différents pays Ground-based plants with capacities running into the tens of de l’Union européenne en 2009* (en Wc/hab). megawatts are starting to appear. The largest installation in Photovoltaic power per inhabitant for each European Europe for the time being is the 60-MWp solar farm built at Union country in 2009* (in Wp/inhab). Olmedilla, Spain in 2008, followed by two German installations – at Strasskirchen (54 MWp) and Lieberose (53 MWp), commissioned Wc/hab Wp/inhab in 2009. The American SunEdison group announced last March that it would be constructing a 72-MWp plant in Rovigo province, Germany , Veneto (North-eastern Italy) starting early in the 2nd half of 2010, Spain , that will be fully operational by the end of the year. The scale of this plant contrasts sharply with the biggest roof-integrated pho- Luxembourg , tovoltaic system with just 11.8 MWp of capacity installed in 2008 Czech Rep , on General Motors’ Zaragoza plant in Spain. Belgium , The off-grid application market is also gaining ground, but is harder to monitor due to a lack of comprehensive surveys. The Italy , market is increasingly turning towards non-domestic applica- Portugal , tions such as telecommunications infrastructure, public lighting, Greece , telephone and cell phone chargers, motorway terminals, parking meters, and so on). Austria , France , Cyprus , the eUropean Union – the main destina- tion for the worLd’s prodUction Slovenia , Netherlands , The collapse of the Spanish market only slowed down the Euro- Malta , pean Union market’s growth. First available estimates put 2009 EU installed capacity at up to 5 485.1 MWp which is 8.1% higher Finland , than its 2008 level (t b e 1). If confirmed that would bring accu- Sweden , mulated capacity up to about 16 GWp (15 861.2 MWp to be precise) Denmark , (t b e 2). Mean per capita capacity now stands at 31.6 Wp as against 20.8 Wp in 2008 (t b e 3). Bulgaria , For many EU countries (Italy, Czech Republic, Belgium) that have United Kingdom , consolidated the future development of the European sector, Ireland , 2009 was a good year. Europe remained the main destination for the world’s photovoltaic market in 2009 as it concentrated Hungary , 78.1% of the installation volume (with the global market put at Slovakia , 7 GWp). Consequently the European Union is the main solar electricity pro- Estonia , ducing zone, generating around 13.5 TWh in 2009, as against 7.4 Romania , TWh in 2008. Poland , Germany leadinG by a lonG chalk Lithuania , Latvia , Calculating the installation volume of the German market accu- totalEU27 31,6 rately is always a hard task as the provisional data published at *Estimation. Est te. Les décimales sont séparées par une virgule. the beginning of the year is generally consolidated upwards dur- ec s re r tte t co . Source : EurObserv'ER 2010. ing the course of the year if not at the beginning of the following year. Early in April 2010 the Federal Network Agency worked out the additional “on-grid” capacity installed in Germany in 2009 at istry). For the first time, solar accounts for 1% of the country’s elec- 3 806.3 MWp, raising the accumulated capacity connected to the tricity supply and this percentage could double by 2011. grid to almost 10 GWp (9 785.3 MWp). Thus the annual capacity of The prime reason for the 2009 capacity installation level is the connections to the grid continued growing for another year at a sharp drop in the cost of systems during the year. According to runaway rate (+ 843 MWp in 2006, + 1 271 MWp in 2007 and + 1 809 BSW Solar (the German Solar Industry Association), the average MWp in 2008). price of roof-integrated systems up to 100 kWp capacity dropped In doing so, Germany has confirmed its world solar electricity pro- 25.6% from €4 216/kWp in the fourth quarter of 2008 to €3 ducing top rank slot with production of 6.2 TWh (4.4 TWh in 2008), up 40% on 2008, according to the BMU (German Environment Min- SYSTÈMES SOLAIRES le journal du photovoltaïque N° 3 – 2010 B A R O M È T R E P H O T OV O L T A Ï Q U E – E U R O B S E R V ’ E R – A V R I L 2 0 1 0
- 7. 136 photovoltaic b arometer Centrale terrestre de Waldalgesheim (Allemagne), 2,5 MWc de puissance. es e 2.5- p c p ct ro -b se po er p t Ger . Juwi l’allemaGne très loin devant Le niveau de puissance installée en 2009 c€/kWh selon la nature et la puissance des s’explique avant tout par une diminution panneaux. Ces propositions sont cepen- Définir précisément le volume d’installa- très importante du prix des systèmes au dant susceptibles d’évoluer, aucune déci- tion du marché allemand est toujours un cours de l’année. Selon BSW Solar (German sion définitive n’ayant été prise à la fin du exercice difficile. Les données provisoires Solar Industry Association), le prix moyen mois de mars. publiées en début d’année sont générale- des centrales installées sur toiture jusqu’à Ce sujet est actuellement très polémique ment consolidées nettement à la hausse en 100 kWc est passé outre-Rhin de 4 216 en Allemagne : souffrant d’un manque de cours d’année, voire même au début de l’an- euros/kWc au quatrième trimestre 2008 à compétitivité, l’industrie nationale a née suivante. Début avril 2010, l’Agence 3 135 euros/kWc au quatrième 2009, soit besoin de temps pour se restructurer et fédérale du réseau a établi la puissance une baisse de 25,6 %. Sachant qu’au deuxiè- réduire ses coûts. Une baisse trop impor- supplémentaire “reliée réseau” installée en me trimestre 2006 ces installations étaient tante du tarif d’achat pourrait mettre en Allemagne à 3 806,3 MWc en 2009, portant vendues 5 000 euros/kWc, la baisse atteint difficultés de nombreuses entreprises et se ainsi la puissance cumulée reliée réseau à donc quelque 37,7 % en trois ans. traduire par de fortes réductions d’effec- près de 10 GWc (9 785,3 MWc). Ce chiffre est Cette baisse sensible des prix est actuelle- tifs. De nombreuses entreprises ont retar- le résultat d’un rythme effréné de crois- ment bien supérieure à la dégressivité mise dé leurs investissements ou encore annon- sance depuis plusieurs années (+ 843 MWc en place dans le système actuel de tarif cé des délocalisations partielles de leur en 2006, + 1 271 MWc en 2007, + 1 809 MWc d’achat, fixé à 9 et 11 % au 1er janvier 2010. production en Asie. en 2008). Cette inadéquation sera corrigée en cours L’Allemagne a donc confirmé son rang de d’année par une hausse de la dégressivité. l’italie, deuxième marché premier producteur mon- Des discussions sont en mondial en 2009 dial d’électricité solaire cours à ce sujet entre le avec, selon le BMU (minis- tère de l’environnement +3811,3 gouvernement et les pro- fessionnels de la filière. L’Italie, après l’Allemagne et l’Espagne, est le troisième pays de l’Union européenne à allemand), une production MWc/MWp L’exécutif allemand a déjà franchir le cap symbolique des 1 000 MWc de 6,2 TWh (4,4 TWh en installés en Allemagne en 2009 proposé une réduction installés. Selon des données de l’ENEA 2008), en croissance de installed in Germany in 2009 supplémentaire du tarif (Agence nationale des nouvelles technolo- 40 % par rapport à 2008. Le d’achat de l’ordre de 16 % gies, de l’énergie et du développement éco- solaire représente pour la première fois 1 % à partir du 1er juillet pour les panneaux ins- nomique durable), le pays a connecté au de l’approvisionnement en électricité du tallés sur les toits, et de 15 % pour les pan- réseau une puissance additionnelle de 574 pays, et ce pourcentage pourrait doubler neaux en surface libre. Le prix d’achat d’ici 2011. s’échelonnerait entre 32,9 c€/kWh et 25,3 SYSTÈMES SOLAIRES le journal du photovoltaïque N° 3 – 2010 P H O T OV O L T A I C B A R O M E T E R – E U R O B S E R V ’ E R – A P R I L 2 0 1 0
- 8. 137 b aromètre photovoltaïque Puissance photovoltaïque installée dans l’Union européenne fin 2009*. Photovoltaic power capacity installed in the European Union at the end of 2009*. N N km km Finland n n° , Sweden n n° , , , n° , , , , Ireland , , , Lithuania , The Netherlands n° , , United Kingdom , , , , , TOTAL EU Belgium n° Poland n° Germany n any n° , , , , , , Luxembourg n n° , , Czech Rep. , n° , , , France1 n° , , , , , , Portuga Portugal n° g , , , , Slovenia n° , Spain n pain n° Bulgaria , Italy n aly n° , , , , , , , , , Malta n n° Cyprus n° , , Légende/Key Puissance cumulée installée Puissance installée durant l’année *Estimation. Est te. dans les pays de l’Union 2009 dans les pays de l’Union 1. DOM-COM inclus./French overseas Departments européenne fin 2009* (en MWc) européenne* (en MWc) and Territories included. Source : EurObserv'ER 2010. Cumulated installed capacity Installed capacity in the in the European Union countries European Union countries at the end of 2009* (in MWp) during 2009* (in MWp) SYSTÈMES SOLAIRES le journal du photovoltaïque N° 3 – 2010 B A R O M È T R E P H O T OV O L T A Ï Q U E – E U R O B S E R V ’ E R – A V R I L 2 0 1 0
- 9. 138 photovoltaic b arometer MWc en 2009, portant la puissance totale centrale de 3 kWc parfaitement intégrée au Cette rapide montée en puissance est connectée à 1 019 MWc (non compris 13,4 bâti pourrait être, jusqu’à la fin de 2011, de cependant problématique, car elle repose MWc pour des applications hors réseau). 57 c€/kWh (sur 20 ans), non inclus le bonus sur un système d’incitation qui n’avait pas Cette bonne année, l’Italie la doit à la plei- en cas d’autoconsommation sur site. La prévu que les coûts d’installations des cen- ne opérationnalité des mesures d’incita- rémunération de base devrait être beau- trales de grande puissance chuteraient de tion contenues dans le “Nuovo Conto Ener- coup plus faible pour les près de 40 % durant l’année gia”. Ce programme, qui valide un système centrales de plus de 1 MWc. 2009. La législation tchèque La République tchèque de tarif d’achat pour une puissance plafon- Le tarif actuel de 34,6 a en effet la particularité de a installé 411 MWc en née à 1 200 MWc (non inclus les 165 MWc c€/kWh devrait diminuer très peu différencier le une seule année. installés dans le cadre du plan précédent en trois temps durant l’an- niveau d’incitation en fonc- “Primo Conto Energia”), va bientôt arriver née 2011, passant de 31,3 The Czech Republic tion de la puissance. L’in- à échéance, certainement avant la fin du c€/kWh à 26,4 c€/kWh. Ces installed 411 MWp in a vestisseur a le choix entre premier semestre 2010. Le gouvernement tarifs baisseraient ensuite single year. un tarif d’achat classique n’avait pas, à la fin du mois de mars, enco- de 6 % par an en 2012 et ou un bonus écologique qui re dévoilé la version définitive du nouveau 2013. Dans l’attente de l’adoption définiti- s’ajoute au prix de marché. Dans ce cas, le système d’incitation. Les premiers projets ve du nouveau programme, ces informa- producteur vend son électricité à un cour- publiés début février montrent une forte tions restent à confirmer. tier qui la revend sur le marché de gros. volonté de différenciation des tarifs (42 au L’Office de régulation de l’énergie (ERU) total !), variant selon la puissance et le type un marché de plus de 400 mWc définit le tarif et le bonus chaque année de système. La nouvelle législation prendra en république tchèque avec une année d’avance, les prix ne pou- également en compte la baisse du prix des vant pas représenter moins de 95 % du prix modules photovoltaïques, qui a fortement La République tchèque a, selon le minis- de l’année précédente. Pour 2010, le régu- réduit les coûts d’investissements des cen- tère de l’Industrie et du Commerce, instal- lateur a logiquement choisi de réduire le trales de grande puissance. Il est aussi pré- lé 411 MWc en une seule année. Ce niveau tarif d’achat de 5 %. Le tarif est donc porté vu d’augmenter les tarifs standards en cas d’installation place le pays à la troisième pour les systèmes inférieurs à 30 kWc à d’augmentation de la performance énergé- place en termes de puissance nouvelle- 12,25 CZK/kWh (48,2 c€/kWh) et le bonus tique d’un bâtiment (jusqu’à 12 c€/kWh sup- ment installée (7e rang en 2008) et à la qua- écologique à 11,28 CZK/kWh (44,3 c€/kWh). plémentaires), ou si les centrales terrestres trième en puissance cumulée (8 e rang en Pour les systèmes de puissance supérieure sont construites sur des sites pollués ou 2008). Les perspectives de croissance pour à 30 kWc, le tarif d’achat est fixé à 12,15 d’enfouissement (jusqu’à 8 c€/kWh supplé- 2010 sont encore plus favorables : plus de CZK/kWh (47,8 c€/kWh) et le bonus écolo- mentaires). Selon une des dernières propo- 1 GWc pourrait être installé au cours de gique à 11,18 CZK/kWh (44 c€/kWh). sitions, le tarif d’achat standard pour une l’année. Le gouvernement prévoit de réduire forte- ment les conditions de rémunération de l’électricité solaire à partir du 1er janvier 2011. Le Parlement a déjà fait trois propo- Toiture équipée de sitions qui sont actuellement débattues. La tuiles photovoltaïques. première consiste à porter la réduction du oo co ere t tarif d’achat à 25 % par an. La deuxième, p oto o t c t es. plus difficile à appliquer, consiste à donner le droit au régulateur de recalculer le tarif d’achat au cas où le temps de retour sur investissement serait inférieur à 11 ans, pour ramener ce dernier à 15 ans. La der- nière proposition consiste à mettre en pla- ce, à partir du 1er mai 2011, des restrictions pour les centrales de plus de 20 MWc. la belGique confirme ses ambitions La Belgique est une nouvelle fois sur le devant de la scène. Selon les premières esti- mations communiquées par l’APERE (Asso- ciation pour la promotion des énergies renouvelables), le pays aurait installé 292,1 MWc en 2009, dont 251 MWc en Région fla- Juwi SYSTÈMES SOLAIRES le journal du photovoltaïque N° 3 – 2010 P H O T OV O L T A I C B A R O M E T E R – E U R O B S E R V ’ E R – A P R I L 2 0 1 0
- 10. 141 b aromètre photovoltaïque 135/kWp in the same quarter in 2009. Looking back to the second quarter of 2006 when the systems sold for €5 000/kWp, this drop is as much as 37.7%. Trackers photovoltaïques à For the time being this price cut more than compensates for the Montesquieu (Gironde, France). sliding scale set in the current feed-in tariff scheme, fixed at 9 and oto o t c tr c ers t 11% on 1st January 2010. This anomaly will be corrected during o tesq e (G ro e, Fr ce). the year by an increase in the sliding scale. Discussions are now under way between the government and the industry’s players. The government has already proposed to cut the feed-in tariff by an additional 16% from 1st July for roof-integrated panels and by 15% for free-standing panels. The buyback price would be stag- gered between €0.329/kWh and €0.253/kWh depending on panel type and capacity. However, these proposals are likely to change, as no final decision had been made by the end of March. This is a highly controversial subject in Germany as its industry is currently hit by competitiveness issues and needs time to restruc- ture and reduce costs. A too big reduction in the feed-in tariff could land many firms in difficulty and jeopardise many jobs. Most companies have postponed investments or even announced to partially shift production to Asia. italy, the World number tWo market in 2009 Italy is the third European Union country to pass the symbolic 1000 Géraldine Houot MWp installed mark, following Germany and Spain. According to ENEA (the Italian National Agency for New Technologies, Energy and Sustainable Economic Development), the country connected 574 MWp of additional capacity to the grid in 2009, bringing total connected capacity to 1 019 MWp (excluding 13.4 MWp of off-grid applications). Italy owes this good year to the full implementation of its Nuovo Conto Energia incentive programme which validates over 400 mWp in the czech republic a feed-in tariff system for capacity capped at 1 200 MWp (not including the 165 MWp installed under the previous Primo Conto According to the Czech Ministry of Industry and Trade, the Repub- Energia programme). The programme will shortly end, almost cer- lic installed 411 MWp in a single year. This installation rate cata- tainly before the end of the first half of 2010. By the end of March pults the country to third place in terms of newly installed capaci- the government had yet to unveil the final version of the new ty (7th place in 2008) and fourth place in terms of accumulated incentive scheme. The first drafts published early in February capacity (8th place in 2008). As there is a good chance that over 1 demonstrate its strong determination to differentiate the tariffs GWp will be installed by the end of this year, the growth prospects – 42 in all – that vary in line with system capacity for 2010 are even more encouraging. and type. The new incentive system will also make However this rapid rise is offset by the fact that it At the end of 2009 Italy allowance for the drop in the price of photovoltaic is based on an incentive system that had not antic- passed the symbolic modules that has dramatically reduced the invest- ipated that high-capacity plant installation costs one GWp barrier. ment costs of high-capacity plants. This new legis- would plummet by almost 40% in 2009. This is lation provides for increasing standard tariffs when- L’Italie a franchi fin because the Czech system makes almost no dis- ever measures are taken to increase the building 2009 le cap symbolique tinction for capacity in its incentive levels. energy performance level (up to an additional du GWc installé. Investors can choose between a conventional €0.12/kWh) or if the ground-based plants are con- feed-in tariff system and an environmental bonus structed on polluted or landfill sites (up to an additional €0.8/kWh). added to the market price. In the latter case, the producer sells One of the latest proposals suggests that the standard feed-in tar- his electricity to a trader who sells it on the wholesale market. iff for a 3-kWp plant perfectly integrated into a building could be Every year the Energy Regulatory Office (ERU) defines the tariff €0.57/kWh (for 20 years) up to the end of 2011, not excluding the and bonus a whole year in advance, the new prices cannot be less bonus in the event of self-consumption on site. The basic remu- than 95% of the previous year’s rate. For 2010, the regulator nat- neration should be much lower for plants with over 1 MWp of urally reduced the feed-in tariff by 5%. Therefore the tariff is capacity. The current tariff of €0.346/kWh should drop three times reduced to CZK 12.25/kWh (€0.482/kWh) for systems up to 30 kWp in 2011, to €0.313/kWh and then to €0.264/kWh. These tariffs will and the environmental bonus to CZK 11.28/kWh (€0.443/kWh). The then drop by 6% per annum in 2012 and 2013. While we await the feed-in tariff for systems with a capacity in excess of 30 kWp is adoption of the new programme in its finalised form, this should be taken as guideline data. SYSTÈMES SOLAIRES le journal du photovoltaïque N° 3 – 2010 B A R O M È T R E P H O T OV O L T A Ï Q U E – E U R O B S E R V ’ E R – A V R I L 2 0 1 0
- 11. 142 photovoltaic b arometer Ademe mande, 38 MWc en Région wallonne et 3,1 d’installation. Ce système a naturellement apprécier la rentabilité de ce type d’instal- MWc en Région bruxelloise. bénéficié aux centrales de grande puissan- lation, le gouvernement a préféré lancer en Le chiffre d’installation de la partie fla- ce, lesquelles ont aussi le plus profité de la 2009 un appel d’offres, portant sur un total mande a été communiqué par BelPV (Fédé- baisse du prix des modules. Un ajustement de 300 MWc répartis en 27 tranches sur 4 ration belge des entreprises photovol- a été opéré. À partir du 1er janvier 2010, le zones géographiques représentant autant taïques). Il devrait prochainement être prix d’un certificat vert photovoltaïque est de niveaux d’ensoleillement. À la date limi- consolidé par le VREG, le régulateur du mar- fixé à 350 euros. te de remise des offres, le 25 janvier dernier, ché de l’électricité et du gaz en région fla- 119 dossiers avaient été reçus représentant mande. Les données d’installation des la france, loin des leaders une puissance cumulée de 867 MWc. régions wallonne et bruxelloise provien- Le niveau de puissance installée est surtout nent respectivement de la CWAPE (Com- Avec 185,2 MWc raccordés au réseau élec- très faible comparé à l’ampleur des mission wallonne pour l’énergie) et de Bru- trique au cours de l’année 2009 (dont 46,7 demandes de raccordement. En effet, selon gel (Bruxelles gaz électricité). Ces différents MWc dans les départements d'outre-mer ou le SOeS, la puissance des installations en apports porteraient la DOM), le parc photovol- attente de raccordement au 31 décembre + 292,1 puissance totale instal- taïque a, selon le SOeS 2009 a atteint 3 438 MWc pour 58 544 lée dans le pays à 363 (Service de l’observation demandes déposées (2 789 MWc en métro- MWc, soit le 5e rang de et des statistiques), plus pole et 650 MWc dans les DOM), contre 1886 l’Union européenne. MWc/MWp que triplé depuis la fin de MWc au 30 juin de la même année pour La forte progression l’année 2008. La puissance 24 470 demandes. Les longs délais d’atten- La puissance supplémentaire constatée en région fla- cumulée raccordée en te s’expliquent à la fois par un afflux mas- installée en Belgique en 2009 mande s’explique par un The additional capacity France atteint fin 2009 sif de demandes de raccordement en fin système de certificats installed in Belgium in 2009 268,2 MWc (200,7 MWc en d’année, mais également par le manque de verts régional particuliè- métropole et 67,5 MWc techniciens pour raccorder les installations rement attractif. Dans ce mécanisme, le dans les DOM). Ce niveau d’installation plus au réseau national. prix minimum d’un certificat vert d’origine limité que chez les autres pays leader du Cet afflux de demandes a conduit le gou- photovoltaïque (équivalent à une produc- marché s’explique en partie par le choix de vernement à modifier les conditions tion de 1 MWh) avait été fixé dans un pre- ne pas favoriser le développement des cen- d’achat de l’électricité solaire en adoptant mier temps à 450 euros (soit 0,45 c€/kWh) et trales au sol en leur attribuant un tarif ce, quels que soient la puissance et le type d’achat relativement faible. Afin de mieux SYSTÈMES SOLAIRES le journal du photovoltaïque N° 3 – 2010 P H O T OV O L T A I C B A R O M E T E R – E U R O B S E R V ’ E R – A P R I L 2 0 1 0
- 12. 143 b aromètre photovoltaïque to 363 MWp, taking it to fifth place in the European Union. The reason for the sharp rise in installed capacity in the Flemish region is that it operates a particularly attractive regional green certificate system which offers a minimum price of 450 euros (or €0.0045/kWh) for a photovoltaic green certificate (equivalent to a production of 1 MWh) regardless of installation capacity or type. This system has naturally been a boon to high-capacity installations that have gained the most from the drop in the price of modules. An adjustment has set the price of a photo- voltaic green certificate at 350 euros from 1st January 2010. france trailinG behind the leaders According to SOeS (the Observation and Statistics Office), 185.2 MWp were connected to the grid during the course of 2009 (including 46.7 MWp in the Overseas Departments), increasing the photovoltaic base more than threefold since the end of 2008. The accumulated capacity connected in France rose at the end of 2009 to 268.2 MWp, 200.7 MWp thereof in mainland France and 67.5 MWp overseas. Part of the reason why this installation lev- el is lower than that of the other leading countries in the EU mar- ket, is the French government’s decision not to promote the development of ground-based plants, but to set a relatively low feed-in tariff. The government preferred to call a tender in 2009 to get a better grip on the profitability of this type of installa- tion. The target capacity is 300 MWp spread over 27 phases and over 4 geographical zones with 4 different sunshine levels. By the application expiry date, 25 January, 119 applications had been submitted for an accumulated capacity of 867 MWp. set at CZK 12.15/kWh (€0.478/kWh) and the environmental bonus However the installed capacity level seems low when compared at CZK 11.18/kWh (€0.44/kWh). against connection applications. This is because according to The government intends to slash the solar the SOeS, the capacity of installations 58544 electricity remuneration terms starting on awaiting connection as of 31 December 1st January 2011. Parliament has already 2009 had risen to 3 438 MWp for 58 544 tabled three proposals for debate. The first applications submitted (2 789 MWp in entails reducing the feed-in tariff by 25% mainland France and 650 MWp overseas), the number of pending applications per annum. The second, which is harder to as against 1 886 MWp on 30 June of the for grid connection in France apply, consists of authorising the regulator same year for 24 470 applications. The le nombre de demandes de raccordement to recalculate the feed-in tariff when the au réseau électrique français en attente massive influx of connection applications payback time is less than 11 years, to raise at the end of the year compounded by the it to 15 years. The third proposal would dearth of engineers to connect the instal- introduce restrictions for plants with over 20 MWp of capacity start- lations to the national grid have caused the long lead times. ing from 1st May 2011. The rush to submit applications prompted the government to change the solar electricity purchase terms by adopting a new belGium bolsters its ambitions order on 12 January, which like the previous order favours build- ing-integrated installations this time distinguishing three types Once again Belgium is in the spotlight. According to APERE’s first of tarification depending on the type of building, its usage (hous- estimates, Belgium installed 292.1 MWp in 2009 of which 251 ing, health, teaching and others) and the type of integration. MWp is spread over the Flemish region; 38 MWp over the Wal- A higher integration to the frame premium is awarded for sys- loon region… and 3.1 MWp over the Brussels Capital region. tems installed on the roof of a closed building (all side walls The installation figure for the Flemish region was supplied by closed) replacing the building elements that provide the roofing BelPV (the Belgian photovoltaic companies’ federation). It or closure (side wall), as well as the waterproofing function. A should be consolidated shortly by the VREG (Flemish Regulation lower simplified integration premium is also allocated for sys- Entity for the Electricity and Gas market). The installation data tems installed on open-sided buildings, if the system replaces for the Walloon and Brussels Capital regions come from CWAPE building elements that provide the walls and roofing as well as (the Walloon Commission for Energy) and Brugel (Brussels gas the waterproofing function. electricity) respectively. This capacity would raise the total installed capacity in Belgium SYSTÈMES SOLAIRES le journal du photovoltaïque N° 3 – 2010 B A R O M È T R E P H O T OV O L T A Ï Q U E – E U R O B S E R V ’ E R – A V R I L 2 0 1 0
- 13. 144 photovoltaic b arometer le 12 janvier dernier un nouvel arrêté. Com- L’ajustement intervient après plusieurs beaucoup plus problématique si, dans un me le précédent, ce dernier favorise les ins- années (2006 à 2008) pendant lesquelles les avenir proche, certains acteurs asiatiques tallations intégrées au bâti en distinguant prix avaient peu diminué, malgré d’impor- décidaient d’écouler provisoirement leur cette fois trois types de tarification selon tants gains de compétitivité industrielle marchandise à des prix inférieurs à leur la nature du bâtiment, son usage (habita- réalisée grâce aux économies d’échelle et coût réel de production. Ce qui ne semble tion, santé, enseignement et autres) et le aux innovations technologiques. La raison pas être le cas à l’heure actuelle. type d’intégration. en était le coût élevé de la matière premiè- La diminution des prix a renforcé la crédi- La “prime d’intégration au bâti” est la plus re, le silicium, en raison d’un manque de dis- bilité de l’industrie photovoltaïque sur le élevée. Elle est octroyée aux systèmes ins- ponibilité, mais surtout par une demande plan de sa capacité à réduire ses coûts de tallés sur la toiture d’un bâtiment clos (sur continuellement supérieure à l’offre. Cette production. Elle va permettre à la techno- toutes les faces latérales) situation a permis aux logie, à l’image de l’éolien, de renforcer son et qui remplacent des industriels (en particulier assise dans les grands pays consomma- éléments du bâtiment assurant la couverture ou la fermeture (face laté- rale), ainsi que la fonc- 80 % la diminution du prix ceux qui avaient sécurisé leur approvisionnement en silicium) de maintenir une forte rentabilité de teurs d’électricité (États-Unis, Chine, Japon, Corée du Sud, Italie, France, etc.), réduisant sa dépendance actuelle vis-à-vis de l’Alle- magne. Cette dépendance commençait à du silicium en 2009 tion d’étanchéité. Vient leurs investissements tout être dangereuse pour l’industrie mondiale, the decrease in the price ensuite la “prime d’inté- en augmentant significa- car ce marché pourrait rapidement arriver of silicon in 2009 gration simplifiée”. Elle tivement leurs capacités à saturation. Cette situation va cependant est allouée aux systèmes installés sur des de production. Parallèlement, ce niveau éle- amener l’industrie mondiale photovol- bâtiments non fermés, si le système rem- vé et continu des prix sur plusieurs années taïque à se restructurer au profit des place des éléments du bâti qui assurent le a permis de remettre sur le devant de la acteurs les mieux armés en termes de clos et le couvert, ainsi que la fonction scène certaines technologies couches réduction des coûts. d’étanchéité. minces qui ont pu démontrer leurs possibi- Les installations entrant dans le cadre de la lités de réduction significative des coûts de une industrie européenne prime d’intégration et qui sont situées sur production. au pied du mur un bâtiment à usage principal d’habitation, Il a également permis d’accélérer l’essor d’enseignement ou de santé bénéficient industriel et technologique des fabricants Dans ce contexte, le challenge sera plus dif- d’un tarif de 58 c€/kWh, et de 50 c€/kWh sur asiatiques (chinois en particulier). Ces der- ficile pour certains acteurs européens, qui les autres bâtiments. La prime d’intégra- niers ont, depuis plusieurs années, investi devront faire face à la diminution des aides tion simplifiée au bâti s’élève à 42 c€/kWh. massivement dans de nouvelles capacités à la production sur leur propre marché. Les Pour les autres installations, le tarif appli- de production, et ce, sur toute la chaîne de industriels européens qui parviendront à cable en métropole continentale est fixé à valeur de l’industrie photovoltaïque. Les conforter leur avance technologique en 31,4 c€/kWh pour les installations égales ou plus importants d’entre eux se sont appuyés réduisant sensiblement leurs coûts de pro- inférieures à 250 kWc, et entre 31,4 et 37,7 sur des technologies et des process de poin- duction, en acceptant de délocaliser une c€/kWh pour les installations de plus de 250 te (notamment développés en Europe et en partie de leur production, devraient pou- kWc, selon un indice d’ensoleillement défi- Australie), qui leur permettent de proposer voir passer ce cap, et participer à la crois- ni pour chaque département. Le tarif appli- des modules de bonne qualité à des prix sance future du marché mondial. Une des cable en Corse et dans les DOM s’élève à 40 extrêmement compétitifs. clés de la survie de l’industrie européenne c€/kWh. Une dégressivité de 10 % sera éga- passera également par un développement lement appliquée chaque année à partir du l’ère de la surproduction plus important des technologies couches 1er janvier 2012. minces, là où les possibilités de réduction L’augmentation considérable de la produc- de coûts de production sont les plus impor- tion de modules (lire plus loin), libérée par tantes. De nombreux producteurs euro- L’indUstrie face à Une crise un afflux de silicium sur le marché (175 000 péens développent actuellement des tech- de matUrité tonnes attendues en 2010 contre 70 000 en nologies et des process nouveaux qui 2008, selon Photon International), a pour la pourraient renverser la suprématie du sili- des prix à la baisse première fois fait entrer l’industrie photo- cium cristallin. voltaïque dans une ère de surproduction. L’industrie européenne est actuellement Le prix du silicium, des wafers et des Ce choc a été d’autant plus important que dans une mauvaise passe et continue à modules polycristallins a connu une baisse la croissance mondiale a été altérée en 2009 perdre des parts de marché (lire plus loin). sans précédent durant l’année 2009. Selon par l’effondrement espagnol, premier mar- L’industrie photovoltaïque allemande a une étude de iSuppli (cabinet de consultants ché de la planète en 2009. peu profité de la croissance du marché américain), le prix des modules cristallins a La baisse, même importante, du prix des mondial en 2009 et de celle de son marché chuté en moyenne de 37,8 %, le prix des modules n’est pas nécessairement une domestique. L’industrie espagnole a terri- wafers de 50 % et le prix du silicium de 80 %. mauvaise chose pour l’industrie, dans la blement souffert de l’effondrement de son Le rapport prévoit de nouvelles baisses en mesure où les prix restent au-dessus des 2010, mais nettement moins sensibles. coûts de production. La situation serait SYSTÈMES SOLAIRES le journal du photovoltaïque N° 3 – 2010 P H O T OV O L T A I C B A R O M E T E R – E U R O B S E R V ’ E R – A P R I L 2 0 1 0
- 14. 147 b aromètre photovoltaïque A tariff of €0.58/kWh is allocated to installations that benefit return to centre-stage as they were put through their paces to from the integration premium on a building whose primary use prune manufacturing costs radically. is housing, teaching or health care. A tariff of €0.50/kWh is allo- The high prices also opened up opportunities for Asian manu- cated to installations that have an integration premium on oth- facturers to accelerate their industrial and technological expan- er buildings, while a tariff of €0.42/kWh applies to buildings sion (the Chinese in particular). For a number of years the Chi- awarded the simplified integration premium. nese market players have invested massively in new The applicable mainland tariff is €0.314/kWh for installations of manufacturing capacity throughout the photovoltaic industry 250 kWp and less, and €0.314 to €0.377/kWh for installations of value chain. The biggest concerns have relied on leading-edge over 250 kWp, applying a sunshine exposure index set for each technologies and processes (primarily developed in Europe and department. The tariff applicable in Corsica and the French over- Australia) that have enabled them to offer good quality modules seas territories is €0.40/kWh. A 10% degression will also be at extremely keen prices. applied every year starting from 1st January 2012. the overproduction era the indUstry is facing a coming-of-age For the first time the photovoltaic industry has entered an era crisis of overproduction with a huge increase in module production (see be o ), set off by silicon flooding the market (175 000 tonnes prices fallinG expected in 2010 as against 70 000 in 2008, according to oto I ter t o ). The shock is all the sharper because world mar- Silicon, wafer and polycrystalline module prices dropped by ket growth was knocked sideways in 2009 by the collapse of its unprecedented levels in 2009. According to the American con- leading market, Spain, in 2009. sultancy, iSuppli, the price of crystalline As long as prices outstrip production costs, modules fell by an average of 37.8%, wafers For the first time in its history, even a slash in the price of modules, will do by 50% and silicon by 80% and it predicts fur- the photovoltaic industry has the industry no harm. The situation would be ther, but much smaller price drops in 2010. entered an era of overproduction. much more of a problem if a number of Asian There are a number of reasons for this dra- L’industrie photovoltaïque est players were to decide to dump their goods matic price realignment. This huge drop part- entrée pour la première fois de on the market by undercutting real manu- ly makes up for the slender reduction in mod- son histoire dans une ère facturing cost prices – which is not the case ule prices between 2006 and 2008, despite de surproduction. as it stands. the industry’s considerable gains in compet- The credibility of the photovoltaic industry itive strength achieved through economies of scale and techno- has been boosted by lowering of prices as regards its manu- logical innovations. The reason why prices were kept at high lev- facturing cost-cutting capacity. It will enable the technology els is partly because of silicon scarcity and particularly because to strengthen its foothold in the major electricity-consuming demand continually outpaced supply. The manufacturers (espe- countries (United States, China, Japan, South Korea, Italy, cially those who had secured their silicon supplies) exploited France, etc.), as wind power has done, reducing its current this situation to maintain high profit margins on their invest- dependency on the German market. As the German producers ments while significantly increasing their manufacturing capac- could soon reach saturation point, this dependency is begin- ities. At the same time, the new high pricing level kept up over several years enabled a number of thin film technologies to Mise en service fin 2009, Montalto di Castro est, avec 24 MWc de puissance, la plus grande centrale photovoltaïque italienne connectée au réseau. Connected at the end of 2009, Montalto di Castro (24 MWp) is the largest Italian on-grid photovoltaic plant. SunRay Renewable SYSTÈMES SOLAIRES le journal du photovoltaïque N° 3 – 2010 B A R O M È T R E P H O T OV O L T A Ï Q U E – E U R O B S E R V ’ E R – A V R I L 2 0 1 0
- 15. 148 photovoltaic b arometer Graph. n° 1 Évolution de la production de cellules de 2000 à 2009. Solar cell production 2000 to 2009. Source : Photon International (mars 2010/March 2010). 2000 2001 2002 2003 2004 2005 2006 2007 2008 2009 marché national. Comme un symbole, cet- comparés aux 7,9 GWc calculés en 2008 (gra- ment s’expliquer par le délai nécessaire te mauvaise année aura été fatale aux phique 1), soit une croissance de 56 %. La entre la vente d’un module et son raccor- usines madrilènes du groupe BP Solar, technologie polycristalline représenterait dement. En effet, si une centrale est en pourtant présent depuis plus de 25 ans 46,9 % de la production totale (47,7 % en cours d’installation, ou qu’elle est installée dans le pays, l’industriel ayant choisi de 2008), le monocristallin 34,1 % (38,3 % mais en attente de raccordement, la puis- concentrer sa production sur les usines les en 2008), les couches minces (CdTe, CIS, sance des modules vendus ne sera pas plus compétitives du groupe. a-Si/microcristalline et autres) 17,7 % prise en compte dans les statistiques (12,5 % en 2008) et le silicium ruban 1,4 % nationales d’installation. L’augmentation plus de 10 GWc produits dans (1,5 % en 2008). de la taille du marché entraîne nécessaire- le monde ? Selon cette enquête, les principaux pays ment une augmentation de l’écart entre le producteurs de cellules sont la Chine avec nombre des modules produits et celui des La forte diminution des prix des systèmes 38 % (32,7 % en 2008), devant l’Allemagne modules raccordés. Enfin, une partie de la photovoltaïque montre que nous sommes 15 % (18,5 % en 2008), le Japon 12,5 % (16 % puissance installée peut échapper aux clairement entrés dans une ère de surpro- en 2008), Taïwan 12,2 % (11,6 % en 2008) et la observateurs nationaux et ne pas être duction. Reste à en mesurer l’ampleur. Malaisie 6,4 % (2,1 % en 2008) (graphique 2). comptabilisée. Deux organismes, le site Internet Solar- Les principales régions de production sont buzz, d’une part, et le magazine Photon l’Asie avec 76,1 % (68,3 % en 2008), l’Europe actualités des principaux International, d’autre part, ont établi leurs 19,4 % (25,5 % en 2008), l’Amérique 4,4 % fabricants propres estimations suite à des enquêtes (5,5 % en 2008), enfin l’Afrique et le Moyen- auprès des fabricants. Orient 0,1 % (0,2 % en 2008). La production L’industrie photovoltaïque de la produc- Selon Solarbuzz, la production mondiale de provenant d’Océanie n’est plus référencée tion de cellules est très hétérogène. Elle se cellules solaires a atteint un total de 9,34 en 2009 (0,5 % en 2008). compose d’acteurs de différentes tailles GWc en 2009, comparée à une production disposant de capacités de production de de 6,85 GWc en 2008. Les cellules solaires en L’estimation de Photon International est plus d’un GWc à quelques MWc. Dans son couches minces représenteraient 18 % de plus préoccupante pour l’industrie que cel- enquête, Photon International a recensé la la production totale, et les fabricants chi- le de Solarbuzz, car elle indiquerait qu’une production de 170 fabricants, les dix pre- nois et taïwanais auraient porté leur part part beaucoup plus importante que prévue miers d’entre eux représentant moins de la de marché mondial à 49 % toutes techno- de la production mondiale est actuelle- moitié de la production mondiale (soit près logies confondues. Les estimations de Pho- ment stockée en usine, en attente de trou- de 46 %). Le classement, en termes de puis- ton International, également publiées en ver acquéreur. Une partie de la différence sance de cellules produites, des principaux mars dernier, établissent la production entre les chiffres des capacités installées mondiale de cellules à 12,3 GWc en 2009 et les chiffres de production peut égale- SYSTÈMES SOLAIRES le journal du photovoltaïque N° 3 – 2010 P H O T OV O L T A I C B A R O M E T E R – E U R O B S E R V ’ E R – A P R I L 2 0 1 0