SlideShare a Scribd company logo
1 of 5
Download to read offline
Geography        30+ minutes 30+ minutes Percent 45+ minutes 45+ minutes   Percent 60+ minutes 60+ minutes Percent
                       (2009 ACS)    (2000)   Change (2009 ACS)      (2000)     Change (2009 ACS)      (2000)    Change
United States            35.1%       34.5%      1.8%     15.5%       15.4%       0.6%       8.0%        8.0%       0.2%
Hawaii                   40.0%       38.9%      2.8%     16.6%       17.0%       -2.1%      7.8%        8.1%      -3.9%
Hawaii County            34.8%       30.8%     13.2%     17.7%       14.6%       21.1%     10.1%        8.0%      26.5%
Honolulu County          43.5%       42.2%      3.1%     17.8%       18.4%       -3.0%      8.3%        8.9%      -6.2%
Kauai County             25.5%       28.0%     -9.1%      8.4%       10.9%      -22.6%      2.7%        4.4%     -38.6%
Maui County              29.8%       29.4%      1.1%     11.3%       12.4%       -8.5%      4.3%        4.8%      -9.1%
Hawaiian Ocean View      82.5%       79.7%      3.6%     75.2%       72.0%       4.4%      63.0%       57.4%       9.7%
Kaaawa                   80.3%       70.5%     13.9%     55.7%       45.9%       21.3%     29.2%       25.6%      13.7%
Makaha Valley            76.8%       74.3%      3.4%     48.7%       55.4%      -12.1%     34.3%       35.9%      -4.3%
Laupahoehoe              76.5%       71.5%      7.0%     59.3%       35.2%       68.7%     38.9%       19.4%     100.8%
Fern Forest              76.4%       74.6%      2.5%     54.8%       41.0%       33.5%     28.4%       24.3%      16.8%
Fern Acres               73.8%       62.4%     18.4%     37.9%       16.4%      131.7%     25.0%        3.1%     697.2%
Hawaiian Beaches         73.6%       60.6%     21.3%     35.4%       26.2%       35.1%      9.8%        7.1%      38.6%
Maili                    73.1%       66.4%     10.1%     52.5%       47.6%       10.3%     27.6%       26.5%       4.3%
Iroquois Point           73.0%       70.4%      3.7%     42.5%       32.9%       29.2%     21.4%       15.7%      36.9%
Kukuihaele               72.9%       52.5%     38.8%     60.7%       17.7%      242.4%     52.1%       16.3%     219.7%
Eden Roc                 72.8%       54.2%     34.3%     31.5%       21.9%       43.8%     24.4%       21.9%      11.6%
Kahaluu                  71.4%       69.5%      2.9%     25.3%       32.4%      -21.7%      8.9%        9.0%      -0.6%
Ewa Beach                70.3%       67.2%      4.7%     43.8%       39.9%       9.8%      25.0%       23.0%       8.9%
Paauilo                  69.7%       68.9%      1.2%     50.0%       48.6%       2.9%      33.2%       27.4%      21.4%
Halaula                  69.3%       60.0%     15.5%     40.3%       29.7%       35.6%     21.8%        1.5%    1,320.2%
Ewa Gentry               68.2%       64.3%      6.1%     45.6%       35.8%       27.3%     31.6%       18.0%      75.7%
Ahuimanu                 67.9%       69.1%     -1.8%     23.8%       29.3%      -18.8%      9.2%        9.0%       2.2%
Mountain View            66.8%       40.4%     65.2%     26.4%       11.5%      129.7%     14.3%        8.4%      70.6%
Waimanalo Beach          66.3%       68.2%     -2.8%     33.7%       27.8%       21.3%     13.7%       11.8%      16.3%
Waianae                  66.0%       74.7%    -11.6%     41.6%       51.8%      -19.8%     23.0%       26.2%     -12.1%
Punaluu                  65.9%       67.7%     -2.6%     45.6%       48.6%       -6.1%     27.8%       18.7%      48.5%
Makaha                   65.1%       67.6%     -3.7%     48.0%       50.7%       -5.3%     25.1%       32.4%     -22.6%
Kapaau                   64.9%       54.6%     18.8%     34.1%       24.9%       36.7%     10.8%        7.2%      50.3%
Naalehu                  63.9%       37.9%     68.6%     57.2%       30.1%       90.1%     57.2%       30.1%      90.1%
Nanakuli                 63.8%       65.8%     -3.0%     37.8%       41.6%       -9.2%     20.9%       21.3%      -2.1%
Kawela Bay               62.7%       44.0%     42.5%     31.4%       43.1%      -27.2%     23.5%       37.6%     -37.4%
Ewa Villages             61.4%       59.4%      3.4%     32.4%       31.0%       4.5%      12.2%       20.6%     -40.6%
Waimanalo                61.3%       51.7%     18.7%     34.8%       19.7%       76.4%     18.2%        9.4%      93.3%
Geography         30+ minutes 30+ minutes Percent 45+ minutes 45+ minutes   Percent 60+ minutes 60+ minutes Percent
                        (2009 ACS)    (2000)   Change (2009 ACS)      (2000)     Change (2009 ACS)      (2000)   Change
Ainaloa                   61.3%       63.8%     -4.0%     35.0%       22.4%       56.0%     20.2%       12.0%     68.9%
Honokaa                   60.7%       52.4%     15.9%     45.7%       37.5%       21.8%     25.6%       12.7%    101.1%
Hawi                      60.3%       63.9%     -5.6%     32.2%       35.0%       -7.9%     13.8%        8.6%     60.4%
Waikane                   60.1%       71.7%    -16.2%     16.6%       21.5%      -22.8%      7.1%        6.5%      9.6%
Makakilo City             59.3%       58.9%      0.6%     29.1%       31.7%       -8.1%     13.6%       16.0%    -15.4%
Honaunau-Napoopoo         59.0%       49.2%     20.0%     41.2%       20.6%      100.2%     21.9%        9.1%    140.5%
Leilani Estates           58.6%       50.6%     15.9%     30.0%       16.6%       80.6%     13.3%       11.6%     15.2%
Haiku-Pauwela             56.6%       56.1%      0.9%     20.5%       19.1%       7.2%       7.5%       10.8%    -29.8%
Hawaiian Acres            56.5%       58.3%     -3.2%     21.0%       28.4%      -26.2%      8.4%       18.5%    -54.6%
Waialua                   56.0%       53.4%      5.0%     28.7%       32.5%      -11.5%     11.5%       16.9%    -32.0%
Village Park              54.9%       57.0%     -3.6%     25.5%       25.5%       0.1%      15.0%       13.7%      9.2%
Mililani Town             54.4%       50.5%      7.7%     23.9%       22.9%       4.2%      13.2%       10.8%     23.0%
Kailua (Honolulu)         54.0%       56.7%     -4.7%     16.9%       17.7%       -4.2%      6.1%        6.5%     -7.6%
Mokuleia                  53.6%       49.7%      8.0%     34.3%       34.9%       -1.7%     14.1%       19.5%    -27.6%
Hauula                    53.0%       59.0%    -10.1%     45.1%       43.5%       3.7%      32.2%       29.8%      8.0%
Waipahu                   52.6%       55.1%     -4.4%     25.0%       28.9%      -13.4%     13.7%       14.7%     -6.7%
Nanawale Estates          52.3%       64.6%    -19.1%     33.9%       26.5%       27.8%     25.6%       10.9%    135.2%
Volcano                   52.1%       50.8%      2.5%     19.4%       26.1%      -25.4%      4.4%        7.0%    -37.4%
Hawaiian Paradise Park    51.9%       42.0%     23.7%     17.5%       12.9%       36.0%      5.1%        6.9%    -25.7%
Pahoa                     50.9%       43.1%     18.2%     22.1%       13.8%       60.0%     20.3%        6.4%    218.1%
Heeia                     48.9%       52.9%     -7.5%     18.8%       17.8%       5.2%       3.9%        5.4%    -28.0%
Maunawili                 48.5%       55.2%    -12.2%     14.7%       15.5%       -5.2%      6.6%        5.1%     28.2%
Hanapepe                  48.2%       36.6%     31.9%     15.3%       15.9%       -4.2%      3.7%        4.4%    -15.7%
Whitmore Village          47.9%       47.4%      1.1%     20.7%       25.8%      -20.0%      7.3%       11.5%    -36.7%
Pupukea                   47.2%       67.8%    -30.4%     28.1%       48.1%      -41.7%     21.8%       28.2%    -22.8%
Captain Cook              46.9%       39.6%     18.5%     19.4%       11.8%       64.0%     13.1%        5.6%    134.8%
Wahiawa                   46.2%       51.9%    -10.9%     25.1%       27.3%       -7.9%     12.3%       13.7%    -10.1%
Waipio                    45.7%       51.4%    -11.2%     19.1%       28.1%      -32.0%     10.0%       13.0%    -22.7%
Kaneohe                   45.4%       49.9%     -8.9%     13.6%       16.6%      -18.2%      6.3%        7.0%    -10.3%
Waipio Acres              44.1%       48.6%     -9.2%     21.1%       22.2%       -4.7%     11.0%       11.4%     -3.3%
Pearl City                43.6%       41.1%      6.0%     17.0%       19.9%      -14.4%      7.9%        9.2%    -14.2%
Waimea (Big Island)       43.4%       40.1%      8.4%     30.9%       20.0%       54.8%     15.6%        8.5%     82.9%
Aiea                      42.8%       37.7%     13.7%     12.3%       15.6%      -21.4%      7.0%        5.6%     25.8%
Maunaloa                  42.4%       12.2%    248.8%     25.3%        2.7%      834.3%     25.3%        0.0%       N/A
Geography         30+ minutes 30+ minutes Percent 45+ minutes 45+ minutes Percent 60+ minutes 60+ minutes   Percent
                         (2009 ACS)    (2000)   Change (2009 ACS)      (2000)   Change (2009 ACS)      (2000)     Change
Waimalu                    41.6%       42.5%     -2.1%     16.7%       19.4%    -13.8%      7.4%        9.1%       -19.2%
Orchidlands Estates        40.9%       50.5%    -19.0%     16.5%       12.0%     37.1%     10.4%        4.9%      111.3%
Kahuku                     40.9%       37.4%      9.3%     32.6%       31.1%     4.7%      24.3%       22.4%        8.7%
Pahala                     40.0%       33.9%     18.1%     20.1%       24.7%    -18.4%     14.1%       18.9%       -25.2%
Waikoloa Village           39.8%       31.9%     24.7%     14.5%       12.8%     13.1%      5.8%        4.3%       35.0%
Makawao                    39.2%       43.0%     -8.6%      8.5%       16.7%    -49.0%      3.1%        8.3%       -62.3%
Kekaha                     39.2%       44.1%    -11.2%     19.8%       28.6%    -30.7%      9.0%       10.2%       -12.0%
Pukalani                   39.2%       27.8%     41.0%     21.2%       10.8%     95.6%     12.6%        2.2%      479.1%
Haleiwa                    38.9%       56.8%    -31.5%     21.4%       38.6%    -44.6%     10.6%       17.7%       -40.1%
Barbers Point Housing      38.7%       29.2%     32.7%     22.6%        0.0%      N/A       6.5%        0.0%         N/A
Honalo                     38.1%       25.9%     46.9%     10.7%       12.8%    -16.6%      3.4%        7.3%       -53.4%
Honomu                     38.1%       32.9%     15.6%     16.4%        6.9%    136.5%      8.5%        4.6%       83.1%
Kealakekua                 37.9%       30.5%     24.4%     12.8%        7.5%     70.0%      6.9%        4.7%       48.3%
Kaumakani                  37.4%       30.5%     22.7%      5.6%        5.5%     2.1%       0.0%        0.0%         N/A
Pakala Village             37.4%       20.9%     78.6%      8.7%        5.4%     60.2%      2.6%        0.8%      236.5%
Wailea-Makena              36.8%       27.7%     32.9%     12.6%       12.4%     1.2%       6.5%        4.1%       57.7%
Halawa                     35.1%       39.5%    -11.0%     13.9%       16.0%    -12.8%      4.3%        6.5%       -34.2%
Lawai                      35.0%       26.6%     31.6%      8.3%        7.4%     11.9%      5.8%        3.2%       81.9%
Honolulu                   34.9%       31.6%     10.4%      9.5%       10.0%     -4.8%      3.6%        4.6%       -21.3%
Kalaheo                    34.9%       33.8%      3.3%     11.1%        6.1%     82.1%      0.0%        3.5%      -100.0%
Anahola                    34.7%       52.5%    -33.9%      8.7%       17.0%    -49.1%      3.1%        8.4%       -63.5%
Waikapu                    33.0%       30.5%      8.0%     15.8%       11.5%     37.7%      5.0%        4.0%       25.9%
Waimea (Kauai)             32.7%       33.6%     -2.7%     13.3%       14.9%    -10.6%      5.2%        3.7%       39.2%
Kurtistown                 32.5%       32.6%     -0.4%      8.1%        7.1%     14.4%      2.8%        4.0%       -30.4%
Pepeekeo                   32.3%       28.5%     13.4%     17.4%       11.2%     55.1%     10.1%        8.4%       20.0%
Haliimaile                 31.9%       35.8%    -10.8%     11.7%       14.8%    -20.7%      4.0%        6.8%       -41.6%
Wheeler AFB                31.6%       16.0%     96.9%      8.4%        9.0%     -6.8%      2.5%        5.1%       -49.7%
Paia                       31.4%       32.9%     -4.3%     13.6%       12.9%     5.5%       6.2%        7.3%       -15.1%
Eleele                     31.2%       45.5%    -31.5%     11.5%       14.1%    -18.2%      0.0%        6.6%      -100.0%
Kahului                    31.0%       27.9%     11.3%     12.5%       13.2%     -5.2%      4.7%        4.1%       16.7%
Waihee-Waiehu              30.7%       37.2%    -17.7%     16.0%       15.9%     1.2%       3.7%        4.4%       -15.5%
Wailua Homesteads          29.9%       28.1%      6.7%     11.5%       12.4%     -6.9%      5.0%        4.7%        7.3%
Kahaluu-Keauhou            29.3%       17.2%     71.0%      9.0%        6.0%     50.5%      5.0%        4.9%        3.7%
Kapaa                      29.0%       32.2%    -10.0%      8.6%       11.1%    -22.4%      2.1%        2.7%       -24.4%
Geography       30+ minutes 30+ minutes Percent 45+ minutes 45+ minutes Percent 60+ minutes 60+ minutes   Percent
                       (2009 ACS)    (2000)   Change (2009 ACS)      (2000)   Change (2009 ACS)      (2000)     Change
Kihei                    28.2%       24.6%     14.5%      8.4%       10.8%     -22.6%     2.6%        3.8%       -31.5%
Kalaoa                   27.5%       24.4%     12.5%      7.2%        5.2%     37.5%      5.5%        3.1%       78.9%
Paukaa                   26.4%       14.2%     85.9%      9.0%       10.8%     -16.7%     6.7%        8.5%       -20.9%
Keaau                    25.7%       18.0%     42.6%     16.3%        8.6%     88.8%     13.5%        5.5%      144.9%
Maalaea                  25.6%       33.5%    -23.6%      0.0%       13.2%    -100.0%     0.0%        6.6%      -100.0%
Wainaku                  24.1%       14.2%     69.6%     12.7%       10.9%     15.8%      8.2%        7.9%        4.4%
Puako                    23.5%       19.3%     21.6%     13.1%        9.0%     46.1%      9.5%        8.5%       12.2%
Papaikou                 23.3%       22.8%      2.1%      9.3%       11.8%     -21.2%     6.2%        8.3%       -25.6%
Omao                     22.9%       16.1%     42.2%      7.1%        7.2%      -0.5%     2.9%        3.4%       -13.7%
Kailua (Big Island)      22.9%       18.9%     20.8%      4.7%        7.0%     -33.8%     1.8%        3.8%       -53.2%
Holualoa                 22.3%       20.9%      6.7%     11.6%       10.2%     14.1%      5.7%        4.8%       18.5%
Wailuku                  22.2%       29.2%    -24.0%      8.0%       13.4%     -40.2%     3.2%        4.3%       -24.3%
Princeville              21.6%       34.2%    -36.8%     12.7%       15.9%     -20.1%     3.3%       10.1%       -67.7%
Wailua                   20.5%       18.5%     11.1%      4.9%        4.4%     11.7%      1.3%        2.0%       -34.6%
Koloa                    18.7%       24.9%    -24.9%      4.7%        5.9%     -20.0%     2.9%        3.5%       -17.7%
Laie                     18.7%       20.0%     -6.2%     16.3%       17.7%      -7.4%    13.5%       13.6%        -0.7%
Kilauea                  17.8%       23.0%    -22.6%     10.6%        9.7%      9.0%      2.5%        4.7%       -47.3%
Poipu                    17.3%       20.8%    -16.7%      2.1%        6.8%     -69.4%     1.4%        1.6%       -15.8%
Hanamaulu                16.6%       17.9%     -7.0%      6.3%       10.1%     -37.6%     2.4%        3.3%       -26.7%
Hickam Housing           14.4%       11.3%     27.2%      2.6%        4.4%     -41.8%     0.4%        1.8%       -79.2%
Kaanapali                14.4%       19.5%    -26.5%     11.1%       13.9%     -19.9%     2.0%        4.8%       -58.3%
Kaunakakai               14.3%       21.4%    -33.0%      5.6%        8.0%     -30.2%     0.8%        3.7%       -79.1%
Hilo                     14.0%       11.7%     19.7%      7.8%        7.1%      9.8%      5.7%        5.4%        6.4%
Kualapuu                 11.4%       19.7%    -42.2%      9.3%        6.6%     40.7%      6.6%        4.5%       46.0%
Kaneohe Station          11.1%       10.8%      2.2%      2.2%        4.5%     -51.0%     0.2%        2.3%       -93.0%
Kalihiwai                11.1%       19.7%    -43.6%      7.5%       11.9%     -36.5%     1.9%        5.1%       -63.0%
Lihue                    10.6%       13.7%    -22.6%      2.7%        5.2%     -47.9%     1.5%        3.1%       -51.2%
Kapalua                  10.6%       29.5%    -64.2%      1.4%       12.8%     -89.0%     1.4%        7.7%       -81.7%
Puhi                     10.2%       17.6%    -42.3%      2.7%        6.9%     -61.1%     1.3%        5.5%       -75.7%
Napili-Honokowai         10.1%       15.5%    -34.8%      5.2%        6.3%     -17.8%     1.9%        4.2%       -54.5%
Schofield Barracks        8.7%        7.7%     13.0%      3.7%        3.9%      -6.2%     1.6%        2.2%       -27.9%
Lahaina                   8.7%       11.8%    -26.2%      2.4%        3.6%     -34.6%     0.2%        1.2%       -80.3%
Hanalei                   7.2%       17.8%    -59.5%      0.7%       11.4%     -94.2%     0.0%        7.9%      -100.0%
Hana                      6.9%        7.7%    -10.4%      4.2%        6.0%     -30.0%     1.9%        5.3%       -64.2%
Geography   30+ minutes 30+ minutes Percent 45+ minutes 45+ minutes Percent 60+ minutes 60+ minutes Percent
                   (2009 ACS)    (2000)   Change (2009 ACS)      (2000)   Change (2009 ACS)      (2000)   Change
Lanai City            3.6%        7.9%    -54.5%     0.6%         2.8%    -77.1%     0.6%         2.0%    -67.7%

More Related Content

What's hot

Languages Spoken in the Home — 2009 Breakdown
Languages Spoken in the Home — 2009 BreakdownLanguages Spoken in the Home — 2009 Breakdown
Languages Spoken in the Home — 2009 BreakdownHonolulu Civil Beat
 
Civil beat poll sept. 7 8, 2010 mayor crosstabs and toplines
Civil beat poll sept. 7 8, 2010 mayor crosstabs and toplinesCivil beat poll sept. 7 8, 2010 mayor crosstabs and toplines
Civil beat poll sept. 7 8, 2010 mayor crosstabs and toplinesHonolulu Civil Beat
 
Best countries for business 2013
Best countries for business 2013Best countries for business 2013
Best countries for business 2013Grant Thornton
 
Real Time Enrollment of IPS and Charter Schools
Real Time Enrollment of IPS and Charter SchoolsReal Time Enrollment of IPS and Charter Schools
Real Time Enrollment of IPS and Charter SchoolsAbdul-Hakim Shabazz
 
Assessing the Economics of Obesity and Obesity Interventions by Michael J. O'...
Assessing the Economics of Obesity and Obesity Interventions by Michael J. O'...Assessing the Economics of Obesity and Obesity Interventions by Michael J. O'...
Assessing the Economics of Obesity and Obesity Interventions by Michael J. O'...Wisconsin Women's Health Foundation
 
Desempleo Por Edad
Desempleo Por EdadDesempleo Por Edad
Desempleo Por EdadAisart
 
Philosophy - Lesson 5 - Is There a God?
Philosophy - Lesson 5 - Is There a God?Philosophy - Lesson 5 - Is There a God?
Philosophy - Lesson 5 - Is There a God?RMPSuccess
 

What's hot (12)

Languages Spoken in the Home — 2009 Breakdown
Languages Spoken in the Home — 2009 BreakdownLanguages Spoken in the Home — 2009 Breakdown
Languages Spoken in the Home — 2009 Breakdown
 
States Race
States RaceStates Race
States Race
 
Home Value State Rankings
Home Value State RankingsHome Value State Rankings
Home Value State Rankings
 
Civil beat poll sept. 7 8, 2010 mayor crosstabs and toplines
Civil beat poll sept. 7 8, 2010 mayor crosstabs and toplinesCivil beat poll sept. 7 8, 2010 mayor crosstabs and toplines
Civil beat poll sept. 7 8, 2010 mayor crosstabs and toplines
 
Best countries for business 2013
Best countries for business 2013Best countries for business 2013
Best countries for business 2013
 
Real Time Enrollment of IPS and Charter Schools
Real Time Enrollment of IPS and Charter SchoolsReal Time Enrollment of IPS and Charter Schools
Real Time Enrollment of IPS and Charter Schools
 
States — Place of Birth
States — Place of BirthStates — Place of Birth
States — Place of Birth
 
Assessing the Economics of Obesity and Obesity Interventions by Michael J. O'...
Assessing the Economics of Obesity and Obesity Interventions by Michael J. O'...Assessing the Economics of Obesity and Obesity Interventions by Michael J. O'...
Assessing the Economics of Obesity and Obesity Interventions by Michael J. O'...
 
Patient-Provider Collaboration for Patient Safety
Patient-Provider Collaboration for Patient SafetyPatient-Provider Collaboration for Patient Safety
Patient-Provider Collaboration for Patient Safety
 
Desempleo Por Edad
Desempleo Por EdadDesempleo Por Edad
Desempleo Por Edad
 
Ebi.ferrier.2011 sdep
Ebi.ferrier.2011 sdepEbi.ferrier.2011 sdep
Ebi.ferrier.2011 sdep
 
Philosophy - Lesson 5 - Is There a God?
Philosophy - Lesson 5 - Is There a God?Philosophy - Lesson 5 - Is There a God?
Philosophy - Lesson 5 - Is There a God?
 

Viewers also liked

Civil Beat Oct. 23 Poll - Governor and U.S. Senate
Civil Beat Oct. 23 Poll - Governor and U.S. SenateCivil Beat Oct. 23 Poll - Governor and U.S. Senate
Civil Beat Oct. 23 Poll - Governor and U.S. SenateHonolulu Civil Beat
 
Hi general election issues poll results
Hi general election issues poll resultsHi general election issues poll results
Hi general election issues poll resultsHonolulu Civil Beat
 
Feb 2011 letter re new developments final
Feb 2011 letter re new developments finalFeb 2011 letter re new developments final
Feb 2011 letter re new developments finalHonolulu Civil Beat
 
Gov. Abercrombie 6/16 budget cuts memo
Gov. Abercrombie 6/16 budget cuts memoGov. Abercrombie 6/16 budget cuts memo
Gov. Abercrombie 6/16 budget cuts memoHonolulu Civil Beat
 
Health Department withheld documents
Health Department withheld documentsHealth Department withheld documents
Health Department withheld documentsHonolulu Civil Beat
 
Legislative agency salaries spring 2011
Legislative agency salaries spring 2011Legislative agency salaries spring 2011
Legislative agency salaries spring 2011Honolulu Civil Beat
 
ORI Anuenue Hale grant application
ORI Anuenue Hale grant applicationORI Anuenue Hale grant application
ORI Anuenue Hale grant applicationHonolulu Civil Beat
 
Civil Beat Poll September 2012 voice crosstabs
Civil Beat Poll September 2012 voice crosstabsCivil Beat Poll September 2012 voice crosstabs
Civil Beat Poll September 2012 voice crosstabsHonolulu Civil Beat
 
Hawaii ERS quarter ended Sept 30
Hawaii ERS quarter ended Sept 30Hawaii ERS quarter ended Sept 30
Hawaii ERS quarter ended Sept 30Honolulu Civil Beat
 
Phoenix Arizona Real Estate Market
Phoenix Arizona Real Estate MarketPhoenix Arizona Real Estate Market
Phoenix Arizona Real Estate MarketPhil Sexton
 

Viewers also liked (20)

Civil Beat Oct. 23 Poll - Governor and U.S. Senate
Civil Beat Oct. 23 Poll - Governor and U.S. SenateCivil Beat Oct. 23 Poll - Governor and U.S. Senate
Civil Beat Oct. 23 Poll - Governor and U.S. Senate
 
Hi general election issues poll results
Hi general election issues poll resultsHi general election issues poll results
Hi general election issues poll results
 
Global Horizons Hawaii filing
Global Horizons Hawaii filingGlobal Horizons Hawaii filing
Global Horizons Hawaii filing
 
Feb 2011 letter re new developments final
Feb 2011 letter re new developments finalFeb 2011 letter re new developments final
Feb 2011 letter re new developments final
 
Gov. Abercrombie 6/16 budget cuts memo
Gov. Abercrombie 6/16 budget cuts memoGov. Abercrombie 6/16 budget cuts memo
Gov. Abercrombie 6/16 budget cuts memo
 
Abercrombie New Budget
Abercrombie New BudgetAbercrombie New Budget
Abercrombie New Budget
 
Health Department withheld documents
Health Department withheld documentsHealth Department withheld documents
Health Department withheld documents
 
Uh salaries aug 2010
Uh salaries aug 2010Uh salaries aug 2010
Uh salaries aug 2010
 
Judiciary oct 2010
Judiciary oct 2010Judiciary oct 2010
Judiciary oct 2010
 
Legislative agency salaries spring 2011
Legislative agency salaries spring 2011Legislative agency salaries spring 2011
Legislative agency salaries spring 2011
 
ORI Anuenue Hale grant application
ORI Anuenue Hale grant applicationORI Anuenue Hale grant application
ORI Anuenue Hale grant application
 
GamesDeals_SlideShare
GamesDeals_SlideShareGamesDeals_SlideShare
GamesDeals_SlideShare
 
Civil Beat Poll September 2012 voice crosstabs
Civil Beat Poll September 2012 voice crosstabsCivil Beat Poll September 2012 voice crosstabs
Civil Beat Poll September 2012 voice crosstabs
 
ERS Hawaii Q4 2011
ERS Hawaii Q4 2011ERS Hawaii Q4 2011
ERS Hawaii Q4 2011
 
Hawaii ERS quarter ended Sept 30
Hawaii ERS quarter ended Sept 30Hawaii ERS quarter ended Sept 30
Hawaii ERS quarter ended Sept 30
 
Elderts vs Deedy
Elderts vs DeedyElderts vs Deedy
Elderts vs Deedy
 
Green Aloha's response
Green Aloha's responseGreen Aloha's response
Green Aloha's response
 
Unesco Visit Lts Feb 2010
Unesco Visit Lts Feb 2010Unesco Visit Lts Feb 2010
Unesco Visit Lts Feb 2010
 
Phoenix Arizona Real Estate Market
Phoenix Arizona Real Estate MarketPhoenix Arizona Real Estate Market
Phoenix Arizona Real Estate Market
 
Pencil vs Camera (part 1)
Pencil vs Camera (part 1)Pencil vs Camera (part 1)
Pencil vs Camera (part 1)
 

Similar to Hawaii Towns Travel Time

Towns Ranked by High School Grad
Towns Ranked by High School GradTowns Ranked by High School Grad
Towns Ranked by High School GradHonolulu Civil Beat
 
Heartland 2050 meeting 4
Heartland 2050 meeting 4Heartland 2050 meeting 4
Heartland 2050 meeting 4Heartland2050
 
[대학내일20대연구소] 2017 20대 소비&라이프스타일 트렌드 조사 (연구리포트 2017-09)
[대학내일20대연구소] 2017 20대 소비&라이프스타일 트렌드 조사 (연구리포트 2017-09)[대학내일20대연구소] 2017 20대 소비&라이프스타일 트렌드 조사 (연구리포트 2017-09)
[대학내일20대연구소] 2017 20대 소비&라이프스타일 트렌드 조사 (연구리포트 2017-09)20slab(대학내일20대연구소)
 
[대학내일20대연구소] 20대 tv시청행태 및 콘텐츠 이용실태조사 (이슈페이퍼 2016-01)
[대학내일20대연구소] 20대 tv시청행태 및 콘텐츠 이용실태조사 (이슈페이퍼 2016-01)[대학내일20대연구소] 20대 tv시청행태 및 콘텐츠 이용실태조사 (이슈페이퍼 2016-01)
[대학내일20대연구소] 20대 tv시청행태 및 콘텐츠 이용실태조사 (이슈페이퍼 2016-01)20slab(대학내일20대연구소)
 
Mortalidad infantil por provincia 1980-2013
Mortalidad infantil por provincia 1980-2013Mortalidad infantil por provincia 1980-2013
Mortalidad infantil por provincia 1980-2013Eduardo Nelson German
 
[대학내일20대연구소] 2017 20대 전시회/페스티벌 문화 향유 실태 및 트렌드 조사 (연구리포트 2017-12)
[대학내일20대연구소] 2017 20대 전시회/페스티벌 문화 향유 실태 및 트렌드 조사 (연구리포트 2017-12)[대학내일20대연구소] 2017 20대 전시회/페스티벌 문화 향유 실태 및 트렌드 조사 (연구리포트 2017-12)
[대학내일20대연구소] 2017 20대 전시회/페스티벌 문화 향유 실태 및 트렌드 조사 (연구리포트 2017-12)20slab(대학내일20대연구소)
 
Analisis Horta Guinardo 2008 03 10
Analisis Horta Guinardo 2008 03 10Analisis Horta Guinardo 2008 03 10
Analisis Horta Guinardo 2008 03 101977bcn
 
California higher ed where is comes from and where it goes
California higher ed where is comes from and where it goesCalifornia higher ed where is comes from and where it goes
California higher ed where is comes from and where it goesSally Hamilton
 
Tabela de conversao z-dpmo
Tabela de conversao   z-dpmoTabela de conversao   z-dpmo
Tabela de conversao z-dpmoHugo Oliveira
 
Mortgage Brokers Association Data
Mortgage Brokers Association DataMortgage Brokers Association Data
Mortgage Brokers Association DataTom Cryer
 
[대학내일20대연구소] 소셜 V슈머 세대의 영상콘텐츠 소비 실태 (이슈페이퍼 2017-06)
[대학내일20대연구소] 소셜 V슈머 세대의 영상콘텐츠 소비 실태 (이슈페이퍼 2017-06)[대학내일20대연구소] 소셜 V슈머 세대의 영상콘텐츠 소비 실태 (이슈페이퍼 2017-06)
[대학내일20대연구소] 소셜 V슈머 세대의 영상콘텐츠 소비 실태 (이슈페이퍼 2017-06)20slab(대학내일20대연구소)
 

Similar to Hawaii Towns Travel Time (20)

Towns Ranked by High School Grad
Towns Ranked by High School GradTowns Ranked by High School Grad
Towns Ranked by High School Grad
 
Heartland 2050 meeting 4
Heartland 2050 meeting 4Heartland 2050 meeting 4
Heartland 2050 meeting 4
 
Idle Teens 2000-2009
Idle Teens 2000-2009Idle Teens 2000-2009
Idle Teens 2000-2009
 
[대학내일20대연구소] 2017 20대 소비&라이프스타일 트렌드 조사 (연구리포트 2017-09)
[대학내일20대연구소] 2017 20대 소비&라이프스타일 트렌드 조사 (연구리포트 2017-09)[대학내일20대연구소] 2017 20대 소비&라이프스타일 트렌드 조사 (연구리포트 2017-09)
[대학내일20대연구소] 2017 20대 소비&라이프스타일 트렌드 조사 (연구리포트 2017-09)
 
[대학내일20대연구소] 20대 tv시청행태 및 콘텐츠 이용실태조사 (이슈페이퍼 2016-01)
[대학내일20대연구소] 20대 tv시청행태 및 콘텐츠 이용실태조사 (이슈페이퍼 2016-01)[대학내일20대연구소] 20대 tv시청행태 및 콘텐츠 이용실태조사 (이슈페이퍼 2016-01)
[대학내일20대연구소] 20대 tv시청행태 및 콘텐츠 이용실태조사 (이슈페이퍼 2016-01)
 
Turnout
TurnoutTurnout
Turnout
 
Mortalidad infantil por provincia 1980-2013
Mortalidad infantil por provincia 1980-2013Mortalidad infantil por provincia 1980-2013
Mortalidad infantil por provincia 1980-2013
 
NAG_LAL
NAG_LALNAG_LAL
NAG_LAL
 
Turnout
TurnoutTurnout
Turnout
 
Oahu Census Tracts
Oahu Census TractsOahu Census Tracts
Oahu Census Tracts
 
Asignatura
AsignaturaAsignatura
Asignatura
 
Asignatura
AsignaturaAsignatura
Asignatura
 
[대학내일20대연구소] 2017 20대 전시회/페스티벌 문화 향유 실태 및 트렌드 조사 (연구리포트 2017-12)
[대학내일20대연구소] 2017 20대 전시회/페스티벌 문화 향유 실태 및 트렌드 조사 (연구리포트 2017-12)[대학내일20대연구소] 2017 20대 전시회/페스티벌 문화 향유 실태 및 트렌드 조사 (연구리포트 2017-12)
[대학내일20대연구소] 2017 20대 전시회/페스티벌 문화 향유 실태 및 트렌드 조사 (연구리포트 2017-12)
 
Analisis Horta Guinardo 2008 03 10
Analisis Horta Guinardo 2008 03 10Analisis Horta Guinardo 2008 03 10
Analisis Horta Guinardo 2008 03 10
 
California higher ed where is comes from and where it goes
California higher ed where is comes from and where it goesCalifornia higher ed where is comes from and where it goes
California higher ed where is comes from and where it goes
 
Tabela de conversao z-dpmo
Tabela de conversao   z-dpmoTabela de conversao   z-dpmo
Tabela de conversao z-dpmo
 
Correlation and volatility DJ EuroStoxx50 Oct 2014
Correlation and volatility DJ EuroStoxx50 Oct 2014Correlation and volatility DJ EuroStoxx50 Oct 2014
Correlation and volatility DJ EuroStoxx50 Oct 2014
 
Oferta hídrica
Oferta hídricaOferta hídrica
Oferta hídrica
 
Mortgage Brokers Association Data
Mortgage Brokers Association DataMortgage Brokers Association Data
Mortgage Brokers Association Data
 
[대학내일20대연구소] 소셜 V슈머 세대의 영상콘텐츠 소비 실태 (이슈페이퍼 2017-06)
[대학내일20대연구소] 소셜 V슈머 세대의 영상콘텐츠 소비 실태 (이슈페이퍼 2017-06)[대학내일20대연구소] 소셜 V슈머 세대의 영상콘텐츠 소비 실태 (이슈페이퍼 2017-06)
[대학내일20대연구소] 소셜 V슈머 세대의 영상콘텐츠 소비 실태 (이슈페이퍼 2017-06)
 

More from Honolulu Civil Beat

Gov. David Ige response to U.S. Rep. Anna Eshoo
Gov. David Ige response to U.S. Rep. Anna EshooGov. David Ige response to U.S. Rep. Anna Eshoo
Gov. David Ige response to U.S. Rep. Anna EshooHonolulu Civil Beat
 
Audit of the Department of the Honolulu Prosecuting Attorney’s Policies, Proc...
Audit of the Department of the Honolulu Prosecuting Attorney’s Policies, Proc...Audit of the Department of the Honolulu Prosecuting Attorney’s Policies, Proc...
Audit of the Department of the Honolulu Prosecuting Attorney’s Policies, Proc...Honolulu Civil Beat
 
Audit of the Honolulu Police Department’s Policies, Procedures, and Controls
Audit of the Honolulu Police Department’s Policies, Procedures, and ControlsAudit of the Honolulu Police Department’s Policies, Procedures, and Controls
Audit of the Honolulu Police Department’s Policies, Procedures, and ControlsHonolulu Civil Beat
 
2019 Use of Force Annual Report HPD
2019 Use of Force Annual Report HPD 2019 Use of Force Annual Report HPD
2019 Use of Force Annual Report HPD Honolulu Civil Beat
 
Office of Health Equity Goals Draft 10
Office of Health Equity Goals Draft 10Office of Health Equity Goals Draft 10
Office of Health Equity Goals Draft 10Honolulu Civil Beat
 
ACLU Letter to HPD regarding racial profiling
ACLU Letter to HPD regarding racial profilingACLU Letter to HPD regarding racial profiling
ACLU Letter to HPD regarding racial profilingHonolulu Civil Beat
 
ACLU Letter to HPD regarding racial profiling
ACLU Letter to HPD regarding racial profilingACLU Letter to HPD regarding racial profiling
ACLU Letter to HPD regarding racial profilingHonolulu Civil Beat
 
Guam Governor's Letter to Pence
Guam Governor's Letter to Pence Guam Governor's Letter to Pence
Guam Governor's Letter to Pence Honolulu Civil Beat
 
List Of Pro Bono Legal Service Providers
List Of Pro Bono Legal Service ProvidersList Of Pro Bono Legal Service Providers
List Of Pro Bono Legal Service ProvidersHonolulu Civil Beat
 
Arbitration Hearing Transcript December 2018
Arbitration Hearing Transcript December 2018Arbitration Hearing Transcript December 2018
Arbitration Hearing Transcript December 2018Honolulu Civil Beat
 

More from Honolulu Civil Beat (20)

Gov. David Ige response to U.S. Rep. Anna Eshoo
Gov. David Ige response to U.S. Rep. Anna EshooGov. David Ige response to U.S. Rep. Anna Eshoo
Gov. David Ige response to U.S. Rep. Anna Eshoo
 
Audit of the Department of the Honolulu Prosecuting Attorney’s Policies, Proc...
Audit of the Department of the Honolulu Prosecuting Attorney’s Policies, Proc...Audit of the Department of the Honolulu Prosecuting Attorney’s Policies, Proc...
Audit of the Department of the Honolulu Prosecuting Attorney’s Policies, Proc...
 
Audit of the Honolulu Police Department’s Policies, Procedures, and Controls
Audit of the Honolulu Police Department’s Policies, Procedures, and ControlsAudit of the Honolulu Police Department’s Policies, Procedures, and Controls
Audit of the Honolulu Police Department’s Policies, Procedures, and Controls
 
2019 Use of Force Annual Report HPD
2019 Use of Force Annual Report HPD 2019 Use of Force Annual Report HPD
2019 Use of Force Annual Report HPD
 
Office of Health Equity Goals Draft 10
Office of Health Equity Goals Draft 10Office of Health Equity Goals Draft 10
Office of Health Equity Goals Draft 10
 
NHPI COVID-19 Statement
NHPI COVID-19 StatementNHPI COVID-19 Statement
NHPI COVID-19 Statement
 
DLIR Response Language Access
DLIR Response Language AccessDLIR Response Language Access
DLIR Response Language Access
 
Language Access Letter To DLIR
Language Access Letter To DLIRLanguage Access Letter To DLIR
Language Access Letter To DLIR
 
ACLU Letter to HPD regarding racial profiling
ACLU Letter to HPD regarding racial profilingACLU Letter to HPD regarding racial profiling
ACLU Letter to HPD regarding racial profiling
 
ACLU Letter to HPD regarding racial profiling
ACLU Letter to HPD regarding racial profilingACLU Letter to HPD regarding racial profiling
ACLU Letter to HPD regarding racial profiling
 
Jane Doe v. Rehab Hospital
Jane Doe v. Rehab HospitalJane Doe v. Rehab Hospital
Jane Doe v. Rehab Hospital
 
Coronavirus HPHA
Coronavirus HPHA Coronavirus HPHA
Coronavirus HPHA
 
OHA Data Request
OHA Data RequestOHA Data Request
OHA Data Request
 
Letter from Palau to Guam
Letter from Palau to GuamLetter from Palau to Guam
Letter from Palau to Guam
 
Guam Governor's Letter to Pence
Guam Governor's Letter to Pence Guam Governor's Letter to Pence
Guam Governor's Letter to Pence
 
OHA Analysis by Akina
OHA Analysis by AkinaOHA Analysis by Akina
OHA Analysis by Akina
 
Case COFA Letter
Case COFA LetterCase COFA Letter
Case COFA Letter
 
List Of Pro Bono Legal Service Providers
List Of Pro Bono Legal Service ProvidersList Of Pro Bono Legal Service Providers
List Of Pro Bono Legal Service Providers
 
Arbitration Hearing Transcript December 2018
Arbitration Hearing Transcript December 2018Arbitration Hearing Transcript December 2018
Arbitration Hearing Transcript December 2018
 
Caldwell Press Release
Caldwell Press ReleaseCaldwell Press Release
Caldwell Press Release
 

Hawaii Towns Travel Time

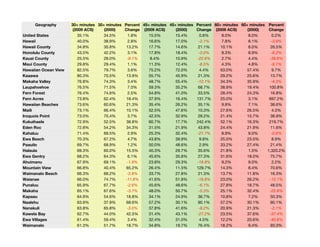
  • 1. Geography 30+ minutes 30+ minutes Percent 45+ minutes 45+ minutes Percent 60+ minutes 60+ minutes Percent (2009 ACS) (2000) Change (2009 ACS) (2000) Change (2009 ACS) (2000) Change United States 35.1% 34.5% 1.8% 15.5% 15.4% 0.6% 8.0% 8.0% 0.2% Hawaii 40.0% 38.9% 2.8% 16.6% 17.0% -2.1% 7.8% 8.1% -3.9% Hawaii County 34.8% 30.8% 13.2% 17.7% 14.6% 21.1% 10.1% 8.0% 26.5% Honolulu County 43.5% 42.2% 3.1% 17.8% 18.4% -3.0% 8.3% 8.9% -6.2% Kauai County 25.5% 28.0% -9.1% 8.4% 10.9% -22.6% 2.7% 4.4% -38.6% Maui County 29.8% 29.4% 1.1% 11.3% 12.4% -8.5% 4.3% 4.8% -9.1% Hawaiian Ocean View 82.5% 79.7% 3.6% 75.2% 72.0% 4.4% 63.0% 57.4% 9.7% Kaaawa 80.3% 70.5% 13.9% 55.7% 45.9% 21.3% 29.2% 25.6% 13.7% Makaha Valley 76.8% 74.3% 3.4% 48.7% 55.4% -12.1% 34.3% 35.9% -4.3% Laupahoehoe 76.5% 71.5% 7.0% 59.3% 35.2% 68.7% 38.9% 19.4% 100.8% Fern Forest 76.4% 74.6% 2.5% 54.8% 41.0% 33.5% 28.4% 24.3% 16.8% Fern Acres 73.8% 62.4% 18.4% 37.9% 16.4% 131.7% 25.0% 3.1% 697.2% Hawaiian Beaches 73.6% 60.6% 21.3% 35.4% 26.2% 35.1% 9.8% 7.1% 38.6% Maili 73.1% 66.4% 10.1% 52.5% 47.6% 10.3% 27.6% 26.5% 4.3% Iroquois Point 73.0% 70.4% 3.7% 42.5% 32.9% 29.2% 21.4% 15.7% 36.9% Kukuihaele 72.9% 52.5% 38.8% 60.7% 17.7% 242.4% 52.1% 16.3% 219.7% Eden Roc 72.8% 54.2% 34.3% 31.5% 21.9% 43.8% 24.4% 21.9% 11.6% Kahaluu 71.4% 69.5% 2.9% 25.3% 32.4% -21.7% 8.9% 9.0% -0.6% Ewa Beach 70.3% 67.2% 4.7% 43.8% 39.9% 9.8% 25.0% 23.0% 8.9% Paauilo 69.7% 68.9% 1.2% 50.0% 48.6% 2.9% 33.2% 27.4% 21.4% Halaula 69.3% 60.0% 15.5% 40.3% 29.7% 35.6% 21.8% 1.5% 1,320.2% Ewa Gentry 68.2% 64.3% 6.1% 45.6% 35.8% 27.3% 31.6% 18.0% 75.7% Ahuimanu 67.9% 69.1% -1.8% 23.8% 29.3% -18.8% 9.2% 9.0% 2.2% Mountain View 66.8% 40.4% 65.2% 26.4% 11.5% 129.7% 14.3% 8.4% 70.6% Waimanalo Beach 66.3% 68.2% -2.8% 33.7% 27.8% 21.3% 13.7% 11.8% 16.3% Waianae 66.0% 74.7% -11.6% 41.6% 51.8% -19.8% 23.0% 26.2% -12.1% Punaluu 65.9% 67.7% -2.6% 45.6% 48.6% -6.1% 27.8% 18.7% 48.5% Makaha 65.1% 67.6% -3.7% 48.0% 50.7% -5.3% 25.1% 32.4% -22.6% Kapaau 64.9% 54.6% 18.8% 34.1% 24.9% 36.7% 10.8% 7.2% 50.3% Naalehu 63.9% 37.9% 68.6% 57.2% 30.1% 90.1% 57.2% 30.1% 90.1% Nanakuli 63.8% 65.8% -3.0% 37.8% 41.6% -9.2% 20.9% 21.3% -2.1% Kawela Bay 62.7% 44.0% 42.5% 31.4% 43.1% -27.2% 23.5% 37.6% -37.4% Ewa Villages 61.4% 59.4% 3.4% 32.4% 31.0% 4.5% 12.2% 20.6% -40.6% Waimanalo 61.3% 51.7% 18.7% 34.8% 19.7% 76.4% 18.2% 9.4% 93.3%
  • 2. Geography 30+ minutes 30+ minutes Percent 45+ minutes 45+ minutes Percent 60+ minutes 60+ minutes Percent (2009 ACS) (2000) Change (2009 ACS) (2000) Change (2009 ACS) (2000) Change Ainaloa 61.3% 63.8% -4.0% 35.0% 22.4% 56.0% 20.2% 12.0% 68.9% Honokaa 60.7% 52.4% 15.9% 45.7% 37.5% 21.8% 25.6% 12.7% 101.1% Hawi 60.3% 63.9% -5.6% 32.2% 35.0% -7.9% 13.8% 8.6% 60.4% Waikane 60.1% 71.7% -16.2% 16.6% 21.5% -22.8% 7.1% 6.5% 9.6% Makakilo City 59.3% 58.9% 0.6% 29.1% 31.7% -8.1% 13.6% 16.0% -15.4% Honaunau-Napoopoo 59.0% 49.2% 20.0% 41.2% 20.6% 100.2% 21.9% 9.1% 140.5% Leilani Estates 58.6% 50.6% 15.9% 30.0% 16.6% 80.6% 13.3% 11.6% 15.2% Haiku-Pauwela 56.6% 56.1% 0.9% 20.5% 19.1% 7.2% 7.5% 10.8% -29.8% Hawaiian Acres 56.5% 58.3% -3.2% 21.0% 28.4% -26.2% 8.4% 18.5% -54.6% Waialua 56.0% 53.4% 5.0% 28.7% 32.5% -11.5% 11.5% 16.9% -32.0% Village Park 54.9% 57.0% -3.6% 25.5% 25.5% 0.1% 15.0% 13.7% 9.2% Mililani Town 54.4% 50.5% 7.7% 23.9% 22.9% 4.2% 13.2% 10.8% 23.0% Kailua (Honolulu) 54.0% 56.7% -4.7% 16.9% 17.7% -4.2% 6.1% 6.5% -7.6% Mokuleia 53.6% 49.7% 8.0% 34.3% 34.9% -1.7% 14.1% 19.5% -27.6% Hauula 53.0% 59.0% -10.1% 45.1% 43.5% 3.7% 32.2% 29.8% 8.0% Waipahu 52.6% 55.1% -4.4% 25.0% 28.9% -13.4% 13.7% 14.7% -6.7% Nanawale Estates 52.3% 64.6% -19.1% 33.9% 26.5% 27.8% 25.6% 10.9% 135.2% Volcano 52.1% 50.8% 2.5% 19.4% 26.1% -25.4% 4.4% 7.0% -37.4% Hawaiian Paradise Park 51.9% 42.0% 23.7% 17.5% 12.9% 36.0% 5.1% 6.9% -25.7% Pahoa 50.9% 43.1% 18.2% 22.1% 13.8% 60.0% 20.3% 6.4% 218.1% Heeia 48.9% 52.9% -7.5% 18.8% 17.8% 5.2% 3.9% 5.4% -28.0% Maunawili 48.5% 55.2% -12.2% 14.7% 15.5% -5.2% 6.6% 5.1% 28.2% Hanapepe 48.2% 36.6% 31.9% 15.3% 15.9% -4.2% 3.7% 4.4% -15.7% Whitmore Village 47.9% 47.4% 1.1% 20.7% 25.8% -20.0% 7.3% 11.5% -36.7% Pupukea 47.2% 67.8% -30.4% 28.1% 48.1% -41.7% 21.8% 28.2% -22.8% Captain Cook 46.9% 39.6% 18.5% 19.4% 11.8% 64.0% 13.1% 5.6% 134.8% Wahiawa 46.2% 51.9% -10.9% 25.1% 27.3% -7.9% 12.3% 13.7% -10.1% Waipio 45.7% 51.4% -11.2% 19.1% 28.1% -32.0% 10.0% 13.0% -22.7% Kaneohe 45.4% 49.9% -8.9% 13.6% 16.6% -18.2% 6.3% 7.0% -10.3% Waipio Acres 44.1% 48.6% -9.2% 21.1% 22.2% -4.7% 11.0% 11.4% -3.3% Pearl City 43.6% 41.1% 6.0% 17.0% 19.9% -14.4% 7.9% 9.2% -14.2% Waimea (Big Island) 43.4% 40.1% 8.4% 30.9% 20.0% 54.8% 15.6% 8.5% 82.9% Aiea 42.8% 37.7% 13.7% 12.3% 15.6% -21.4% 7.0% 5.6% 25.8% Maunaloa 42.4% 12.2% 248.8% 25.3% 2.7% 834.3% 25.3% 0.0% N/A
  • 3. Geography 30+ minutes 30+ minutes Percent 45+ minutes 45+ minutes Percent 60+ minutes 60+ minutes Percent (2009 ACS) (2000) Change (2009 ACS) (2000) Change (2009 ACS) (2000) Change Waimalu 41.6% 42.5% -2.1% 16.7% 19.4% -13.8% 7.4% 9.1% -19.2% Orchidlands Estates 40.9% 50.5% -19.0% 16.5% 12.0% 37.1% 10.4% 4.9% 111.3% Kahuku 40.9% 37.4% 9.3% 32.6% 31.1% 4.7% 24.3% 22.4% 8.7% Pahala 40.0% 33.9% 18.1% 20.1% 24.7% -18.4% 14.1% 18.9% -25.2% Waikoloa Village 39.8% 31.9% 24.7% 14.5% 12.8% 13.1% 5.8% 4.3% 35.0% Makawao 39.2% 43.0% -8.6% 8.5% 16.7% -49.0% 3.1% 8.3% -62.3% Kekaha 39.2% 44.1% -11.2% 19.8% 28.6% -30.7% 9.0% 10.2% -12.0% Pukalani 39.2% 27.8% 41.0% 21.2% 10.8% 95.6% 12.6% 2.2% 479.1% Haleiwa 38.9% 56.8% -31.5% 21.4% 38.6% -44.6% 10.6% 17.7% -40.1% Barbers Point Housing 38.7% 29.2% 32.7% 22.6% 0.0% N/A 6.5% 0.0% N/A Honalo 38.1% 25.9% 46.9% 10.7% 12.8% -16.6% 3.4% 7.3% -53.4% Honomu 38.1% 32.9% 15.6% 16.4% 6.9% 136.5% 8.5% 4.6% 83.1% Kealakekua 37.9% 30.5% 24.4% 12.8% 7.5% 70.0% 6.9% 4.7% 48.3% Kaumakani 37.4% 30.5% 22.7% 5.6% 5.5% 2.1% 0.0% 0.0% N/A Pakala Village 37.4% 20.9% 78.6% 8.7% 5.4% 60.2% 2.6% 0.8% 236.5% Wailea-Makena 36.8% 27.7% 32.9% 12.6% 12.4% 1.2% 6.5% 4.1% 57.7% Halawa 35.1% 39.5% -11.0% 13.9% 16.0% -12.8% 4.3% 6.5% -34.2% Lawai 35.0% 26.6% 31.6% 8.3% 7.4% 11.9% 5.8% 3.2% 81.9% Honolulu 34.9% 31.6% 10.4% 9.5% 10.0% -4.8% 3.6% 4.6% -21.3% Kalaheo 34.9% 33.8% 3.3% 11.1% 6.1% 82.1% 0.0% 3.5% -100.0% Anahola 34.7% 52.5% -33.9% 8.7% 17.0% -49.1% 3.1% 8.4% -63.5% Waikapu 33.0% 30.5% 8.0% 15.8% 11.5% 37.7% 5.0% 4.0% 25.9% Waimea (Kauai) 32.7% 33.6% -2.7% 13.3% 14.9% -10.6% 5.2% 3.7% 39.2% Kurtistown 32.5% 32.6% -0.4% 8.1% 7.1% 14.4% 2.8% 4.0% -30.4% Pepeekeo 32.3% 28.5% 13.4% 17.4% 11.2% 55.1% 10.1% 8.4% 20.0% Haliimaile 31.9% 35.8% -10.8% 11.7% 14.8% -20.7% 4.0% 6.8% -41.6% Wheeler AFB 31.6% 16.0% 96.9% 8.4% 9.0% -6.8% 2.5% 5.1% -49.7% Paia 31.4% 32.9% -4.3% 13.6% 12.9% 5.5% 6.2% 7.3% -15.1% Eleele 31.2% 45.5% -31.5% 11.5% 14.1% -18.2% 0.0% 6.6% -100.0% Kahului 31.0% 27.9% 11.3% 12.5% 13.2% -5.2% 4.7% 4.1% 16.7% Waihee-Waiehu 30.7% 37.2% -17.7% 16.0% 15.9% 1.2% 3.7% 4.4% -15.5% Wailua Homesteads 29.9% 28.1% 6.7% 11.5% 12.4% -6.9% 5.0% 4.7% 7.3% Kahaluu-Keauhou 29.3% 17.2% 71.0% 9.0% 6.0% 50.5% 5.0% 4.9% 3.7% Kapaa 29.0% 32.2% -10.0% 8.6% 11.1% -22.4% 2.1% 2.7% -24.4%
  • 4. Geography 30+ minutes 30+ minutes Percent 45+ minutes 45+ minutes Percent 60+ minutes 60+ minutes Percent (2009 ACS) (2000) Change (2009 ACS) (2000) Change (2009 ACS) (2000) Change Kihei 28.2% 24.6% 14.5% 8.4% 10.8% -22.6% 2.6% 3.8% -31.5% Kalaoa 27.5% 24.4% 12.5% 7.2% 5.2% 37.5% 5.5% 3.1% 78.9% Paukaa 26.4% 14.2% 85.9% 9.0% 10.8% -16.7% 6.7% 8.5% -20.9% Keaau 25.7% 18.0% 42.6% 16.3% 8.6% 88.8% 13.5% 5.5% 144.9% Maalaea 25.6% 33.5% -23.6% 0.0% 13.2% -100.0% 0.0% 6.6% -100.0% Wainaku 24.1% 14.2% 69.6% 12.7% 10.9% 15.8% 8.2% 7.9% 4.4% Puako 23.5% 19.3% 21.6% 13.1% 9.0% 46.1% 9.5% 8.5% 12.2% Papaikou 23.3% 22.8% 2.1% 9.3% 11.8% -21.2% 6.2% 8.3% -25.6% Omao 22.9% 16.1% 42.2% 7.1% 7.2% -0.5% 2.9% 3.4% -13.7% Kailua (Big Island) 22.9% 18.9% 20.8% 4.7% 7.0% -33.8% 1.8% 3.8% -53.2% Holualoa 22.3% 20.9% 6.7% 11.6% 10.2% 14.1% 5.7% 4.8% 18.5% Wailuku 22.2% 29.2% -24.0% 8.0% 13.4% -40.2% 3.2% 4.3% -24.3% Princeville 21.6% 34.2% -36.8% 12.7% 15.9% -20.1% 3.3% 10.1% -67.7% Wailua 20.5% 18.5% 11.1% 4.9% 4.4% 11.7% 1.3% 2.0% -34.6% Koloa 18.7% 24.9% -24.9% 4.7% 5.9% -20.0% 2.9% 3.5% -17.7% Laie 18.7% 20.0% -6.2% 16.3% 17.7% -7.4% 13.5% 13.6% -0.7% Kilauea 17.8% 23.0% -22.6% 10.6% 9.7% 9.0% 2.5% 4.7% -47.3% Poipu 17.3% 20.8% -16.7% 2.1% 6.8% -69.4% 1.4% 1.6% -15.8% Hanamaulu 16.6% 17.9% -7.0% 6.3% 10.1% -37.6% 2.4% 3.3% -26.7% Hickam Housing 14.4% 11.3% 27.2% 2.6% 4.4% -41.8% 0.4% 1.8% -79.2% Kaanapali 14.4% 19.5% -26.5% 11.1% 13.9% -19.9% 2.0% 4.8% -58.3% Kaunakakai 14.3% 21.4% -33.0% 5.6% 8.0% -30.2% 0.8% 3.7% -79.1% Hilo 14.0% 11.7% 19.7% 7.8% 7.1% 9.8% 5.7% 5.4% 6.4% Kualapuu 11.4% 19.7% -42.2% 9.3% 6.6% 40.7% 6.6% 4.5% 46.0% Kaneohe Station 11.1% 10.8% 2.2% 2.2% 4.5% -51.0% 0.2% 2.3% -93.0% Kalihiwai 11.1% 19.7% -43.6% 7.5% 11.9% -36.5% 1.9% 5.1% -63.0% Lihue 10.6% 13.7% -22.6% 2.7% 5.2% -47.9% 1.5% 3.1% -51.2% Kapalua 10.6% 29.5% -64.2% 1.4% 12.8% -89.0% 1.4% 7.7% -81.7% Puhi 10.2% 17.6% -42.3% 2.7% 6.9% -61.1% 1.3% 5.5% -75.7% Napili-Honokowai 10.1% 15.5% -34.8% 5.2% 6.3% -17.8% 1.9% 4.2% -54.5% Schofield Barracks 8.7% 7.7% 13.0% 3.7% 3.9% -6.2% 1.6% 2.2% -27.9% Lahaina 8.7% 11.8% -26.2% 2.4% 3.6% -34.6% 0.2% 1.2% -80.3% Hanalei 7.2% 17.8% -59.5% 0.7% 11.4% -94.2% 0.0% 7.9% -100.0% Hana 6.9% 7.7% -10.4% 4.2% 6.0% -30.0% 1.9% 5.3% -64.2%
  • 5. Geography 30+ minutes 30+ minutes Percent 45+ minutes 45+ minutes Percent 60+ minutes 60+ minutes Percent (2009 ACS) (2000) Change (2009 ACS) (2000) Change (2009 ACS) (2000) Change Lanai City 3.6% 7.9% -54.5% 0.6% 2.8% -77.1% 0.6% 2.0% -67.7%