Weitere ähnliche Inhalte
Ähnlich wie 1 56183-568-4 39
Ähnlich wie 1 56183-568-4 39 (20)
Kürzlich hochgeladen (20)
1 56183-568-4 39
- 1. UNIT
3 Microeconomics LESSON 3 I ACTIVITY 30
Long-Run Average Cost Curves
The cost curves that we used in previous activities are short-run cost curves. In the short run, firms
can vary output but not plant capacity. Here, we turn to the long run, defined as a time period in
which the firm can vary its plant capacity and its output. In the short run, the shapes of the average
and marginal cost curves result from diminishing marginal productivity of the resources. In the long
run, the shape of the average cost curve results from economies and diseconomies of scale. Sources of
economies of scale are specialization of resources, more efficient uses of equipment, a reduction in
per-unit costs of factor inputs, an effective use of production by-products and an increase in shared
facilities. Sources of diseconomies of scale are limitations on management decision making and com-
petition for factor inputs.
Part A
Use Figure 30.1 to answer the following questions.
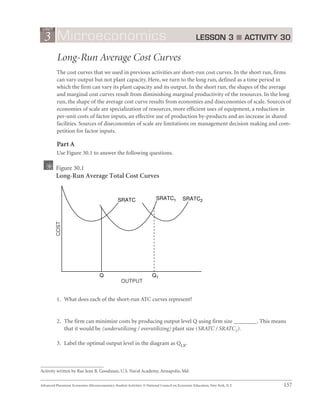
Figure 30.1
Long-Run Average Total Cost Curves
SRATC SRATC1 SRATC2
COST
Q Q1
OUTPUT
1. What does each of the short-run ATC curves represent?
2. The firm can minimize costs by producing output level Q using firm size ________. This means
that it would be (underutilizing / overutilizing) plant size (SRATC / SRATC1).
3. Label the optimal output level in the diagram as QLR.
Activity written by Rae Jean B. Goodman, U.S. Naval Academy, Annapolis, Md.
Advanced Placement Economics Microeconomics: Student Activities © National Council on Economic Education, New York, N.Y. 157
- 2. UNIT
3 Microeconomics LESSON 3 I ACTIVITY 30 (continued)
4. To produce output level Q1, the firm should use plant size ________. This means that it would be
(underutilizing / overutilizing) plant size (SRATC1 / SRATC2).
5. Draw in the long-run average total cost curve and indicate its tangency points with each short-run
ATC curve. Label the curve LRATC.
6. The firm experiences (economies / diseconomies) of scale up to output level __________ and
(economies / diseconomies) of scale beyond output level ________.
Part B
7. In the space below, draw the long-run average total cost curve for a firm experiencing constant
returns to scale. Explain your diagram. Give an example of a type of firm that experiences
constant returns to scale.
8. In the space below, draw the long-run average total cost curve for a firm experiencing decreasing
returns to scale. Explain your diagram. Give an example of a type of firm that experiences
decreasing returns to scale.
158 Advanced Placement Economics Microeconomics: Student Activities © National Council on Economic Education, New York, N.Y.
- 3. UNIT
3 Microeconomics LESSON 3 I ACTIVITY 30 (continued)
9. In the space below, draw the long-run average total cost curve for a firm experiencing increasing
returns to scale. Explain your diagram. Give an example of a type of firm that experiences
increasing returns to scale.
Part C
Indicate whether you think the following statements are true, false or uncertain. Explain why.
10. In the long run, a cost-minimizing firm will overutilize its plant when it produces at an output
level greater than the optimal level.
11. The short-run average total cost curve declines and then increases as a factor input increases
because of economies and diseconomies of scale.
Advanced Placement Economics Microeconomics: Student Activities © National Council on Economic Education, New York, N.Y. 159