Sustainable Energy Policies Evaluation of Thailand
•
0 likes•731 views

Prepared in the year 2008.

Recommended
Recommended
More Related Content
Similar to Sustainable Energy Policies Evaluation of Thailand
Similar to Sustainable Energy Policies Evaluation of Thailand (20)
More from Dr.Choen Krainara
More from Dr.Choen Krainara (20)
Sustainable Energy Policies Evaluation of Thailand
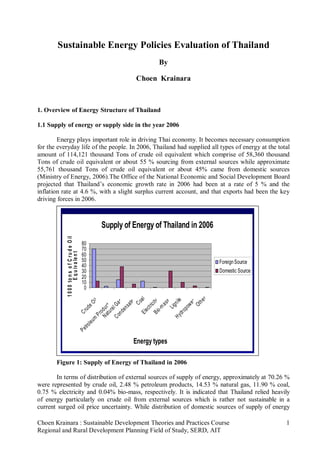
- 1. Sustainable Energy Policies Evaluation of Thailand By Choen Krainara 1. Overview of Energy Structure of Thailand 1.1 Supply of energy or supply side in the year 2006 Energy plays important role in driving Thai economy. It becomes necessary consumption for the everyday life of the people. In 2006, Thailand had supplied all types of energy at the total amount of 114,121 thousand Tons of crude oil equivalent which comprise of 58,360 thousand Tons of crude oil equivalent or about 55 % sourcing from external sources while approximate 55,761 thousand Tons of crude oil equivalent or about 45% came from domestic sources (Ministry of Energy, 2006).The Office of the National Economic and Social Development Board projected that Thailand’s economic growth rate in 2006 had been at a rate of 5 % and the inflation rate at 4.6 %, with a slight surplus current account, and that exports had been the key driving forces in 2006. Supply of Energy of Thailand in 2006 1 0 0 0 to n s o f C r u d e O il 80 70 E q u iv a le n t 60 50 Foreign Source 40 30 Domestic Source 20 10 0 r al e he il B io i ty s s er Co te n il eO as C o l Ga Ot t u ts ic sa ow L ig ct r N a uc -m ud en op ra od E le Cr nd dr Pr Hy m leu tr o Pe Energy types Figure 1: Supply of Energy of Thailand in 2006 In terms of distribution of external sources of supply of energy, approximately at 70.26 % were represented by crude oil, 2.48 % petroleum products, 14.53 % natural gas, 11.90 % coal, 0.75 % electricity and 0.04% bio-mass, respectively. It is indicated that Thailand relied heavily of energy particularly on crude oil from external sources which is rather not sustainable in a current surged oil price uncertainty. While distribution of domestic sources of supply of energy Choen Krainara : Sustainable Development Theories and Practices Course 1 Regional and Rural Development Planning Field of Study, SERD, AIT
- 2. comprised of 37.84 % natural gas, 6.57 % condensate, 11.52 % crude oil, 9.84 % lignite, 3.22 % hydropower, 30.36 % biogas and 0.62 % for others, respectively. It is a prospect that Thailand can expand more energy diversifications from domestic sources especially on natural gas, bio-gas and hydropower which are leading towards clean and sustainable energy development. Regarding (Net) import of primary commercial energy was at 978 KBD of crude oil equivalent, a decrease of 0.2% from the previous year. Due to the increase in the export petroleum products by 78.8%, the ratio of energy import to consumption decreased from 64% in 2005 to 63 % in 2006. Although the volume of energy import increased, the total expenditure on imported energy still increased, resulting from very high crude oil prices in the world market in 2006. The total value of imported energy was, therefore, 919,144 Million Baht. The total volume had increased at 16.9 % when compared with that in 2005 in which such import accounted for approximately 15% of GDP, (Ministry of Energy, 2006). As a result of this, Thailand has been facing challenges on how to stabilize balance of payments due to high while continuing overall economic growth is developed in a sustainable development manner. Value of Energy Import 1000000 900000 800000 Crude Oil M illio n B a h t 700000 Petroleum Products 600000 Natural Gas 500000 Coal 400000 Electricity 300000 Total 200000 100000 0 2001 2002 2003 2004 2005 2006 Year Figure 2: Value of Energy Import 1.2 Demand of energy or demand side in the year 2006 In 2006, all types of total energy consumption were amounted at 63,180 thousand Tons of crude oil equivalent breaking down into 38% using as fuel for industrial development, 36% in transportation sector, 14% in household sector, 6% in businesses sector, 5% in agricultural sector and 1 % in others e.g. quarrying and construction, respectively. (Please see details in Figure 2). Average prices of major fuel products have also been increasing for 50 % from 2002 to 2006 except for NGV which remains rather constant. Whereas energy use efficiency is lowest in transportation sector. For the trend in 2007, demand for Gasoline and Diesel will be increased and some car users may divert toward energy substitution e.g. LPG and NGV. Thailand again has been confronting with the risk of energy price instability. This implies that Thailand should better improve energy utilization efficiency in almost major consumption sectors in order to Choen Krainara : Sustainable Development Theories and Practices Course 2 Regional and Rural Development Planning Field of Study, SERD, AIT
- 3. sustain continued economic growth while also help improve cleaner environment as well as wisely using natural resources. Energy Consumption by Sectors 70000 Industrial 60000 1 00 0 T o n s o f C ru d e O il E q u ip v a le n t Agricultural 50000 Transport 40000 Business 30000 Household 20000 Quarraying and 10000 Construction Total 0 2002 2003 2004 2005 2006 Year Figure 3: Energy Consumption by Sectors 2. Thailand Sustainable Energy Policy Analyses for the Year 2003-2006 2.1 The Context of National Energy Polices As illustrated above, the energy sector has been currently undergoing in transition. It is necessary to deepen our insight on what were the key chronological development and focus of energy policies in Thailand for the past 4 years so that such evaluation of extent of sustainable energy development can be taken place. Previously, Thailand had formulated national energy policies corresponding with the Five Years National Economic and Social Development Plans. But this study will focus the time duration for the year 2003-2006 as time series data due to there were crucial shifts of policy elements. It should be noted that the key context of energy policies statements were mainly covered national energy strategies formulated in 2003 complemented with respective annual energy policies which were increasingly become importantly periodical adjustments when Thailand facing surge of oil prices in the global market. The key components of these policies are as follows: 1) Energy Strategies: Energy for National Competiveness of Thailand, 2003-2005, (Office of Energy Policy and Planning, 2003) The necessary to formulate the energy strategies were to strengthen national energy security as well as promoting global competiveness. As a result, Thailand needs to firstly utilize energy efficiently, accelerate development of potential domestic renewable energy to substitute fossil fuels which were limited reserve including wisely management of existing energy resources for long-term utilization. The strategies comprised of 4 key aspects as follows: Choen Krainara : Sustainable Development Theories and Practices Course 3 Regional and Rural Development Planning Field of Study, SERD, AIT
- 4. • Efficient utilization of energy. In the past 15 years, energy intensity of Thailand slightly increased while most of developed countries tended to decline. Energy elasticity of Thailand was at 1.4:1 (It represents 1.4 % increase of energy utilization will lead to 1% increase of economic growth; USA had energy elasticity at 0.8:1 and Japan at 0.95:1). In this regard, Thailand set to reduce energy elasticity from 1.4:1 to 1:1 by 2007 by introducing selected measures to reduce energy consumption growth particularly in transport and industrial sectors. This included promoting multimodal transport, modal shift from car to rail mode as well as improving public transport, energy saving car, applying tax and incentives in transport and industry as well as promoting co-generation in industrial estate. • Renewable Energy. Increase renewable energy ratio from 0.5% of primary energy consumption in 2002 to 8 % within the next 8 years. It also supports local participation in owning power plants generated by renewable energy. • Energy Security. Reserve adequate electricity to meet demand with reasonable price structures as well as taking care quality of life and minimize environmental impact to local community. Increase energy reserve to meet future demand from 30 years to 50 years. • Promoting Thailand as energy trading hub in the region. 2) Strategies for Mitigating Energy Crisis of Thailand, 2005 Following to the continued fluctuation of oil prices in 2004, Strategies for Mitigating Energy Crisis of Thailand was made available. It major features covered: • Accelerate utilization of alternative energy to substitute oil as well as promoting efficient use of energy. Its targets were to reduce overall energy consumption from 15% and 20% and in the year 2008 and 2009, respectively. (When the mass transport system is completed.) o Transport sector to be reduced oil consumption by 25% within the year 2009 by using other fuels to substitute oil e.g. NGV, Gasohol, Biodiesel including the improvement of logistics system, public transport and distribution system. o Industrial sector to be reduced oil consumption by 25% within the year 2008 by employing measures to directly stimulate businesses and industry and upholding natural gas to substitute oil particularly for industries which are located along the gas pipeline using Gas District Cooling and Cogeneration. o For Public Sector, immediate energy saving at 10-15% should be taken measuring by key performance indicators. • Sourcing of Energy. For long-term energy security, provisions of energy from neighboring countries e.g. hydropower and natural gas need to be secured. This also including exploring energy from other regions e.g. Middle East and Africa for sale and export back to Thailand. • Added value creation for energy resources. Within 4 years (2005-2008), there will be an investment amounting at 800,000 Million Baht on Biodiesel development and Gasohol Choen Krainara : Sustainable Development Theories and Practices Course 4 Regional and Rural Development Planning Field of Study, SERD, AIT
- 5. which will lead to modernize agricultural sector as well expanding petrochemical industry development for enhancing gas value from the Gulf of Thailand. 3) Policies and Energy Development Plan, 2006 It was taken Principle of Self-Sufficiency Economy of the King as a basis for development. Actually it continued some similar characteristics from the previous plan. It covers both short- term and long-term plans as follows: • Long-term plan (1 year). It was an urgent problem resolve with respect to restructure of energy management system, energy saving, renewable energy, appropriate price structure to promote fair competition, setting Clean Development Mechanism Standard (CDM) as well as promoting private sector and public participation in designing policies and measures on energy including community biodiesel production and utilization. • Long-term plan. Its objective was to lay down a basis for promoting sustainable energy management corresponding with the Principle of Self-Sufficiency Economy by designing measures to secure adequate energy supply and minimize import of energy including promotion of other sources of renewable energy e.g. fuel cell, nuclear, etc. Sustainable energy development to minimize environmental impact from energy business activities, efficient use of energy, fair energy business competition were other key goals. 2.2 Analyses on Extent of Sustainable Energy Policies Thailand has become aware of crucial role play by energy sector. Many efforts have been made to bridge supply of energy with demand for economic growth. It is therefore indispensable to evaluate how far Thailand is approaching in promoting sustainable energy policies. In this regard, SWOT Analysis is adopted. And the analysis is shown below: 1) Strengths • Quick turn towards sustainable energy policies by introducing plans and measures to reduce energy consumption in key sectors was apparent. • Planned improve multimodal transport, modal shift from car to rail mode as well as improving public transport, energy saving car, as well as applying tax and incentives in transport and industry. • Long-term energy planning from diversified resource endowments has been reinforced. • Renewable energy become important components in energy polices supported by measures to promote renewable energy trading, promoting local participation in owning power plants generated by renewable energy. • Efficient use of energy was given high priority with time frame monitoring and evaluation. • Institutional arrangements in terms of laws and regulations to support fair competition in energy business are being put in place. 2) Weaknesses • Social and environmental impacts of energy development projects and energy utilization have given moderate to low priorities. Choen Krainara : Sustainable Development Theories and Practices Course 5 Regional and Rural Development Planning Field of Study, SERD, AIT
- 6. • Lack of integration of health impact assessment into development and expansion of large industrial development projects, e.g. at Mab Ta Phut Industrial Estate • Moderate awareness on capacity building to strengthen access to all types of energy services of the poor. 3) Opportunity • There can help generate livelihood opportunity for the poor in rural areas in taking part of planting biodiesel development projects. • Environmental quality could be improved from extensive use of renewable energy toward cleaner environment and better quality of life of Thai people. 4) Threats • Current, uncertainty of oil prices in the global market may affect economic growth of overall performance of Thai Economy. 2.3 Analyses of Programs and Its Impact When translations of those policies had been or have been made through programs. It is necessary to evaluate its progress and impact. It should be noted that such program may have taken before the study period and might partly contribute the results in the study time duration. There are 3 dimensions of indicators used for programs analyses covering economic, environmental and social aspects as follows: 1) Economic Dimension Energy supply is very important sustainable economic development. While the price of crude oil equivalent continues to rise and is expected to be depleted before the next century, Thailand is now looking for alternative energy, renewable energy and energy saving methods. Energy security is become a serious issue and the country cannot afford to have a shortage or in sufficiency of energy supply. One of the programs the government is to promote the alternative fuels for motor vehicles, for example, gasohol and NGV. The government has used price policy to encourage the use of gasohol and NGV as the prices of the two latter types of fuel are lower than gasoline. The price of gasoline premium or ULG95 in 2007 is 32.89 baht and ULG91 is 31.59 per Litre while the price of gasohol 95, 28.89 baht per Litre, gasohol 91, 28.09 baht per Litre and NGV, 8.50 baht per kilogram. The indicator used to evaluate the program is the rate of the use of gasohol and NGV. Please details in appendices 1-5. According to the annual report 2006 of the Ministry of Energy, the demand for gasohol increased from 12 KBD (thousand barrels per day) to 22 KBD or 89.5 percent in 2005-2006. However because the limited amount of ethanol, the production rate of gasohol remained at 21- 23 KBD in 2006 but is increasing in 2007 as the production of ethanol has increased to meet the demand. As for NGV, amount of vehicles used NGV in 2005 increased to 25,371 or 68.8 percent and the number of service stations opened in that year was 99 but mostly in Bangkok. The high rate of the use of gasohol and NGV would slow down the rising cost rate of transportation which Choen Krainara : Sustainable Development Theories and Practices Course 6 Regional and Rural Development Planning Field of Study, SERD, AIT
- 7. would slow down the rise of inflation and the cost of living. It could be said that the program has a moderate tendency toward sustainability. Another program to be evaluated is the promotion of the use of bio-diesel. Since there is a strong relationship between energy and economy, strategies to diversity energy mix and energy sources by developing renewable energy from indigenous sources for producing liquid fuel called bio-diesel. The indicator is the amount of the consumption compared to the planed target. The Ministry of Energy has set a target for bio-diesel production and consumption to replace 10 percent of total diesel consumption in 2012. It has planned to distribute 5% bio-diesel blending (B5) to 290 service stations throughout the country. Because of the price incentive by setting the price of bio-diesel 0.70 baht per Litre lower than the price of ordinary, the number of service stations which sell bio-diesel is 770 in 2007 and the amount of selling of bio-diesel B5 is almost 2 million Litre per day. Although the production and consumption of bio-diesel are at the initial stage, the high rate of consumption suggests a moderate tendency toward sustainability of the program. 2) Environmental Dimension To evaluate the effectiveness or the impact of the program on environment, such as clean energy use program, we have set up indicators by using air pollution caused by energy consumption. To be more precise the rate of CO2 produced by the energy use is used as an indicator. According to Ministry of Energy in 2002, CO2 emitted by the energy sector was amounted 163,039 (103 tons) and has steadily been increased since then. In 2003 the amount of CO2 emitted was 171,370 and in 2006,188,663. Although Thailand has produced very low rate of greenhouse gases by the world standard or 0.6 percent of the total emission of the greenhouse gases by all the countries, the increasing rate of CO2 produced by the energy sector is a warning sign for the government that a lot more has to be done if it wants to make the clean energy programs more effective. Another indicator is the rate of carbon monoxide or CO. Again according to Ministry of Energy the rate has been steadily increased. In 1999 the amount of CO caused by the energy consumption was 2,722 (103 tons) and in 2003, 2,973 and in 2006, 3,078 (103 tons). Please see details in Appendix 6. Despite the fact the rate of energy consumption both oil and electricity is on the increase due to economic growth as a result of expansion of industry, transportation, and agricultures, and an increase on the rate of air pollution seem to be inevitable, the continuing increasing rate of CO2 and CO emissions as a result of energy use indicates that the clean energy program is still ineffective and weak in tendency toward sustainability. 3) Social Dimension As for the energy use in the social aspect, we can say that Thailand does not have specific programs on heath protection through energy consumption. But the program on the use of unleaded gasoline for motor vehicles and the reduction of sulfur content in diesel with an aim to reduce air pollution can be considered as a program to help reduce heath hazard caused by energy use. The number of the people who suffer with respiratory disease is used as an indicator. Please see details in Appendix 7. According to National Statistic Bureau, between 1991 and Choen Krainara : Sustainable Development Theories and Practices Course 7 Regional and Rural Development Planning Field of Study, SERD, AIT
- 8. 2006, the respiratory disease is the top among all the illness. In Thailand in 1991 the number of people who suffered with the respiratory disease was 38.1 percent of all the patients and the rate continued to increase. In 2001 the rate is 39.9 percent and 2006, 44.3 percent. Although it is true that respiratory illness is caused by various factors such as smoking, dust and unhealthy environment especially in factories, an increasing rate of air pollution caused by energy consumption mentioned earlier is also a cause of this disease. Hence the program is still a long way to go toward reducing this disease and providing healthier environment. The government has been campaigning the efficient use of energy in order to provide knowledge regarding energy saving to the people. This involves a number of programs which leads to a change of habit of the people as consumers. One of the programs is a campaign to use compact fluorescent lamps no.5. It has adopted a slogan “For the Nation, Discard Incandescent Lamps, Use Compact Fluorescent Lamps (CFLs)” The indicator to evaluate the impact of the energy saving campaigning program is the rate of power consumption. As regard the use of CFLs, According to the Electricity Generating Authority of Thailand (EGAT), the use of CFLs is be coming popular as between 1993-2001 the use of CFLs has reduced the rate of power consumption by 57.2 million watt hours, compared to total use of around 100,000 kilo watt hours in 2001 it is expected that the use of CFLs will be increased which would reduce the rate of the power consumption which mean that education and campaigning programs are rather effective. More people are willing to change their habit switching to use CFLs despite the fact the cost for unit is much higher than the incandescent lamps. CFLs cost 80 baht per one lamp while an incandescent lamp cost only 30 baht. Hence the campaign has a moderate tendency toward sustainability. Another social dimension is the gender equity in employment which there are no programs regarding this issue. The indicator employed is the ratio of men to women in the energy sector. Please see details in Appendix 8. According the National Statistic Bureau, the number of employees in the state enterprises and government owned companies in electricity, gas and water supply industries is 76.1 thousands and female employees is only 21.2 thousands. This wide gap between men and women in the energy sector can be explained that most of male employees are technicians, engineers and field workers and female employees are in the accounting, finance and general administration departments. It is not easy to increase the number of female employees since it is still a value of the management not to hire female engineers and technicians because they believe that the jobs for those professional people are not suitable for women. Nevertheless, if the energy policy and programs want to establish social harmony which will make the policy and development sustainable gender equity in employment in this sector must be encouraged. At the moment, because of the gap, the gender equity has a weak tendency toward sustainability. 3. Conclusions Thailand has long been relied mainly on external sources of energy. This leads to huge negative balance of payments. During the study period, Thailand realized that energy is central to contribute to overall economic performance of the country. A quick turn of energy polices a bit an energy saving schemes. All these have shown that it might lead Thailand towards sustainable energy policies economically. On the other hand, social and environmental dimensions are needed to given more serious attention. It is worth mentioning that promoting of biodiesel development projects can also help generate livelihood opportunities to the poor in rural areas. In this regards, Energy is central to sustainable development. Choen Krainara : Sustainable Development Theories and Practices Course 8 Regional and Rural Development Planning Field of Study, SERD, AIT
- 9. In terms of program analyses, it has shown some coherence in translating polices into real action so that energy consumption reduction can be taken place. Again, it has also seen success in implementing economic programs but for social aspect particularly on health needs to be taken care aggressively in order to ensure that human health is protected from environmental impact from such energy development or emissions. Likewise, environmental aspect should also inclusively be careful so that balanced development is upheld for the benefit access to clean environment of all Thai people in society. References Electricity Generating Authority of Thailand, 2006, Report on the Campaign to Use Compact Fluorescent Lamps no.5. Ministry of Energy, 2006, Annual Report 2006, Bangkok Ministry of Public Health, 2006, Annual Report 2006, Bangkok Office of Energy Policy and Planning, 2003, State of Energy Policies and Measures of Thailand, Bangkok Office of Energy Policy and Planning, 2006, Annual Report 2006 Office of the National Economic and Social Development Board (NESDB), 2007, Gross Domestic Product, 2nd Quarter, 2007 Internet website http://www.energy.go.th/moen www.nso.go.th http://www.un.org http://www.undp.org Choen Krainara : Sustainable Development Theories and Practices Course 9 Regional and Rural Development Planning Field of Study, SERD, AIT
- 10. List of Appendices Appendix 1: Comparison of Benzene 91 and Gasohol 91 Consumption Appendix 2: Comparison of Benzene 95 and Gasohol 95 Consumption Choen Krainara : Sustainable Development Theories and Practices Course 10 Regional and Rural Development Planning Field of Study, SERD, AIT
- 11. Appendix 3: Number of stations (2007) Station Country Large Small sellers PTT Wide Sellers Explore and Production Public Company Limited Gasohol95 3,603 3,481 122 1,197 Gasohol 91 700 700 - 273 Biodiesel 774 774 - 175 B5 Appendix 4: Summary of the NGV Promotion Implementation Choen Krainara : Sustainable Development Theories and Practices Course 11 Regional and Rural Development Planning Field of Study, SERD, AIT
- 12. Appendix 5: Promotion of NGV Used in Vehicles Progress Total number Total number in 12 accumulated in months September 2007 (Oct 06-Sept 07) Number of vehicles that 44,657 23,445 use NGV 38,087 18,986 - Benzene 4,612 1,998 - Diesel 1,958 1,861 - NGV (OEM) Number of NGV 183 112 stations Number of provinces 35 21 that provided NGV stations Total sale of NGV 26.9 6,717 MMSCF (MMSCFD) Choen Krainara : Sustainable Development Theories and Practices Course 12 Regional and Rural Development Planning Field of Study, SERD, AIT
- 13. Appendix 6: Estimated Air Pollutant Emissions by Types from Energy Consumption Choen Krainara : Sustainable Development Theories and Practices Course 13 Regional and Rural Development Planning Field of Study, SERD, AIT
- 14. Appendix 7: Percentage of patients separated by diseases (1991-2006) Source: Report on the health survey, National Statistic Bureau Diseases 1991 1992 2001 2003 2004 2005 2006 Respiratory Disease 38.1 45.7 39.6 40.2 44.8 45.0 44.3 Muscle and Tendon 15.7 13.2 14.0 14.9 11.8 12.2 11.4 Disease Digestive Disease 15.4 11.3 10.0 10.3 9.1 9.3 9.4 Heart Disease 3.0 6.6 6.6 6.3 5.2 5.9 6.3 Endocrine Disease 1.4 3.3 4.7 4.4 3.1 4.4 4.1 Infectious Disease 2.2 2.1 1.8 1.3 2.1 1.7 0.9 Urinary Tract Infection 1.4 1.8 1.3 1.3 1.1 0.9 1.0 Disease Allergic Disease 0.7 1.5 1.8 2.1 1.8 1.9 2.3 Mental Illness 0.8 1.3 1.5 1.7 1.6 1.9 2.1 Derma Disease 3.2 1.2 1.5 1.1 1.0 1.2 1.4 Genital Disease 1.4 0.8 0.9 0.9 0.8 0.8 0.7 Choen Krainara : Sustainable Development Theories and Practices Course 14 Regional and Rural Development Planning Field of Study, SERD, AIT
- 15. Appendix 8: EMPLOYED PERSONS BY WORK STATUS, INDUSTRY AND SEX, WHOLE KINGDOM QUARTER 1: 2007, Unit X 1,000 Work Status Own Unpaid Members of Government Private Account Family Producers' Total Employer Employee Employee Worker Worker Cooperatives MALE 19,343.2 829.8 1,713.8 7,675.7 6,927.7 2,166.4 29.8 1. Agriculture, 6,931.1 221.3 86.9 1,237.1 4,118.2 1,265.4 2.3 hunting and forestry 2. Fishing 359.1 11.6 - 98.8 204.0 44.4 0.3 3. Mining and 57.8 4.1 - 47.6 5.3 0.8 - quarrying 4. Manufacturing 2,707.3 113.2 10.0 2,173.3 330.4 75.0 5.5 5. Electricity, gas 79.6 - 76.1 3.4 - - - and water supply 6. Construction 2,070.6 163.6 46.0 1,728.9 91.6 23.7 16.9 7. Wholesale and retail trade, repair of 3,012.3 206.1 1.9 1,165.7 1,142.1 494.9 1.7 motor vehicles motorcycles and personal and household goods 8. Hotel and 856.3 35.4 0.0 234.8 364.6 220.9 0.6 restaurants 9. Transport, storage 920.8 13.2 95.5 331.7 469.4 11.0 0.0 and communication 10. Financial 146.3 1.6 22.7 115.7 5.5 0.8 - intermediation 11. Real estate, renting and business 406.8 38.3 30.5 252.1 75.9 9.6 0.4 activities 12. Public administration and 815.9 - 815.9 - - - - defense, compulsory social security 13. Education 413.7 2.8 354.2 52.6 3.0 1.1 - 14. Health and social 148.2 3.6 104.1 29.4 9.9 1.0 0.2 work 15. Other community, social 344.4 15.1 69.4 133.4 107.1 17.6 1.8 and personal service activity 16. Private households with 33.6 - - 33.6 - - - employed persons 17. Extra-territorial organizations and 1.7 - - 1.7 - - - bodies 18. Unknown 37.5 - 0.7 36.0 0.9 - - FEMALE 15,909.5 258.7 1,381.5 5,877.8 4,267.3 4,099.5 24.8 1. Agriculture, 5,354.7 86.5 28.9 965.7 1,731.0 2,539.2 3.3 hunting and forestry Choen Krainara : Sustainable Development Theories and Practices Course 15 Regional and Rural Development Planning Field of Study, SERD, AIT
- 16. 2. Fishing 102.0 0.7 - 9.9 36.5 54.8 - 3. Mining and 16.1 1.1 - 8.9 1.5 4.6 - quarrying 4. Manufacturing 3,067.9 29.6 10.5 2,347.6 446.2 215.9 18.2 5. Electricity, gas 22.5 - 21.2 1.2 - - - and water supply 6. Construction 370.9 8.2 11.0 320.3 1.5 29.9 - 7. Wholesale and retail trade, repair of motor vehicles 2,707.4 57.8 1.8 805.8 1,058.7 781.4 1.8 motorcycles and personal and household goods 8. Hotel and 1,518.8 45.6 0.3 403.9 674.5 393.2 1.2 restaurants 9. Transport, storage 159.8 2.6 33.4 88.0 25.0 10.8 - and communication 10. Financial 168.9 0.2 22.4 140.8 3.6 1.8 0.1 intermediation 11. Real estate, renting and business 274.5 8.5 21.1 192.2 31.8 20.8 - activities 12. Public administration and 404.3 - 404.3 - - - - defense, compulsory social security 13. Education 614.8 0.5 475.4 133.4 4.7 0.8 - 14. Health and social 456.7 1.6 322.6 101.4 25.9 5.1 0.2 work 15. Other community, social 448.7 15.6 27.6 138.1 226.5 40.9 0.0 and personal service activity 16. Private households with 196.3 - - 196.3 - - - employed persons 17. Extra-territorial organizations and 1.6 - - 1.6 - - - bodies 18. Unknown 24.0 - 1.1 22.5 - 0.3 - Source: The Labor Force Survey Whole Kingdom Quarter 1 January - March 2007, National Statistical Office, Ministry of Information and Communication Technology Choen Krainara : Sustainable Development Theories and Practices Course 16 Regional and Rural Development Planning Field of Study, SERD, AIT