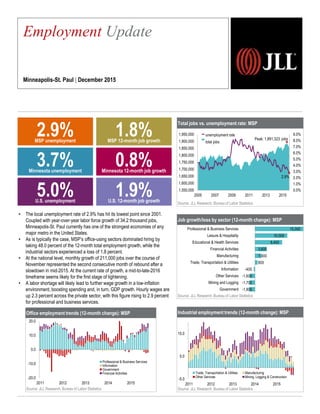
The local unemployment rate of 2.9% has hit its lowest point since 2001. Coupled with year-over-year labor force growth of 34.2 thousand jobs, Minneapolis-St. Paul currently has one of the strongest economies of any major metro in the United States.
As is typically the case, MSP’s office-using sectors dominated hiring by taking 48.0 percent of the 12-month total employment growth, while the industrial sectors experienced a loss of 1.8 percent.
At the national level, monthly growth of 211,000 jobs over the course of November represented the second consecutive month of rebound after a slowdown in mid-2015. At the current rate of growth, a mid-to-late-2016 timeframe seems likely for the first stage of tightening.
1. Total jobs vs. unemployment rate: MSP
Source: JLL Research, Bureau of Labor Statistics
Job growth/loss by sector (12-month change): MSP
Source: JLL Research, Bureau of Labor Statistics
Industrial employment trends (12-month change): MSP
Source: JLL Research, Bureau of Labor Statistics
• The local unemployment rate of 2.9% has hit its lowest point since 2001.
Coupled with year-over-year labor force growth of 34.2 thousand jobs,
Minneapolis-St. Paul currently has one of the strongest economies of any
major metro in the United States.
• As is typically the case, MSP’s office-using sectors dominated hiring by
taking 48.0 percent of the 12-month total employment growth, while the
industrial sectors experienced a loss of 1.8 percent.
• At the national level, monthly growth of 211,000 jobs over the course of
November represented the second consecutive month of rebound after a
slowdown in mid-2015. At the current rate of growth, a mid-to-late-2016
timeframe seems likely for the first stage of tightening.
• A labor shortage will likely lead to further wage growth in a low-inflation
environment, boosting spending and, in turn, GDP growth. Hourly wages are
up 2.3 percent across the private sector, with this figure rising to 2.9 percent
for professional and business services.
Employment Update
Minneapolis-St. Paul | December 2015
5.0%U.S. unemployment
1.9%U.S. 12-month job growth
2.9%MSP unemployment
1.8%MSP 12-month job growth
3.7%Minnesota unemployment
0.8%Minnesota 12-month job growth
0.0%
1.0%
2.0%
3.0%
4.0%
5.0%
6.0%
7.0%
8.0%
9.0%
1,550,000
1,600,000
1,650,000
1,700,000
1,750,000
1,800,000
1,850,000
1,900,000
1,950,000
2005 2007 2009 2011 2013 2015
Peak: 1,891,323 jobs
2.9%
unemployment rate
total jobs
-1,800
-1,700
-1,600
-400
800
1,900
3,600
8,400
10,000
15,000
Government
Mining and Logging
Other Services
Information
Trade, Transportation & Utilities
Manufacturing
Financial Activities
Educational & Health Services
Leisure & Hospitality
Professional & Business Services
Office employment trends (12-month change): MSP
Source: JLL Research, Bureau of Labor Statistics
-20.0
-10.0
0.0
10.0
20.0
2011 2012 2013 2014 2015
Professional & Business Services
Information
Government
Financial Activities
-5.0
5.0
15.0
2011 2012 2013 2014 2015
Trade, Transportation & Utilities Manufacturing
Other Services Mining, Logging & Construction