
Empfohlen
Empfohlen
Weitere ähnliche Inhalte
Was ist angesagt?
Was ist angesagt? (9)
Andere mochten auch
Ähnlich wie An Equity Research Report on NMDC Ltd. by Action Financial Services.
Ähnlich wie An Equity Research Report on NMDC Ltd. by Action Financial Services. (20)
An Equity Research Report on NMDC Ltd. by Action Financial Services.
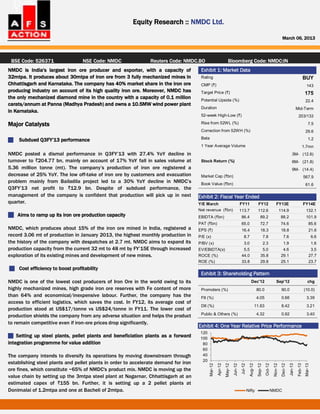
- 1. Equity Research :: NMDC Ltd. March 06, 2013 BSE Code: 526371 NSE Code: NMDC Reuters Code: NMDC.BO Bloomberg Code: NMDC:IN NMDC is India's largest iron ore producer and exporter, with a capacity of Exhibit 1: Market Data 32mtpa. It produces about 30mtpa of iron ore from 3 fully mechanized mines in Rating BUY Chhattisgarh and Karnataka. The company has 40% market share in the iron ore CMP (`) 143 producing industry on account of its high quality iron ore. Moreover, NMDC has Target Price (`) 175 the only mechanized diamond mine in the country with a capacity of 0.1 million Potential Upside (%) 22.4 carats/annum at Panna (Madhya Pradesh) and owns a 10.5MW wind power plant Duration Mid-Term in Karnataka. 52-week High-Low (`) 203/133 Major Catalysts Rise from 52WL (%) 7.5 Correction from 52WH (%) 29.6 Subdued Q3FY‟13 performance Beta 1.2 1 Year Average Volume 1.7mn NMDC posted a dismal performance in Q3FY‟13 with 27.4% YoY decline in 3M- (12.6) turnover to `204.77 bn, mainly on account of 17% YoY fall in sales volume at Stock Return (%) 6M- (21.8) 5.36 million tonne (mt). The company‟s production of iron ore registered a 9M- (14.4) decrease of 25% YoY. The low off-take of iron ore by customers and evacuation Market Cap (`bn) 567.9 problem mainly from Bailadila project led to a 30% YoY decline in NMDC‟s Book Value (`bn) 61.6 Q3FY‟13 net profit to `12.9 bn. Despite of subdued performance, the management of the company is confident that production will pick up in next Exhibit 2: Fiscal Year Ended quarter. Y/E March FY11 FY12 FY13E FY14E Net revenue (`bn) 113.7 112.6 114.9 132.1 Aims to ramp up its iron ore production capacity EBIDTA (`bn) 86.4 89.2 88.2 101.9 PAT (`bn) 65.0 72.7 74.6 85.6 NMDC, which produces about 15% of the iron ore mined in India, registered a EPS (`) 16.4 18.3 18.8 21.6 record 3.06 mt of production in January 2013, the highest monthly production in P/E (x) 8.7 7.8 7.6 6.6 the history of the company with despatches at 2.7 mt. NMDC aims to expand its P/BV (x) 3.0 2.3 1.9 1.6 production capacity from the current 32 mt to 48 mt by FY‟15E through increased EV/EBIDTA(x) 5.5 5.0 4.6 3.5 exploration of its existing mines and development of new mines. ROCE (%) 44.0 35.8 29.1 27.7 ROE (%) 33.8 29.8 25.1 23.7 Cost efficiency to boost profitability Exhibit 3: Shareholding Pattern NMDC is one of the lowest cost producers of Iron Ore in the world owing to its Dec'12 Sep'12 chg highly mechanized mines, high grade iron ore reserves with Fe content of more Promoters (%) 80.0 90.0 (10.0) than 64% and economical/inexpensive labour. Further, the company has the FII (%) 4.05 0.66 3.39 access to efficient logistics, which saves the cost. In FY12, its average cost of DII (%) 11.63 8.42 3.21 production stood at US$17/tonne vs US$24/tonne in FY11. The lower cost of production shields the company from any adverse situation and helps the product Public & Others (%) 4.32 0.92 3.40 to remain competitive even if iron‐ore prices drop significantly. Exhibit 4: One Year Relative Price Performance Setting up steel plants, pellet plants and beneficiation plants as a forward integration programme for value addition The company intends to diversify its operations by moving downstream through establishing steel plants and pellet plants in order to accelerate demand for iron ore fines, which constitute ~65% of NMDC's product mix. NMDC is moving up the value chain by setting up the 3mtpa steel plant at Nagarnar, Chhattisgarh at an estimated capex of `155 bn. Further, it is setting up a 2 pellet plants at Donimalai of 1.2mtpa and one at Bacheli of 2mtpa.
- 2. Equity Research :: NMDC Ltd. March 06, 2013 NMDC well placed to benefit from current mining scenario Exhibit 5: Region wise mining output of NMDC Robust demand of iron ore in the domestic markets (as against the slowdown in the global market) coupled with constrained supply is favorable for the company as it has high quality assets on account of best mining practices. Further, its assets in Karnataka have remained unharmed whereas private mines were closed due to blanket mining ban imposed by the Supreme Court in July 2011. Moreover, Supreme Court immediately granted all the necessary approvals to NMDC for meeting the deadline of producing 12mtpa from Bellary district. Also, it was unviable for steel manufacturers to procure iron ore from other states due to logistical constraints, increasing their dependence on NMDC. Made its first overseas venture through 50% acquisition in Legacy Iron Ore Exhibit 6: Iron ore sales & production trend NMDC has completed its first overseas acquisition for iron ore resources in 3000 0.25 (inmtpa) Australia. It acquired 50% stake in Legacy Iron Ore 23% (Legacy), a listed entity, for a consideration of `996.3 mn. The acquisition will aid the company in long 2500 0.2 term mineral security for domestic industry. Legacy has six exploration stage projects and has 11.18% stake in Hawthorn Resources Ltd, the registered 2000 owner of Mt Bevan iron ore tenements having inferred resource of 1.59 billion0.15 tonnes of magnetite iron ore at 30.2% Fe Tests which can be beneficiated to 69-70% Fe with around 44% recovery. 1500 0.1 Series1 8% Series2 Debt free company with huge cash reserves 1000 0.05 2% 2% NMDC is a debt free company sitting on a huge cash pile of ~`225 bn cash 1% Exhibit 6: Sales Volume Trend (in mt) 500 0 0 reserve at the end of FY12 which reflects on the company‟s balance sheet -2% strength. The company is also consistently paying dividend. In FY12, NMDC paid dividend of 0 -0.05 `4.5/share, implying a payout ratio of 26.1%. The company Year FY05in FY06 FY07 FY08 FY09 FY10 FY11 10% will be well poised for re-rating future on higher dividend payout. With stake sale, the free float of the company has increased to 20% and has the largest market capitalization in the Indian metals and mining sector. Exhibit 8: Relative price chart Exhibit 7: Relative Valuation Dividend P/E P/B Yield (%) Sesa Goa 8.4 1.1 2.5 NMDC 7.8 2.3 3.1 MOIL 9.8 1.7 2.1
- 3. Equity Research :: NMDC Ltd. March 06, 2013 Mining Industry Being a rich source of minerals, India is the world's third largest producer of coal, fourth largest producer of iron ore and the fifth largest producer of bauxite. Iron ore reserves are estimated in the region of 23bnt (billion tonnes) and account for 6% of global reserves, while coal reserves are reported to be around 255bnt. Further, coal production is expected to grow at a CAGR of around 7.0% during FY12-14. In a recent report, the Indian Bureau of Mines (IBM) said that “almost all the major iron-ore belts - Orissa, Jharkhand, Chattisgarh, Maharasthra, Goa and Karnataka were exploited for high-grade ore at a cutoff of around 60% iron and many had been exploited for high- and medium-grade ores (62% plus) over the last six decades; but the country has huge potential in low- grade ores in these regions, however exploration efforts have been highly inadequate.” Besides, only 10.0% of the country's landmass has been explored, due to significant regulatory and bureaucratic hurdles. However, the industry performance is anticipated to decelerate, with an expected CAGR of 12.5% for the five-year period i.e. 2011 - 2016, which is expected to drive the industry to a value of $255.8 bn by the end of 2016. Despite of the prevailing obstacles, the fast-rising domestic demand and favorable regulations such as FDI, Mines and Minerals Development & Regulation (MMDR) bill etc. would increase the competition and transparency among the market players which in turn encourage the Indian companies to venture into the sector and will also provide tailored solutions for the issues hampering the growth, without losing the operational efficiency. Rising demand provides opportunities to the sector to drive growth The rising demand, exploration of unknown deposits, new discoveries, upgraded technologies and favorable government policies has opened varied opportunities to the Indian mining industry and mend the demand curve for this sector on rising side. It is believed that the domestic steel capacity is likely to go up from current ~84 mtpa to ~110 mtpa, which in turn will help iron ore demand to remain robust. The availability of iron ore is bound to fall in India and many steel players have started looking for imports, which definitely is a costlier proposition, these restrictions and strict regulations, we believe would be helpful in improving NMDC‟s pricing power for its domestic customers. Exhibit 9: Steel capacity growth in India (mt) Government reforms to help in improving sector's future growth spending to boost cement demand On the backdrop of fall in domestic iron ore production, India would have to import about 15 mt of iron-ore by the end of FY13 and this was to increase further in the coming years since most domestic steel companies were facing acute shortages of ore from private miners due to ban on illegal mining. To meet the target and to support the grounded sector, the management has taken various steps to boost the production and investment by calling for a sea change in the country's mining industry. India, among the top ten mineral producing nations in the world has welcomed the judgment given by the Supreme Court to lift ban on iron ore mining operations in Karnataka for companies which have not flouted lease conditions. Moreover, the infusion of some new mining policies by the government such as competitive bidding for all natural resources, primarily coal blocks, new MMDR bill and various other policy interventions are likely to give a driving growth to the sector. Outlook India's huge potential market for the metal is likely to encourage investments and the introduction & development of new technologies. Going ahead, the industry in its aggressive expansion plans is all set to make a landmark in key sectors such as construction, infrastructure and utility production that will continue to create demand for minerals and will help to shape the modern energy economy. With the 100% approval of FDI under the automatic route in metallic and non-metallic ore mining, the multinational corporations are expected to make significant investments in the Indian mining sector. With this, it is expected that the value of India's mining industry will touch $57.2bn by 2017.
- 4. Equity Research :: NMDC Ltd. March 06, 2013 Financial Summary Exhibit 11: Balance Sheet (Consolidated) Exhibit 12: Profit & Loss Account (Consolidated) (`bn) FY11A FY12A FY13E FY14E (`bn) FY11A FY12A FY13E FY14E Share Capital 4.0 4.0 4.0 4.0 Net Revenue 113.7 112.6 114.9 132.1 Reserve and surplus 188.2 240.1 292.9 356.7 Expenses 27.3 23.4 26.7 30.3 Net Worth 192.1 244.1 296.9 360.7 EBITDA 86.4 89.2 88.2 101.9 Long term provisions 0.1 0.1 0.1 0.2 EBITDA Margin % 76.0 79.2 76.8 77.1 Current Liabilities 17.4 21.1 22.9 26.2 Other Liabilities 0.2 0.2 0.3 0.3 Depreciation 1.2 1.3 1.4 1.5 Deferred Tax Liability 1.0 1.0 1.0 1.0 EBIT 85.2 87.9 86.9 100.4 Capital Employed 211.0 266.5 321.2 388.3 Exceptional items 0.0 0.5 0.0 0.0 Fixed assets 16.7 26.8 32.7 41.9 Other Income 12.0 20.2 23.3 26.1 Loans & Advances 2.0 5.1 5.6 6.4 Profit Before Tax 97.2 107.6 110.2 126.5 Current Assets 190.9 232.0 279.8 336.2 Tax 32.3 34.9 35.6 40.9 Investment 1.4 2.5 3.0 3.7 Net Profit 65.0 72.7 74.6 85.6 Other Assets 0.1 0.1 0.1 0.1 Capital Deployed 211.0 266.5 321.2 388.3 NPM % 57.1 64.5 64.9 64.8 Exhibit 13: Ratios (Consolidated) Valuation and view FY11A FY12A FY13E FY14E NMDC provides an optimistic picture of the company‟s future EBITDA Margin (%) 76.0 79.2 76.8 77.1 growth initiatives on high quality huge reserves with strong EBIT Margin (%) 75.0 78.1 75.6 76.0 balance sheet, fully mechanized mines, recent JVs etc. Further, NPM (%) 57.1 64.5 64.9 64.8 the company‟s earnings will get a boost once its new capacities ROCE (%) 44.0 35.8 29.1 27.7 come on stream. Moreover, NMDC has the only mechanized ROE (%) 33.8 29.8 25.1 23.7 diamond mine in the country with a capacity of 0.1 million carats/annum. Besides, ban in Karnataka on private mines EPS (`) 16.4 18.3 18.8 21.6 augurs well for the company. P/E (x) 8.7 7.8 7.6 6.6 BVPS(`) 48.5 61.6 74.9 91.0 We rate the stock as „BUY‟ at the current market price of `143, P/BVPS (x) 3.0 2.3 1.9 1.6 given the strong fundamentals, apt management and long term EV/Operating Income (x) 4.2 3.9 3.5 2.7 growth visibility. The current market price of `143, implies a P/E of ~6.6x FY‟14E EPS of `21.6 and P/BV of 1.6x on FY‟14E EV/EBITDA (x) 5.5 5.0 4.6 3.5 BVPS of `91.0 respectively.
- 5. Equity Research :: NMDC Ltd. March 06, 2013 Disclaimer: “This document has been prepared by Action financial services India ltd.(AFSIL) This Document is subject to changes without prior notice and is intended only for the person or entity to which it is addressed to and may contain confidential and/or privileged material and is not for any type of circulation. Any review, retransmission, or any other use is prohibited. Kindly note that this document does not constitute an offer or solicitation for the purchase or sale of any financial instrument or as an official confirmation of any transaction. Though disseminated to all the customers simultaneously, not all customers may receive this report at the same time. AFSIL will not treat recipients as customers by virtue of their receiving this report. The information contained herein is from publicly available data or other sources believed to be reliable. While we would endeavor to update the information herein on reasonable basis, AFSIL, its subsidiaries and associated companies, their directors and employees (“AFSIL and affiliates”) are under no obligation to update or keep the information current. Also, there may be regulatory, compliance, or other reasons that may prevent AFSIL and affiliates from doing so. We do not represent that information contained herein is accurate or complete and it should not be relied upon as such. This document is prepared for assistance only and is not intended to be and must not alone be taken as the basis for an investment decision. The user assumes the entire risk of any use made of this information. Each recipient of this document should make such investigations as it deems necessary to arrive at an independent evaluation of an investment in the securities of companies referred to in this document (including the merits and risks involved), and should consult its own advisors to determine the merits and risks of such an investment. The investment discussed or views expressed may not be suitable for all investors. We do not undertake to advise you as to any change of our views. Affiliates of AFSIL may have issued other reports that are inconsistent with and reach different conclusion from the information presented in this report. This report is not directed or intended for distribution to, or use by, any person or entity who is a citizen or resident of or located in any locality, state, country or other jurisdiction, where such distribution, publication, availability or use would be contrary to law, regulation or which would subject AFSIL and affiliates to any registration or licensing requirement within such jurisdiction. The securities described herein may or may not be eligible for sale in all jurisdictions or to certain category of investors. Persons in whose possession this document may come are required to inform themselves of and to observe such restriction. AFSIL & affiliates may have used the information set forth herein before publication and may have positions in, may from time to time purchase or sell or may be materially interested in any of the securities mentioned or related securities. AFSIL may from time to time solicit from, or perform investment banking, or other services for, any company mentioned herein. Without limiting any of the foregoing, in no event shall AFSIL, any of its affiliates or any third party involved in, or related to, computing or compiling the information have any liability for any damages of any kind..