Weatherford International plc technical analysis charts
•
0 likes•89 views

Weatherford International plc technical analysis charts

Recommended
Recommended
More Related Content
Recently uploaded
Recently uploaded (20)
Featured
Featured (20)
Weatherford International plc technical analysis charts
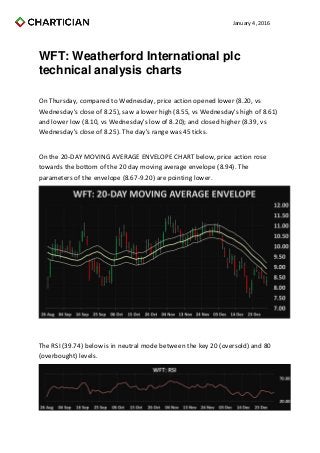
- 1. January 4, 2016 WFT: Weatherford International plc technical analysis charts On Thursday, compared to Wednesday, price action opened lower (8.20, vs Wednesday's close of 8.25), saw a lower high (8.55, vs Wednesday's high of 8.61) and lower low (8.10, vs Wednesday's low of 8.20); and closed higher (8.39, vs Wednesday's close of 8.25). The day's range was 45 ticks. On the 20-DAY MOVING AVERAGE ENVELOPE CHART below, price action rose towards the bottom of the 20 day moving average envelope (8.94). The parameters of the envelope (8.67-9.20) are pointing lower. The RSI (39.74) below is in neutral mode between the key 20 (oversold) and 80 (overbought) levels.
- 2. January 4, 2016 The MACD 12 day moving average is above the MACD 26 day moving average; both are above zero and falling. The MACD 12 day moving average has just crossed above the MACD 26 day moving average, generating a positive signal. The Slow Stochastics, below, are in positive mode, with the K line above the D line. The Commodity Channel Index (-76.31), below, is in positive mode above the oversold -200 level. On the DAILY BOLLINGER BANDS CHART below, Thursday represents the 8th consecutive close below the middle of the Bollinger Band envelope (8.94). The Bollinger Bands (7.55-10.32) are converging; and narrowed from a width of 313 ticks on Wednesday to a width of 277 ticks on Thursday.
- 3. January 4, 2016 On the 5 AND 20 DAY MOVING AVERAGES CHART below, the 5 day moving average (8.55, moving down) is below the 20 day moving average (8.94, moving down); in negative mode. The 3-50 day strip of moving averages ranges from the 3 day moving average (8.41) at the bottom of the range to the 50 day moving average (9.92) at the top of the range. The Parabolic Stop and Reverse (7.83) below is in the 6th day of buy mode.
- 4. January 4, 2016 On the WEEKLY BOLLINGER BANDS CHART below, last week represents the 2nd consecutive close below the middle of the Bollinger Bands envelope (9.62). The Bollinger Bands (7.83-11.41) are diverging; expanding from a width of 339 ticks on Wednesday to a width of 358 ticks on Thursday.