General Motors Company technical analysis charts
•
0 likes•83 views

http://www.chartician.com/ General Motors Company technical analysis charts

Recommended
Recommended
More Related Content
Recently uploaded
Recently uploaded (20)
Featured
Featured (20)
General Motors Company technical analysis charts
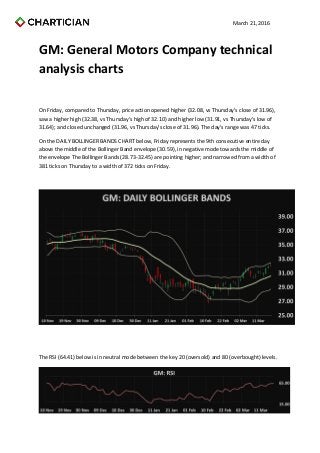
- 1. March 21, 2016 GM: General Motors Company technical analysis charts On Friday, compared to Thursday, price action opened higher (32.08, vs Thursday's close of 31.96), saw a higher high (32.38, vs Thursday's high of 32.10) and higher low (31.91, vs Thursday's low of 31.64); and closed unchanged (31.96, vs Thursday's close of 31.96). The day's range was 47 ticks. On the DAILY BOLLINGER BANDS CHART below, Friday represents the 9th consecutive entire day above the middle of the Bollinger Band envelope (30.59), in negative mode towards the middle of the envelope The Bollinger Bands (28.73-32.45) are pointing higher; and narrowed from a width of 381 ticks on Thursday to a width of 372 ticks on Friday. The RSI (64.41) below is in neutral mode between the key 20 (oversold) and 80 (overbought) levels.
- 2. March 21, 2016 The MACD 12 day moving average is below the MACD 26 day moving average; both are above zero and rising. The Slow Stochastics, below, are in positive mode, with the K line above the D line. The Commodity Channel Index (126.24), below, is in positive mode above the oversold -200 level. On the 20-DAY MOVING AVERAGE ENVELOPE CHART below, price action was unchanged away from the top of the 20 day moving average envelope (30.59). The parameters of the envelope (29.67- 31.51) are pointing higher.
- 3. March 21, 2016 On the 5 AND 20 DAY MOVING AVERAGES CHART below, the 5 day moving average (31.57, moving up) is above the 20 day moving average (30.59, moving up), in positive mode. The 3-50 day strip of moving averages ranges from the 40 day moving average (29.70) at the bottom of the range to the 3 day moving average (31.87) at the top of the range. The Parabolic Stop and Reverse (30.33) below is in the 3rd day of buy mode.
- 4. March 21, 2016 On the WEEKLY BOLLINGER BANDS CHART below, last week represents the 11th consecutive close below the middle of the Bollinger Bands envelope (32.16). The Bollinger Bands (26.37-37.94) are pointing lower; contracting from a width of 1,181 ticks on Thursday to a width of 1,157 ticks on Friday.