Stock Research Report for T as of 9/8/11 - Chaikin Power Tools
•
1 like•164 views

To order a free Chaikin Power Gauge stock research report for T go to http://www.chaikinpowertools.com/reports

Recommended
Recommended
More Related Content
Recently uploaded
Recently uploaded (20)
Featured
Featured (20)
Stock Research Report for T as of 9/8/11 - Chaikin Power Tools
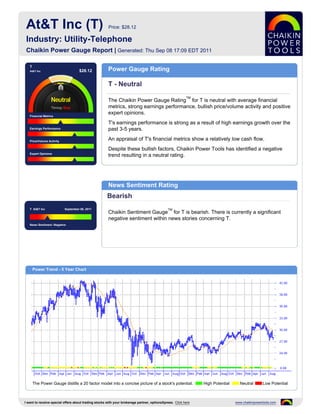
- 1. At&T Inc (T) Price: $28.12 Industry: Utility-Telephone Chaikin Power Gauge Report | Generated: Thu Sep 08 17:09 EDT 2011 T At&T Inc $28.12 Power Gauge Rating T - Neutral TM The Chaikin Power Gauge Rating for T is neutral with average financial metrics, strong earnings performance, bullish price/volume activity and positive expert opinions. Financial Metrics T's earnings performance is strong as a result of high earnings growth over the Earnings Performance past 3-5 years. Price/Volume Activity An appraisal of T's financial metrics show a relatively low cash flow. Despite these bullish factors, Chaikin Power Tools has identified a negative Expert Opinions trend resulting in a neutral rating. News Sentiment Rating Bearish T At&T Inc September 08, 2011 TM Chaikin Sentiment Gauge for T is bearish. There is currently a significant negative sentiment within news stories concerning T. News Sentiment :Negative Power Trend - 5 Year Chart The Power Gauge distills a 20 factor model into a concise picture of a stock's potential. High Potential Neutral Low Potential I want to receive special offers about trading stocks with your brokerage partner, optionsXpress. Click here www.chaikinpowertools.com
- 2. Financials & Earnings Financial Metrics Financial Metrics Rating LT Debt/Equity Ratio Neutral Price to Book Value T's financial metrics are neutral. The company may be undervalued and generates relatively low free cash flow relative to market capitalization. Return on Equity The rank is based on a low price to book value, high return on equity, low price to sales ratio and relatively low cash flow. Price to Sales Ratio Business Value Assets and Liabilities Valuation Returns Ratio TTM Ratio TTM Ratio TTM Current Ratio 0.66 Price/Book 1.46 Return on Invest 7.9% LT Debt/Equity 0.53 Price/Sales 1.34 Return on Equity 12.0% Earnings Performance Earnings Performance Rating Earnings Growth Bullish Earnings Surprise T's earnings performance has been strong. The company has a history of strong earnings growth and experienced superior earnings growth in the past 12 months. Earnings Trend The rank is based on high earnings growth over the past 3-5 years, worse than expected earnings in recent quarters, an upward trend in earnings this year, a Projected P/E Ratio relatively low projected P/E ratio and inconsistent earnings over the past 5 years. Earnings Consistency 5 Year Revenue and Earnings Growth EPS Estimates 12/06 12/07 12/08 12/09 12/10 Factor Actual EPS Prev EST EPS Current Change Revenue(M) 63,055.00 118,928.00 124,028.00 123,018.00 124,280.00 Quarterly EPS $2.09 $0.60 -1.49 Rev % Growth 43.76% 88.61% 4.29% -0.81% 1.03% Yearly EPS $3.36 $2.37 -0.99 EPS $1.89 $1.95 $2.17 $2.13 $3.36 Factor Actual EPS Growth Est EPS Growth Change EPS % Growth 33.10% 3.17% 11.28% -1.84% 57.75% 3-5 year EPS 27.37% 4.54% -22.83 EPS Surprise EPS Quarterly Results Estimate Actual Difference % Difference FY Qtr 1 Qtr 2 Qtr 3 Qtr 4 Total Latest Qtr $0.59 $0.60 $0.01 1.69 12/09 $0.53 $0.54 $0.54 $0.51 $2.12 1 Qtr Ago $0.57 $0.57 $0.00 0.00 12/10 $0.42 $0.68 $2.09 $0.18 $3.37 2 Qtr Ago $0.54 $0.55 $0.01 1.85 12/11 $0.57 $0.60 - - - 3 Qtr Ago $0.55 $0.55 $0.00 0.00 Fiscal Year End Month is December. I want to receive special offers about trading stocks with your brokerage partner, optionsXpress. Click here www.chaikinpowertools.com
- 3. Price Trend & Expert Opinions Price/Volume Activity Price/Volume Activity Rating Relative Strength vs Market Bullish Chaikin Money Flow Price and volume activity for T is bullish. T is trading on higher volume than its 90 day average volume and has outperformed the S&P 500 over 26 weeks. Price Trend The rank for T is based on its price strength versus the market, negative Chaikin Price Trend ROC money flow, a positive Chaikin price trend, a negative Chaikin price trend ROC and an increasing volume trend. Volume Trend Relative Strength vs S&P500 Index Chaikin Money Flow Chart shows whether T is performing better or worse than the market. Chaikin Money Flow analyzes supply and demand for a company's stock. Price Activity Price Activity Volume Activity Factor Value Factor Value Factor Value 52 Week High 31.86 % Change Price - 4 Weeks 0.90% Average Volume 20 Days 33,544,148 52 Week Low 27.27 % Change Price - 24 Weeks -0.04% Average Volume 90 Days 27,746,296 % Change YTD Rel S&P 500 2.28% % Change Price - 4 Wks Rel to S&P -5.66% Chaikin Money Flow Persistency 28% % Change Price - 24 Wks Rel to S&P 8.21% Expert Opinions Expert Opinions Earnings Estimate Revisions Bullish Short Interest Expert opinions about T are positive. Shorting of T is low and analysts's opinions on T have been more positive recently. Insider Activity The rank for T is based on analysts revising earnings estimates upward, a low short interest ratio, insiders not purchasing significant amounts of stock, optimistic Analyst Opinions analyst opinions and price strength of the stock versus the Utility-Telephone industry group. Relative Strength vs Industry Earnings Estimate Revisions Analyst Recommendations EPS Estimates Revision Summary Current 7 Days Ago % Change Factor Value Last Week Last 4 Weeks Current Qtr 0.60 0.60 0.00% Mean this Week Buy Up Down Up Down Next Qtr 0.59 0.59 0.00% Mean Last Week Buy Curr Qtr 0 0 0 0 Curr Yr 1 0 0 1 Current 30 Days Ago % Change Change 0.00 Next Qtr 1 0 0 0 Current FY 2.37 2.37 0.00 Mean 5 Weeks Ago Buy Next Yr 1 0 0 0 I want to receive special offers about trading stocks with your brokerage partner, optionsXpress. Click here www.chaikinpowertools.com
- 4. The Company & Its Competitors T's Competitors in Utility-Telephone News Headlines for T Company Power Historic EPS Projected EPS Profit Margin PEG PE Revenue(M) AT&T Brings Mobile Broadband Network to Gauge growth growth Sheboygan - Sep 8, 2011 T 27.37% 4.54% 16.25% 2.61 12.39 124,280 AT&T Brings Mobile Broadband Network to FTE 0.08% 2.21% - 3.76 - 60,428 Buckhannon - Sep 8, 2011 AT&T Launches Wi-Fi Hotzone on Palo Alto's BT 3.63% 5.27% 8.18% 1.45 8.02 32,910 Popular University Avenue - Sep 7, 2011 NTT 5.85% 8.10% 4.88% 0.99 25.14 127,473 Sprint Sues to Block a Merger Between AT&T and T-Mobile - Sep 7, 2011 TEF 17.73% -2.70% 14.90% -2.99 3.48 83,649 Sprint Sues to Block a Merger Between AT&T TI 0.96% 1.78% 10.78% 3.41 5.05 38,323 and T-Mobile - Sep 7, 2011 VZ 7.43% 3.85% 6.12% 4.14 16.34 106,565 Company Details Company Profile AT&T INC AT&T Inc. is a premier communications holding company. Its subsidiaries and affiliates, 208 S. AKARD ST AT&T operating companies, are the providers of AT&T services in the United States and DALLAS, TX 75202 around the world. Among their offerings are the world's most advanced IP-based USA business communications services, the nation's fastest 3G network and the best wireless Phone: 2108214105 coverage worldwide, and the nation's leading high speed Internet access and voice Website: http://http://www.att.com services. In domestic markets, AT&T is known for the directory publishing and advertising Full Time Employees: 265,410 sales leadership of its Yellow Pages and YELLOWPAGES.COM organizations, and the Sector: Utilities AT&T brand is licensed to innovators in such fields as communications equipment. As part of their three-screen integration strategy, AT&T operating companies are expanding their TV entertainment offerings. Power Gauge Ratings are created using a relative ranking system that assigns a rank of 0 to 100 (100 being the highest) to each stock in the universe. Rank is calculated by evaluating each of the stocks factors and combining them into a single number using a weighting formula. A stock's rank ranges from 100-0, where 100 is the strongest, and a rank of 95 indicates the stock is better than 95% of the stocks in the universe. Chaikin Stock Research(CSR) is not registered as a securities broker dealer or investment advisor with either the U.S. Securities and Exchange Commission or with any state securities regulatory authority. CSR is not responsible for trades executed by users of this research report, our web site or mobile app based on the information included herein. The information presented in this report does not represent a recommendation to buy or sell stocks or any financial instrument nor is it intended as an endorsement of any security or investment. The information in this report is generic by nature and is not personalized to the specific financial situation of any individual. The user bears complete responsibility for their own investment research and should seek the advice of a qualified investment professional before making any investment decisions. Copyright (c) 1978-(Present) by ZACKS Investment Research, Inc ("ZACKS"). The information, data, analyses and opinions contained herein (1) includes the confidential and proprietary information of ZACKS, (2) may not be copied or redistributed, for any purpose, (3) does not constitute investment advice offered by ZACKS, (4) are provided solely for informational purposes, and (5) are not warranted or represented to be correct, complete, accurate or timely. ZACKS shall not be responsible for investment decisions, damages or other losses resulting from, or related to, use of this information, data, analyses or opinions. Past performance is no guarantee of future performance. ZACKS is not affiliated with Chaikin Power Tools. This report from Chaikin Power Tools is for informational purposes only and is not a recommendation to buy or sell securities. LM 2.3 DS 3.0 LS 2.1 Data Provided by ZACKS Investment Research, Inc., www.zacks.com Special offers to trade stocks from optionsXpress: www.chaikinpowertools.com