SlideShare a Scribd company logo
1 of 4
Download to read offline
PROCTER & GAMBL (PG)                                                                                          Price: $64.08

 Industry: Soaps-Cosmetics
 Chaikin Power Gauge Report | Generated: Thu Jun 23 13:39 EDT 2011

   PG
   PROCTER & GAMBL                 $64.08             Power Gauge Rating

                                                      PG - Bearish
                                                                                                         TM
                                                      The Chaikin Power Gauge Rating for PG is bearish due to very poor financial
                                                      metrics and weak earnings performance. The rating also reflects positive expert
                                                      opinions.
   Financial Metrics

                                                      PG's financial metrics are very poor due to a high price to sales ratio and
   Earnings Performance                               relatively low cash flow.

   Price/Volume Activity


   Expert Opinions


                                                      News Sentiment Rating
                                                      Neutral
   PG PROCTER & GAMBL          June 22, 2011                                                 TM
                                                      Chaikin Sentiment Gauge for PG is neutral. Stories concerning PG have a
                                                      balanced or neutral sentiment.
   News Sentiment :Neutral


     Power Trend - 5 Year Chart


     The Power Gauge distills a 20 factor model into a concise picture of a stock's potential.                   High Potential     Neutral       Low Potential


I want to receive special offers about trading stocks with your brokerage partner, optionsXpress. Click here                      www.chaikinpowertools.com
Financials & Earnings


    Financial Metrics
                                                                Financial Metrics Rating

    LT Debt/Equity Ratio
                                                                Very Bearish

    Price to Book Value                                         PG's financial metrics are very poor. The company has relatively low revenue per
                                                                share and generates relatively low free cash flow relative to market capitalization.
    Return on Equity
                                                                The rank is based on a high price to book value ratio, high return on equity, high
                                                                price to sales ratio and relatively low cash flow.
    Price to Sales Ratio


    Business Value


    Assets and Liabilities                                                    Valuation                                                   Returns


    Ratio                                                  TTM                Ratio                                       TTM             Ratio                                         TTM

    Current Ratio                                          0.83               Price/Book                                  2.71            Return on Invest                             13.5%

    LT Debt/Equity                                         0.36               Price/Sales                                 2.27            Return on Equity                             18.3%


    Earnings Performance
                                                                Earnings Performance Rating

    Earnings Growth
                                                                Bearish

    Earnings Surprise                                           PG's earnings performance has been weak. The company has not met analysts'
                                                                earnings estimates and experienced relatively poor earnings growth in the past
                                                                12 months.
    Earnings Trend

                                                                The rank is based on worse than expected earnings in recent quarters, a
    Projected P/E Ratio                                         relatively poor trend in earnings this year, a relatively high projected P/E ratio and
                                                                consistent earnings over the past 5 years.
    Earnings Consistency


   5 Year Revenue and Earnings Growth                                                                    EPS Estimates


                              06/06           06/07             06/08            06/09           06/10   Factor                       Actual EPS Prev        EST EPS Current          Change

   Revenue(M)              68,222.00       76,476.00      83,503.00         79,029.00        78,938.00   Quarterly EPS                            $0.74                $0.82           +0.08

   Rev % Growth              20.23%          12.10%             9.19%          -5.36%           -0.12%   Yearly EPS                               $4.32                $3.93            -0.39

   EPS                        $2.79           $3.22             $3.86            $4.49           $4.32   Factor                  Actual EPS Growth            Est EPS Growth          Change

   EPS % Growth              -1.41%          15.41%         19.88%             16.32%           -3.79%   3-5 year EPS                          7.21%                   9.40%           +2.19


    EPS Surprise                                                                                         EPS Quarterly Results


                                Estimate               Actual           Difference       % Difference    FY                   Qtr 1           Qtr 2            Qtr 3        Qtr 4       Total

    Latest Qtr                     $0.97               $0.96               $-0.01               -1.03    06/09                $1.10           $1.68           $0.88        $0.80       $4.46

    1 Qtr Ago                      $1.10               $1.13                $0.03               2.73     06/10                $1.11           $1.58           $0.88        $0.74       $4.31

    2 Qtr Ago                      $1.00               $1.02                $0.02               2.00     06/11                $1.07           $1.17           $1.01             -           -

    3 Qtr Ago                      $0.73               $0.71               $-0.02               -2.74    Fiscal Year End Month is June.


 I want to receive special offers about trading stocks with your brokerage partner, optionsXpress. Click here                                             www.chaikinpowertools.com
Price Trend & Expert Opinions

    Price/Volume Activity
                                                     Price/Volume Activity Rating

    Relative Strength vs Market                      Neutral

    Chaikin Money Flow
                                                     Price and volume activity for PG is neutral. PG is experiencing sustained buying
                                                     and is in a decelerating price trend compared to 4 months ago.
    Price Trend
                                                     The rank for PG is based on positive Chaikin money flow and a negative Chaikin
    Price Trend ROC
                                                     price trend ROC.


    Volume Trend


   Relative Strength vs S&P500 Index                                                          Chaikin Money Flow


   Chart shows whether PG is performing better or worse than the market.                       Chaikin Money Flow analyzes supply and demand for a company's stock.


    Price Activity                                               Price Activity                                           Volume Activity

    Factor                                         Value        Factor                                           Value   Factor                                         Value

    52 Week High                                   67.46        % Change Price - 4 Weeks                        -3.50%   Average Volume 20 Days                     8,770,350

    52 Week Low                                    59.34        % Change Price - 24 Weeks                       -1.14%   Average Volume 90 Days                     9,965,367

    % Change YTD Rel S&P 500                      -0.54%        % Change Price - 4 Wks Rel to S&P               -1.00%   Chaikin Money Flow Persistency                  71%

                                                                % Change Price - 24 Wks Rel to S&P              -1.95%


    Expert Opinions
                                                     Expert Opinions

    Earnings Estimate Revisions                      Bullish
    Short Interest                                   Expert opinions about PG are positive. Shorting of PG is low and analysts's
                                                     opinions on PG have been more positive recently.
    Insider Activity
                                                     The rank for PG is based on analysts revising earnings estimates downward, a
                                                     low short interest ratio, insiders purchasing stock and optimistic analyst opinions.
    Analyst Opinions


    Relative Strength vs Industry


    Earnings Estimate Revisions                                  Analyst Recommendations                                  EPS Estimates Revision Summary

                       Current      7 Days Ago % Change         Factor                                           Value                            Last Week    Last 4 Weeks

   Current Qtr           0.82             0.82    0.00%         Mean this Week                                     Buy                         Up     Down         Up   Down

   Next Qtr              1.14             1.14    0.00%         Mean Last Week                                     Buy   Curr Qtr                 0       0         0       1

                                                                                                                         Curr Yr                  0       0         0       1
                       Current      30 Days Ago % Change        Change                                            0.00
                                                                                                                         Next Qtr                 0       0         1       0
   Current FY            3.93             3.93      0.00        Mean 5 Weeks Ago                                   Buy
                                                                                                                         Next Yr                  0       0         0       2


 I want to receive special offers about trading stocks with your brokerage partner, optionsXpress. Click here                          www.chaikinpowertools.com
The Company & Its Competitors


   PG's Competitors in Soaps-Cosmetics                                                                             News Headlines for PG

   Company     Power   Historic EPS   Projected EPS    Profit Margin      PEG            PE    Revenue(M)           TPR Holdings Acquires Controlling Interest In
               Gauge         growth           growth                                                                Oscar Blandi Hair Care Brand - Jun 13, 2011
   PG                        7.21%           9.40%          14.23%        1.74         16.77        78,938          Business Highlights - Jun 10, 2011
   OBCI                      9.44%                 -         7.60%           -         12.42            27          WildTangent to Launch Unprecedented Android
                                                                                                                    Game Service With T M - Jun 8, 2011
   CL                        6.55%           8.80%          15.40%        1.99         18.31        15,564
                                                                                                                    Diamond Foods posts 3Q profit - Jun 2, 2011
   CHD                       8.41%          12.00%          10.56%        1.58         20.32         2,589
                                                                                                                    CA P&G Salon Romijn 05 18 - May 18, 2011
   ZEP                       0.32%                 -         2.33%           -         16.92          569

   CLX                       4.78%           9.67%          10.61%        1.80         16.73         5,534


        Company Details                                            Company Profile

        PROCTER & GAMBL                                            The Procter & Gamble Company manufactures and markets a broad range of consumer
        ONE PROCTER & GAMBLE                                       products in many countries throughout the world. Products fall into five business
        PLAZA                                                      segments: fabric and home care, paper, beauty care, health care, and food and
        CINCINNATI, OH 45202                                       beverage. Today, P&G markets more than 250 products to more than five billion
        USA                                                        consumers in 130 countries.
        Phone: 5139831100
        Fax: 513-983-4381
        Website: http://http://www.pg.com
        Full Time Employees: 127,000
        Sector: Consumer Staples


  Power Gauge Ratings are created using a relative ranking system that assigns a rank of 0 to 100 (100 being the highest) to each stock in the universe. Rank is calculated
  by evaluating each of the stocks factors and combining them into a single number using a weighting formula. A stock's rank ranges from 100-0, where 100 is the
  strongest, and a rank of 95 indicates the stock is better than 95% of the stocks in the universe.

  Chaikin Stock Research(CSR) is not registered as a securities broker dealer or investment advisor with either the U.S. Securities and Exchange Commission or with any
  state securities regulatory authority. CSR is not responsible for trades executed by users of this research report, our web site or mobile app based on the information
  included herein. The information presented in this report does not represent a recommendation to buy or sell stocks or any financial instrument nor is it intended as an
  endorsement of any security or investment. The information in this report is generic by nature and is not personalized to the specific financial situation of any individual.
  The user bears complete responsibility for their own investment research and should seek the advice of a qualified investment professional before making any investment
  decisions.

  Copyright (c) 1978-(Present) by ZACKS Investment Research, Inc ("ZACKS"). The information, data, analyses and opinions contained herein (1) includes the
  confidential and proprietary information of ZACKS, (2) may not be copied or redistributed, for any purpose, (3) does not constitute investment advice offered by
  ZACKS, (4) are provided solely for informational purposes, and (5) are not warranted or represented to be correct, complete, accurate or timely. ZACKS shall not be
  responsible for investment decisions, damages or other losses resulting from, or related to, use of this information, data, analyses or opinions. Past performance is no
  guarantee of future performance. ZACKS is not affiliated with Chaikin Power Tools.

  This report from Chaikin Power Tools is for informational purposes only and is not a recommendation to buy or sell securities.


                                                                                                                                                                     LM 2.3 DS 3.0 LS 2.1


 Data Provided by ZACKS Investment Research, Inc., www.zacks.com                     Special offers to trade stocks from optionsXpress: www.chaikinpowertools.com

More Related Content

Recently uploaded

Presentation4 (2) survey responses clearly labelled
Presentation4 (2) survey responses clearly labelledPresentation4 (2) survey responses clearly labelled
Presentation4 (2) survey responses clearly labelled
CaitlinCummins3
 
PEMATANG SIANTAR 0851/8063/4797 JUAL OBAT ABORSI CYTOTEC PEMATANG SIANTAR
PEMATANG SIANTAR 0851/8063/4797 JUAL OBAT ABORSI CYTOTEC PEMATANG SIANTARPEMATANG SIANTAR 0851/8063/4797 JUAL OBAT ABORSI CYTOTEC PEMATANG SIANTAR
PEMATANG SIANTAR 0851/8063/4797 JUAL OBAT ABORSI CYTOTEC PEMATANG SIANTAR
doktercalysta
 
Apotik Jual Obat Aborsi asli Mataram, Wa : 085180626899 - Penjual obat Cytote...
Apotik Jual Obat Aborsi asli Mataram, Wa : 085180626899 - Penjual obat Cytote...Apotik Jual Obat Aborsi asli Mataram, Wa : 085180626899 - Penjual obat Cytote...
Apotik Jual Obat Aborsi asli Mataram, Wa : 085180626899 - Penjual obat Cytote...
jual Obat Aborsi Bandung, Wa : 085180626899 Apotik jual Obat Cytotec Di Bandung
 
zidauu _business communication.pptx /pdf
zidauu _business  communication.pptx /pdfzidauu _business  communication.pptx /pdf
zidauu _business communication.pptx /pdf
zukhrafshabbir
 
(( wa 0851/7541/5434 )) Jual Obat Aborsi Di Surabaya - Cytotec Misoprostol 20...
(( wa 0851/7541/5434 )) Jual Obat Aborsi Di Surabaya - Cytotec Misoprostol 20...(( wa 0851/7541/5434 )) Jual Obat Aborsi Di Surabaya - Cytotec Misoprostol 20...
(( wa 0851/7541/5434 )) Jual Obat Aborsi Di Surabaya - Cytotec Misoprostol 20...
Spesiialis Kandungan BPOM
 
Powerpoint showing results from tik tok metrics
Powerpoint showing results from tik tok metricsPowerpoint showing results from tik tok metrics
Powerpoint showing results from tik tok metrics
CaitlinCummins3
 

Recently uploaded (20)

wagamamaLab presentation @MIT 20240509 IRODORI
wagamamaLab presentation @MIT 20240509 IRODORIwagamamaLab presentation @MIT 20240509 IRODORI
wagamamaLab presentation @MIT 20240509 IRODORI
 
Presentation4 (2) survey responses clearly labelled
Presentation4 (2) survey responses clearly labelledPresentation4 (2) survey responses clearly labelled
Presentation4 (2) survey responses clearly labelled
 
Stages of Startup Funding - An Explainer
Stages of Startup Funding - An ExplainerStages of Startup Funding - An Explainer
Stages of Startup Funding - An Explainer
 
PEMATANG SIANTAR 0851/8063/4797 JUAL OBAT ABORSI CYTOTEC PEMATANG SIANTAR
PEMATANG SIANTAR 0851/8063/4797 JUAL OBAT ABORSI CYTOTEC PEMATANG SIANTARPEMATANG SIANTAR 0851/8063/4797 JUAL OBAT ABORSI CYTOTEC PEMATANG SIANTAR
PEMATANG SIANTAR 0851/8063/4797 JUAL OBAT ABORSI CYTOTEC PEMATANG SIANTAR
 
Exploring-Pipe-Flanges-Applications-Types-and-Benefits.pptx
Exploring-Pipe-Flanges-Applications-Types-and-Benefits.pptxExploring-Pipe-Flanges-Applications-Types-and-Benefits.pptx
Exploring-Pipe-Flanges-Applications-Types-and-Benefits.pptx
 
Copyright: What Creators and Users of Art Need to Know
Copyright: What Creators and Users of Art Need to KnowCopyright: What Creators and Users of Art Need to Know
Copyright: What Creators and Users of Art Need to Know
 
Raising Seed Capital by Steve Schlafman at RRE Ventures
Raising Seed Capital by Steve Schlafman at RRE VenturesRaising Seed Capital by Steve Schlafman at RRE Ventures
Raising Seed Capital by Steve Schlafman at RRE Ventures
 
Top^Clinic ^%[+27785538335__Safe*Women's clinic//Abortion Pills In Harare
Top^Clinic ^%[+27785538335__Safe*Women's clinic//Abortion Pills In HarareTop^Clinic ^%[+27785538335__Safe*Women's clinic//Abortion Pills In Harare
Top^Clinic ^%[+27785538335__Safe*Women's clinic//Abortion Pills In Harare
 
How to refresh to be fit for the future world
How to refresh to be fit for the future worldHow to refresh to be fit for the future world
How to refresh to be fit for the future world
 
Guide to Networking Essentials 8th Edition by Greg Tomsho solution manual.doc
Guide to Networking Essentials 8th Edition by Greg Tomsho solution manual.docGuide to Networking Essentials 8th Edition by Greg Tomsho solution manual.doc
Guide to Networking Essentials 8th Edition by Greg Tomsho solution manual.doc
 
1Q24_EN hyundai capital 1q performance
1Q24_EN   hyundai capital 1q performance1Q24_EN   hyundai capital 1q performance
1Q24_EN hyundai capital 1q performance
 
Apotik Jual Obat Aborsi asli Mataram, Wa : 085180626899 - Penjual obat Cytote...
Apotik Jual Obat Aborsi asli Mataram, Wa : 085180626899 - Penjual obat Cytote...Apotik Jual Obat Aborsi asli Mataram, Wa : 085180626899 - Penjual obat Cytote...
Apotik Jual Obat Aborsi asli Mataram, Wa : 085180626899 - Penjual obat Cytote...
 
NFS- Operations Presentation - Recurrent
NFS- Operations Presentation - RecurrentNFS- Operations Presentation - Recurrent
NFS- Operations Presentation - Recurrent
 
zidauu _business communication.pptx /pdf
zidauu _business  communication.pptx /pdfzidauu _business  communication.pptx /pdf
zidauu _business communication.pptx /pdf
 
(( wa 0851/7541/5434 )) Jual Obat Aborsi Di Surabaya - Cytotec Misoprostol 20...
(( wa 0851/7541/5434 )) Jual Obat Aborsi Di Surabaya - Cytotec Misoprostol 20...(( wa 0851/7541/5434 )) Jual Obat Aborsi Di Surabaya - Cytotec Misoprostol 20...
(( wa 0851/7541/5434 )) Jual Obat Aborsi Di Surabaya - Cytotec Misoprostol 20...
 
Daftar Rumpun, Pohon, dan Cabang Ilmu (2024).pdf
Daftar Rumpun, Pohon, dan Cabang Ilmu (2024).pdfDaftar Rumpun, Pohon, dan Cabang Ilmu (2024).pdf
Daftar Rumpun, Pohon, dan Cabang Ilmu (2024).pdf
 
5 Brilliant Ways To Buy Verified Payoneer Accounts In 2024
5 Brilliant Ways To Buy Verified Payoneer Accounts In 20245 Brilliant Ways To Buy Verified Payoneer Accounts In 2024
5 Brilliant Ways To Buy Verified Payoneer Accounts In 2024
 
WAM Corporate Presentation May 2024_w.pdf
WAM Corporate Presentation May 2024_w.pdfWAM Corporate Presentation May 2024_w.pdf
WAM Corporate Presentation May 2024_w.pdf
 
Powerpoint showing results from tik tok metrics
Powerpoint showing results from tik tok metricsPowerpoint showing results from tik tok metrics
Powerpoint showing results from tik tok metrics
 
Global Internal Audit Standards 2024.pdf
Global Internal Audit Standards 2024.pdfGlobal Internal Audit Standards 2024.pdf
Global Internal Audit Standards 2024.pdf
 

Featured

How Race, Age and Gender Shape Attitudes Towards Mental Health
How Race, Age and Gender Shape Attitudes Towards Mental HealthHow Race, Age and Gender Shape Attitudes Towards Mental Health
How Race, Age and Gender Shape Attitudes Towards Mental Health
ThinkNow
 
Social Media Marketing Trends 2024 // The Global Indie Insights
Social Media Marketing Trends 2024 // The Global Indie InsightsSocial Media Marketing Trends 2024 // The Global Indie Insights
Social Media Marketing Trends 2024 // The Global Indie Insights
Kurio // The Social Media Age(ncy)
 

Featured (20)

2024 State of Marketing Report – by Hubspot
2024 State of Marketing Report – by Hubspot2024 State of Marketing Report – by Hubspot
2024 State of Marketing Report – by Hubspot
 
Everything You Need To Know About ChatGPT
Everything You Need To Know About ChatGPTEverything You Need To Know About ChatGPT
Everything You Need To Know About ChatGPT
 
Product Design Trends in 2024 | Teenage Engineerings
Product Design Trends in 2024 | Teenage EngineeringsProduct Design Trends in 2024 | Teenage Engineerings
Product Design Trends in 2024 | Teenage Engineerings
 
How Race, Age and Gender Shape Attitudes Towards Mental Health
How Race, Age and Gender Shape Attitudes Towards Mental HealthHow Race, Age and Gender Shape Attitudes Towards Mental Health
How Race, Age and Gender Shape Attitudes Towards Mental Health
 
AI Trends in Creative Operations 2024 by Artwork Flow.pdf
AI Trends in Creative Operations 2024 by Artwork Flow.pdfAI Trends in Creative Operations 2024 by Artwork Flow.pdf
AI Trends in Creative Operations 2024 by Artwork Flow.pdf
 
Skeleton Culture Code
Skeleton Culture CodeSkeleton Culture Code
Skeleton Culture Code
 
PEPSICO Presentation to CAGNY Conference Feb 2024
PEPSICO Presentation to CAGNY Conference Feb 2024PEPSICO Presentation to CAGNY Conference Feb 2024
PEPSICO Presentation to CAGNY Conference Feb 2024
 
Content Methodology: A Best Practices Report (Webinar)
Content Methodology: A Best Practices Report (Webinar)Content Methodology: A Best Practices Report (Webinar)
Content Methodology: A Best Practices Report (Webinar)
 
How to Prepare For a Successful Job Search for 2024
How to Prepare For a Successful Job Search for 2024How to Prepare For a Successful Job Search for 2024
How to Prepare For a Successful Job Search for 2024
 
Social Media Marketing Trends 2024 // The Global Indie Insights
Social Media Marketing Trends 2024 // The Global Indie InsightsSocial Media Marketing Trends 2024 // The Global Indie Insights
Social Media Marketing Trends 2024 // The Global Indie Insights
 
Trends In Paid Search: Navigating The Digital Landscape In 2024
Trends In Paid Search: Navigating The Digital Landscape In 2024Trends In Paid Search: Navigating The Digital Landscape In 2024
Trends In Paid Search: Navigating The Digital Landscape In 2024
 
5 Public speaking tips from TED - Visualized summary
5 Public speaking tips from TED - Visualized summary5 Public speaking tips from TED - Visualized summary
5 Public speaking tips from TED - Visualized summary
 
ChatGPT and the Future of Work - Clark Boyd
ChatGPT and the Future of Work - Clark Boyd ChatGPT and the Future of Work - Clark Boyd
ChatGPT and the Future of Work - Clark Boyd
 
Getting into the tech field. what next
Getting into the tech field. what next Getting into the tech field. what next
Getting into the tech field. what next
 
Google's Just Not That Into You: Understanding Core Updates & Search Intent
Google's Just Not That Into You: Understanding Core Updates & Search IntentGoogle's Just Not That Into You: Understanding Core Updates & Search Intent
Google's Just Not That Into You: Understanding Core Updates & Search Intent
 
How to have difficult conversations
How to have difficult conversations How to have difficult conversations
How to have difficult conversations
 
Introduction to Data Science
Introduction to Data ScienceIntroduction to Data Science
Introduction to Data Science
 
Time Management & Productivity - Best Practices
Time Management & Productivity -  Best PracticesTime Management & Productivity -  Best Practices
Time Management & Productivity - Best Practices
 
The six step guide to practical project management
The six step guide to practical project managementThe six step guide to practical project management
The six step guide to practical project management
 
Beginners Guide to TikTok for Search - Rachel Pearson - We are Tilt __ Bright...
Beginners Guide to TikTok for Search - Rachel Pearson - We are Tilt __ Bright...Beginners Guide to TikTok for Search - Rachel Pearson - We are Tilt __ Bright...
Beginners Guide to TikTok for Search - Rachel Pearson - We are Tilt __ Bright...
 

Stock Research Report for PG as of 6/23/11 - Chaikin Power Tools

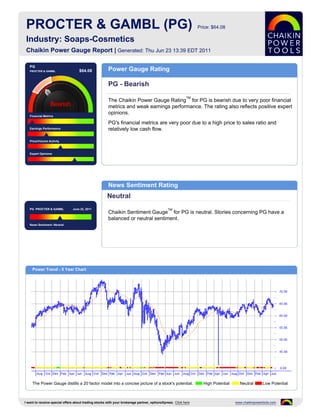
  • 1. PROCTER & GAMBL (PG) Price: $64.08 Industry: Soaps-Cosmetics Chaikin Power Gauge Report | Generated: Thu Jun 23 13:39 EDT 2011 PG PROCTER & GAMBL $64.08 Power Gauge Rating PG - Bearish TM The Chaikin Power Gauge Rating for PG is bearish due to very poor financial metrics and weak earnings performance. The rating also reflects positive expert opinions. Financial Metrics PG's financial metrics are very poor due to a high price to sales ratio and Earnings Performance relatively low cash flow. Price/Volume Activity Expert Opinions News Sentiment Rating Neutral PG PROCTER & GAMBL June 22, 2011 TM Chaikin Sentiment Gauge for PG is neutral. Stories concerning PG have a balanced or neutral sentiment. News Sentiment :Neutral Power Trend - 5 Year Chart The Power Gauge distills a 20 factor model into a concise picture of a stock's potential. High Potential Neutral Low Potential I want to receive special offers about trading stocks with your brokerage partner, optionsXpress. Click here www.chaikinpowertools.com
  • 2. Financials & Earnings Financial Metrics Financial Metrics Rating LT Debt/Equity Ratio Very Bearish Price to Book Value PG's financial metrics are very poor. The company has relatively low revenue per share and generates relatively low free cash flow relative to market capitalization. Return on Equity The rank is based on a high price to book value ratio, high return on equity, high price to sales ratio and relatively low cash flow. Price to Sales Ratio Business Value Assets and Liabilities Valuation Returns Ratio TTM Ratio TTM Ratio TTM Current Ratio 0.83 Price/Book 2.71 Return on Invest 13.5% LT Debt/Equity 0.36 Price/Sales 2.27 Return on Equity 18.3% Earnings Performance Earnings Performance Rating Earnings Growth Bearish Earnings Surprise PG's earnings performance has been weak. The company has not met analysts' earnings estimates and experienced relatively poor earnings growth in the past 12 months. Earnings Trend The rank is based on worse than expected earnings in recent quarters, a Projected P/E Ratio relatively poor trend in earnings this year, a relatively high projected P/E ratio and consistent earnings over the past 5 years. Earnings Consistency 5 Year Revenue and Earnings Growth EPS Estimates 06/06 06/07 06/08 06/09 06/10 Factor Actual EPS Prev EST EPS Current Change Revenue(M) 68,222.00 76,476.00 83,503.00 79,029.00 78,938.00 Quarterly EPS $0.74 $0.82 +0.08 Rev % Growth 20.23% 12.10% 9.19% -5.36% -0.12% Yearly EPS $4.32 $3.93 -0.39 EPS $2.79 $3.22 $3.86 $4.49 $4.32 Factor Actual EPS Growth Est EPS Growth Change EPS % Growth -1.41% 15.41% 19.88% 16.32% -3.79% 3-5 year EPS 7.21% 9.40% +2.19 EPS Surprise EPS Quarterly Results Estimate Actual Difference % Difference FY Qtr 1 Qtr 2 Qtr 3 Qtr 4 Total Latest Qtr $0.97 $0.96 $-0.01 -1.03 06/09 $1.10 $1.68 $0.88 $0.80 $4.46 1 Qtr Ago $1.10 $1.13 $0.03 2.73 06/10 $1.11 $1.58 $0.88 $0.74 $4.31 2 Qtr Ago $1.00 $1.02 $0.02 2.00 06/11 $1.07 $1.17 $1.01 - - 3 Qtr Ago $0.73 $0.71 $-0.02 -2.74 Fiscal Year End Month is June. I want to receive special offers about trading stocks with your brokerage partner, optionsXpress. Click here www.chaikinpowertools.com
  • 3. Price Trend & Expert Opinions Price/Volume Activity Price/Volume Activity Rating Relative Strength vs Market Neutral Chaikin Money Flow Price and volume activity for PG is neutral. PG is experiencing sustained buying and is in a decelerating price trend compared to 4 months ago. Price Trend The rank for PG is based on positive Chaikin money flow and a negative Chaikin Price Trend ROC price trend ROC. Volume Trend Relative Strength vs S&P500 Index Chaikin Money Flow Chart shows whether PG is performing better or worse than the market. Chaikin Money Flow analyzes supply and demand for a company's stock. Price Activity Price Activity Volume Activity Factor Value Factor Value Factor Value 52 Week High 67.46 % Change Price - 4 Weeks -3.50% Average Volume 20 Days 8,770,350 52 Week Low 59.34 % Change Price - 24 Weeks -1.14% Average Volume 90 Days 9,965,367 % Change YTD Rel S&P 500 -0.54% % Change Price - 4 Wks Rel to S&P -1.00% Chaikin Money Flow Persistency 71% % Change Price - 24 Wks Rel to S&P -1.95% Expert Opinions Expert Opinions Earnings Estimate Revisions Bullish Short Interest Expert opinions about PG are positive. Shorting of PG is low and analysts's opinions on PG have been more positive recently. Insider Activity The rank for PG is based on analysts revising earnings estimates downward, a low short interest ratio, insiders purchasing stock and optimistic analyst opinions. Analyst Opinions Relative Strength vs Industry Earnings Estimate Revisions Analyst Recommendations EPS Estimates Revision Summary Current 7 Days Ago % Change Factor Value Last Week Last 4 Weeks Current Qtr 0.82 0.82 0.00% Mean this Week Buy Up Down Up Down Next Qtr 1.14 1.14 0.00% Mean Last Week Buy Curr Qtr 0 0 0 1 Curr Yr 0 0 0 1 Current 30 Days Ago % Change Change 0.00 Next Qtr 0 0 1 0 Current FY 3.93 3.93 0.00 Mean 5 Weeks Ago Buy Next Yr 0 0 0 2 I want to receive special offers about trading stocks with your brokerage partner, optionsXpress. Click here www.chaikinpowertools.com
  • 4. The Company & Its Competitors PG's Competitors in Soaps-Cosmetics News Headlines for PG Company Power Historic EPS Projected EPS Profit Margin PEG PE Revenue(M) TPR Holdings Acquires Controlling Interest In Gauge growth growth Oscar Blandi Hair Care Brand - Jun 13, 2011 PG 7.21% 9.40% 14.23% 1.74 16.77 78,938 Business Highlights - Jun 10, 2011 OBCI 9.44% - 7.60% - 12.42 27 WildTangent to Launch Unprecedented Android Game Service With T M - Jun 8, 2011 CL 6.55% 8.80% 15.40% 1.99 18.31 15,564 Diamond Foods posts 3Q profit - Jun 2, 2011 CHD 8.41% 12.00% 10.56% 1.58 20.32 2,589 CA P&G Salon Romijn 05 18 - May 18, 2011 ZEP 0.32% - 2.33% - 16.92 569 CLX 4.78% 9.67% 10.61% 1.80 16.73 5,534 Company Details Company Profile PROCTER & GAMBL The Procter & Gamble Company manufactures and markets a broad range of consumer ONE PROCTER & GAMBLE products in many countries throughout the world. Products fall into five business PLAZA segments: fabric and home care, paper, beauty care, health care, and food and CINCINNATI, OH 45202 beverage. Today, P&G markets more than 250 products to more than five billion USA consumers in 130 countries. Phone: 5139831100 Fax: 513-983-4381 Website: http://http://www.pg.com Full Time Employees: 127,000 Sector: Consumer Staples Power Gauge Ratings are created using a relative ranking system that assigns a rank of 0 to 100 (100 being the highest) to each stock in the universe. Rank is calculated by evaluating each of the stocks factors and combining them into a single number using a weighting formula. A stock's rank ranges from 100-0, where 100 is the strongest, and a rank of 95 indicates the stock is better than 95% of the stocks in the universe. Chaikin Stock Research(CSR) is not registered as a securities broker dealer or investment advisor with either the U.S. Securities and Exchange Commission or with any state securities regulatory authority. CSR is not responsible for trades executed by users of this research report, our web site or mobile app based on the information included herein. The information presented in this report does not represent a recommendation to buy or sell stocks or any financial instrument nor is it intended as an endorsement of any security or investment. The information in this report is generic by nature and is not personalized to the specific financial situation of any individual. The user bears complete responsibility for their own investment research and should seek the advice of a qualified investment professional before making any investment decisions. Copyright (c) 1978-(Present) by ZACKS Investment Research, Inc ("ZACKS"). The information, data, analyses and opinions contained herein (1) includes the confidential and proprietary information of ZACKS, (2) may not be copied or redistributed, for any purpose, (3) does not constitute investment advice offered by ZACKS, (4) are provided solely for informational purposes, and (5) are not warranted or represented to be correct, complete, accurate or timely. ZACKS shall not be responsible for investment decisions, damages or other losses resulting from, or related to, use of this information, data, analyses or opinions. Past performance is no guarantee of future performance. ZACKS is not affiliated with Chaikin Power Tools. This report from Chaikin Power Tools is for informational purposes only and is not a recommendation to buy or sell securities. LM 2.3 DS 3.0 LS 2.1 Data Provided by ZACKS Investment Research, Inc., www.zacks.com Special offers to trade stocks from optionsXpress: www.chaikinpowertools.com