Stock Research Report for EMC as of 7/8/11 - Chaikin Power Tools
•
0 gefällt mir•98 views

To order a free Chaikin Power Gauge stock research report for EMC go to http://www.chaikinpowertools.com/reports

Empfohlen
Empfohlen
Weitere ähnliche Inhalte
Kürzlich hochgeladen
Kürzlich hochgeladen (20)
Empfohlen
Empfohlen (20)
Stock Research Report for EMC as of 7/8/11 - Chaikin Power Tools
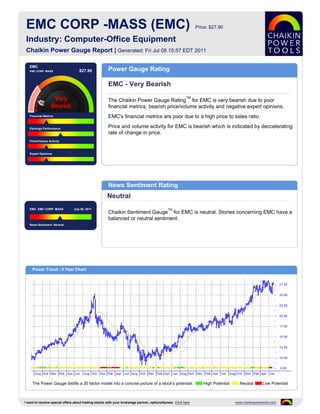
- 1. EMC CORP -MASS (EMC) Price: $27.90 Industry: Computer-Office Equipment Chaikin Power Gauge Report | Generated: Fri Jul 08 15:57 EDT 2011 EMC EMC CORP -MASS $27.90 Power Gauge Rating EMC - Very Bearish TM The Chaikin Power Gauge Rating for EMC is very bearish due to poor financial metrics, bearish price/volume activity and negative expert opinions. Financial Metrics EMC's financial metrics are poor due to a high price to sales ratio. Earnings Performance Price and volume activity for EMC is bearish which is indicated by deccelerating rate of change in price. Price/Volume Activity Expert Opinions News Sentiment Rating Neutral EMC EMC CORP -MASS July 06, 2011 TM Chaikin Sentiment Gauge for EMC is neutral. Stories concerning EMC have a balanced or neutral sentiment. News Sentiment :Neutral Power Trend - 5 Year Chart The Power Gauge distills a 20 factor model into a concise picture of a stock's potential. High Potential Neutral Low Potential I want to receive special offers about trading stocks with your brokerage partner, optionsXpress. Click here www.chaikinpowertools.com
- 2. Financials & Earnings Financial Metrics Financial Metrics Rating LT Debt/Equity Ratio Bearish Price to Book Value EMC's financial metrics are poor. The company has relatively low revenue per share and may be overvalued. Return on Equity The rank is based on a high price to book value ratio and high price to sales ratio. Price to Sales Ratio Business Value Assets and Liabilities Valuation Returns Ratio TTM Ratio TTM Ratio TTM Current Ratio 1.09 Price/Book 3.14 Return on Invest 12.1% LT Debt/Equity 0.01 Price/Sales 3.37 Return on Equity 13.3% Earnings Performance Earnings Performance Rating Earnings Growth Neutral Earnings Surprise EMC's earnings performance has been neutral. The company experienced superior earnings growth in the past 12 months and has not met analysts' earnings estimates. Earnings Trend The rank is based on worse than expected earnings in recent quarters, an Projected P/E Ratio upward trend in earnings this year, a relatively high projected P/E ratio and consistent earnings over the past 5 years. Earnings Consistency 5 Year Revenue and Earnings Growth EPS Estimates 12/06 12/07 12/08 12/09 12/10 Factor Actual EPS Prev EST EPS Current Change Revenue(M) 11,155.09 13,230.20 14,876.16 14,025.91 17,015.13 Quarterly EPS $0.23 $0.29 +0.06 Rev % Growth 15.43% 18.60% 12.44% -5.72% 21.31% Yearly EPS $0.92 $1.20 +0.28 EPS $0.54 $0.80 $0.66 $0.56 $0.92 Factor Actual EPS Growth Est EPS Growth Change EPS % Growth 12.50% 48.15% -17.50% -15.15% 64.29% 3-5 year EPS 12.41% 14.13% +1.72 EPS Surprise EPS Quarterly Results Estimate Actual Difference % Difference FY Qtr 1 Qtr 2 Qtr 3 Qtr 4 Total Latest Qtr $0.25 $0.24 $-0.01 -4.00 12/09 $0.10 $0.10 $0.15 $0.21 $0.56 1 Qtr Ago $0.35 $0.36 $0.01 2.86 12/10 $0.18 $0.21 $0.23 $0.30 $0.92 2 Qtr Ago $0.24 $0.25 $0.01 4.17 12/11 $0.23 - - - - 3 Qtr Ago $0.22 $0.23 $0.01 4.55 Fiscal Year End Month is December. I want to receive special offers about trading stocks with your brokerage partner, optionsXpress. Click here www.chaikinpowertools.com
- 3. Price Trend & Expert Opinions Price/Volume Activity Price/Volume Activity Rating Relative Strength vs Market Bearish Chaikin Money Flow Price and volume activity for EMC is bearish. EMC is in a decelerating price trend compared to 4 months ago and is trading on lower volume than its 90 day Price Trend average volume. Price Trend ROC The rank for EMC is based on its price strength versus the market, positive Chaikin money flow, a negative Chaikin price trend ROC and a decreasing volume trend. Volume Trend Relative Strength vs S&P500 Index Chaikin Money Flow Chart shows whether EMC is performing better or worse than the market. Chaikin Money Flow analyzes supply and demand for a company's stock. Price Activity Price Activity Volume Activity Factor Value Factor Value Factor Value 52 Week High 28.47 % Change Price - 4 Weeks 3.64% Average Volume 20 Days 17,743,340 52 Week Low 18.05 % Change Price - 24 Weeks 16.99% Average Volume 90 Days 19,355,691 % Change YTD Rel S&P 500 14.09% % Change Price - 4 Wks Rel to S&P -1.28% Chaikin Money Flow Persistency 68% % Change Price - 24 Wks Rel to S&P 10.68% Expert Opinions Expert Opinions Earnings Estimate Revisions Bearish Short Interest Expert opinions about EMC are negative. Insiders are not net buyers of EMC's stock and analysts are lowering their EPS estimates for EMC. Insider Activity The rank for EMC is based on insiders not purchasing significant amounts of stock and optimistic analyst opinions. Analyst Opinions Relative Strength vs Industry Earnings Estimate Revisions Analyst Recommendations EPS Estimates Revision Summary Current 7 Days Ago % Change Factor Value Last Week Last 4 Weeks Current Qtr 0.27 0.27 0.00% Mean this Week Buy Up Down Up Down Next Qtr 0.29 0.29 0.00% Mean Last Week Buy Curr Qtr 0 0 0 0 Curr Yr 0 0 0 0 Current 30 Days Ago % Change Change 0.00 Next Qtr 0 0 0 0 Current FY 1.20 1.20 0.00 Mean 5 Weeks Ago Buy Next Yr 0 0 0 0 I want to receive special offers about trading stocks with your brokerage partner, optionsXpress. Click here www.chaikinpowertools.com
- 4. The Company & Its Competitors EMC's Competitors in Computer-Office Equipment News Headlines for EMC Company Power Historic EPS Projected EPS Profit Margin PEG PE Revenue(M) EMC Unveils Mobile User Interface for Apple Gauge growth growth iPad - May 11, 2011 EMC 12.41% 14.13% 11.30% 1.64 25.82 17,015 MA EMC Q1 earns 04 20 - Apr 20, 2011 NTAP 20.47% 17.88% 12.68% 1.41 31.52 5,123 EMC's First-Quarter 2011 Earnings Results Available on EMC.com - Apr 20, 2011 SMCI 25.94% 18.50% 4.21% 0.73 18.11 - EMC Acquires NetWitness - Apr 4, 2011 STX 7.16% 11.25% 7.16% 0.78 10.08 - EMC CEO awarded $12M pay package in 2010 TDC 5.85% 12.33% 14.85% 2.43 34.25 1,936 - Mar 3, 2011 WDC 24.52% 9.50% 8.76% 1.07 10.41 - XRTX 23.87% - 4.56% - 5.49 1,602 IMN 5.14% - -11.55% - 62.00 1,461 Company Details Company Profile EMC CORP -MASS EMC Corporation and its subsidiaries design, manufacture, market and support a wide 176 SOUTH STREET range of hardware and software products and provide services for the storage, HOPKINTON, MA 01748-9103 management, protection and sharing of electronic information. These integrated solutions USA enable organizations to create an enterprise information infrastructure, or what EMC calls Phone: 5082937208 an E-Infostructure. EMC is the leading supplier of these solutions, which comprise Fax: 508-435-5222 information storage systems, software and services. Website: http://http://www.emc.com Full Time Employees: 48,500 Sector: Computer and Technology Power Gauge Ratings are created using a relative ranking system that assigns a rank of 0 to 100 (100 being the highest) to each stock in the universe. Rank is calculated by evaluating each of the stocks factors and combining them into a single number using a weighting formula. A stock's rank ranges from 100-0, where 100 is the strongest, and a rank of 95 indicates the stock is better than 95% of the stocks in the universe. Chaikin Stock Research(CSR) is not registered as a securities broker dealer or investment advisor with either the U.S. Securities and Exchange Commission or with any state securities regulatory authority. CSR is not responsible for trades executed by users of this research report, our web site or mobile app based on the information included herein. The information presented in this report does not represent a recommendation to buy or sell stocks or any financial instrument nor is it intended as an endorsement of any security or investment. The information in this report is generic by nature and is not personalized to the specific financial situation of any individual. The user bears complete responsibility for their own investment research and should seek the advice of a qualified investment professional before making any investment decisions. Copyright (c) 1978-(Present) by ZACKS Investment Research, Inc ("ZACKS"). The information, data, analyses and opinions contained herein (1) includes the confidential and proprietary information of ZACKS, (2) may not be copied or redistributed, for any purpose, (3) does not constitute investment advice offered by ZACKS, (4) are provided solely for informational purposes, and (5) are not warranted or represented to be correct, complete, accurate or timely. ZACKS shall not be responsible for investment decisions, damages or other losses resulting from, or related to, use of this information, data, analyses or opinions. Past performance is no guarantee of future performance. ZACKS is not affiliated with Chaikin Power Tools. This report from Chaikin Power Tools is for informational purposes only and is not a recommendation to buy or sell securities. LM 2.3 DS 3.0 LS 2.1 Data Provided by ZACKS Investment Research, Inc., www.zacks.com Special offers to trade stocks from optionsXpress: www.chaikinpowertools.com