Stock Research Report for Armstrong World AWI as of 9/22/11 - Chaikin Power Tools
•
1 gefällt mir•196 views

To order a free Chaikin Power Gauge stock research report for AWI go to http://www.chaikinpowertools.com/reports

Empfohlen
Empfohlen
Weitere ähnliche Inhalte
Mehr von Dan Oconnor
Mehr von Dan Oconnor (9)
Kürzlich hochgeladen
Kürzlich hochgeladen (20)
Stock Research Report for Armstrong World AWI as of 9/22/11 - Chaikin Power Tools
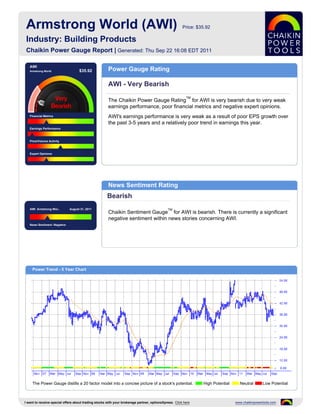
- 1. Armstrong World (AWI) Price: $35.92 Industry: Building Products Chaikin Power Gauge Report | Generated: Thu Sep 22 16:08 EDT 2011 AWI Armstrong World $35.92 Power Gauge Rating AWI - Very Bearish TM The Chaikin Power Gauge Rating for AWI is very bearish due to very weak earnings performance, poor financial metrics and negative expert opinions. Financial Metrics AWI's earnings performance is very weak as a result of poor EPS growth over the past 3-5 years and a relatively poor trend in earnings this year. Earnings Performance Price/Volume Activity Expert Opinions News Sentiment Rating Bearish AWI Armstrong Wor.. August 31, 2011 TM Chaikin Sentiment Gauge for AWI is bearish. There is currently a significant negative sentiment within news stories concerning AWI. News Sentiment :Negative Power Trend - 5 Year Chart The Power Gauge distills a 20 factor model into a concise picture of a stock's potential. High Potential Neutral Low Potential I want to receive special offers about trading stocks with your brokerage partner, optionsXpress. Click here www.chaikinpowertools.com
- 2. Financials & Earnings Financial Metrics Financial Metrics Rating LT Debt/Equity Ratio Bearish Price to Book Value AWI's financial metrics are poor. The company is carrying too much long term debt and yields a relatively low return on shareholder's equity. Return on Equity The rank is based on a high long term debt to equity ratio and low return on equity. Price to Sales Ratio Business Value Assets and Liabilities Valuation Returns Ratio TTM Ratio TTM Ratio TTM Current Ratio 2.90 Price/Book 1.78 Return on Invest 5.9% LT Debt/Equity 0.77 Price/Sales 0.76 Return on Equity 9.2% Earnings Performance Earnings Performance Rating Earnings Growth Very Bearish Earnings Surprise AWI's earnings performance has been very weak. The company has a history of weak earnings growth and experienced relatively poor earnings growth in the past 12 months. Earnings Trend The rank is based on poor EPS growth over the past 3-5 years, a relatively poor Projected P/E Ratio trend in earnings this year and inconsistent earnings over the past 5 years. Earnings Consistency 5 Year Revenue and Earnings Growth EPS Estimates 12/06 12/07 12/08 12/09 12/10 Factor Actual EPS Prev EST EPS Current Change Revenue(M) - 3,549.70 3,393.00 2,780.00 2,766.40 Quarterly EPS $0.43 $0.83 +0.40 Rev % Growth - - -4.41% -18.07% -0.49% Yearly EPS $0.19 $2.46 +2.27 EPS - $2.60 $1.44 $1.36 $0.19 Factor Actual EPS Growth Est EPS Growth Change EPS % Growth - - -44.62% -5.56% -86.03% 3-5 year EPS -7.66% 21.45% +29.11 EPS Surprise EPS Quarterly Results Estimate Actual Difference % Difference FY Qtr 1 Qtr 2 Qtr 3 Qtr 4 Total Latest Qtr $0.71 $0.70 $-0.01 -1.41 12/09 $-0.20 $0.50 $1.13 $-0.07 $1.36 1 Qtr Ago $0.37 $0.51 $0.14 37.84 12/10 $-0.34 $0.47 $0.43 $-0.36 $0.20 2 Qtr Ago $0.17 $0.11 $-0.06 -35.29 12/11 $0.23 $0.64 - - - 3 Qtr Ago $0.64 $0.77 $0.13 20.31 Fiscal Year End Month is December. I want to receive special offers about trading stocks with your brokerage partner, optionsXpress. Click here www.chaikinpowertools.com
- 3. Price Trend & Expert Opinions Price/Volume Activity Price/Volume Activity Rating Relative Strength vs Market Neutral Chaikin Money Flow Price and volume activity for AWI is neutral. AWI has outperformed the S&P 500 over 26 weeks and has underperformed the S&P 500 over 26 weeks. Price Trend Price Trend ROC Volume Trend Relative Strength vs S&P500 Index Chaikin Money Flow Chart shows whether AWI is performing better or worse than the market. Chaikin Money Flow analyzes supply and demand for a company's stock. Price Activity Price Activity Volume Activity Factor Value Factor Value Factor Value 52 Week High 53.55 % Change Price - 4 Weeks -5.07% Average Volume 20 Days 245,794 52 Week Low 32.80 % Change Price - 24 Weeks -24.40% Average Volume 90 Days 324,307 % Change YTD Rel S&P 500 -6.82% % Change Price - 4 Wks Rel to S&P -4.19% Chaikin Money Flow Persistency 43% % Change Price - 24 Wks Rel to S&P -13.47% Expert Opinions Expert Opinions Earnings Estimate Revisions Bearish Short Interest Expert opinions about AWI are negative. Analysts's opinions on AWI have been more negative recently and analysts are lowering their EPS estimates for AWI. Insider Activity The rank for AWI is based on analysts revising earnings estimates downward, insiders purchasing stock and pessimistic analyst opinions. Analyst Opinions Relative Strength vs Industry Earnings Estimate Revisions Analyst Recommendations EPS Estimates Revision Summary Current 7 Days Ago % Change Factor Value Last Week Last 4 Weeks Current Qtr 0.84 0.84 0.00% Mean this Week Strong Buy Up Down Up Down Next Qtr 0.40 0.41 -2.44% Mean Last Week Strong Buy Curr Qtr 0 1 0 1 Curr Yr 0 1 0 1 Current 30 Days Ago % Change Change 0.00 Next Qtr 0 2 0 2 Current FY 2.46 2.47 -0.01 Mean 5 Weeks Ago Strong Buy Next Yr 0 1 0 1 I want to receive special offers about trading stocks with your brokerage partner, optionsXpress. Click here www.chaikinpowertools.com
- 4. The Company & Its Competitors AWI's Competitors in Building Products News Headlines for AWI Company Power Historic EPS Projected EPS Profit Margin PEG PE Revenue(M) Armstrong, union file charges against each other Gauge growth growth - Aug 3, 2011 AWI -7.66% 21.45% 1.95% 0.68 17.12 2,766 Work begins on Armstrong Superfund site - Apr CRH 6.60% 24.44% - 0.55 - 22,806 21, 2011 Armstrong World Industries shares rise on OC 1.21% 25.25% 0.99% 0.42 16.83 4,997 upgrade - Mar 21, 2011 USG -9.55% - -13.49% - - 2,939 Armstrong World Industries Establishes a $100 Million Receivables Securitization Program - Dec URI -8.15% 12.00% 0.38% 0.96 26.06 2,237 14, 2010 MAS -9.33% 15.00% -14.39% 6.56 239.67 7,592 Profits plummet, investment returns on rise at Armstrong - Nov 6, 2010 Company Details Company Profile ARMSTRONG WORLD ARMSTRONG WORLD INDUSTRIES INC is a global leader in the design and 2500 COLUMBIA AVE manufacture of floors, ceilings and cabinets. Armstrongs consolidated net sales totaled LANCASTER, PA 17603 approximately $3.5 billion. Based in Lancaster,Armstrong operates Forty plants in ten USA countries. Phone: 7173970611 Fax: 717-396-6133 Website: http://http://www.armstrong.com Full Time Employees: 9,800 Sector: Construction Power Gauge Ratings are created using a relative ranking system that assigns a rank of 0 to 100 (100 being the highest) to each stock in the universe. Rank is calculated by evaluating each of the stocks factors and combining them into a single number using a weighting formula. A stock's rank ranges from 100-0, where 100 is the strongest, and a rank of 95 indicates the stock is better than 95% of the stocks in the universe. Chaikin Stock Research(CSR) is not registered as a securities broker dealer or investment advisor with either the U.S. Securities and Exchange Commission or with any state securities regulatory authority. CSR is not responsible for trades executed by users of this research report, our web site or mobile app based on the information included herein. The information presented in this report does not represent a recommendation to buy or sell stocks or any financial instrument nor is it intended as an endorsement of any security or investment. The information in this report is generic by nature and is not personalized to the specific financial situation of any individual. The user bears complete responsibility for their own investment research and should seek the advice of a qualified investment professional before making any investment decisions. Copyright (c) 1978-(Present) by ZACKS Investment Research, Inc ("ZACKS"). The information, data, analyses and opinions contained herein (1) includes the confidential and proprietary information of ZACKS, (2) may not be copied or redistributed, for any purpose, (3) does not constitute investment advice offered by ZACKS, (4) are provided solely for informational purposes, and (5) are not warranted or represented to be correct, complete, accurate or timely. ZACKS shall not be responsible for investment decisions, damages or other losses resulting from, or related to, use of this information, data, analyses or opinions. Past performance is no guarantee of future performance. ZACKS is not affiliated with Chaikin Power Tools. This report from Chaikin Power Tools is for informational purposes only and is not a recommendation to buy or sell securities. LM 2.3 DS 3.0 LS 2.1 Data Provided by ZACKS Investment Research, Inc., www.zacks.com Special offers to trade stocks from optionsXpress: www.chaikinpowertools.com