Models Used by the Military Services to Develop Budgets for Activities Associated with Operational Readiness
•
2 gefällt mir•5,394 views


Empfohlen
Weitere ähnliche Inhalte
Andere mochten auch
Andere mochten auch (17)
Ähnlich wie Models Used by the Military Services to Develop Budgets for Activities Associated with Operational Readiness
Ähnlich wie Models Used by the Military Services to Develop Budgets for Activities Associated with Operational Readiness (16)
Mehr von Congressional Budget Office
Mehr von Congressional Budget Office (20)
Models Used by the Military Services to Develop Budgets for Activities Associated with Operational Readiness
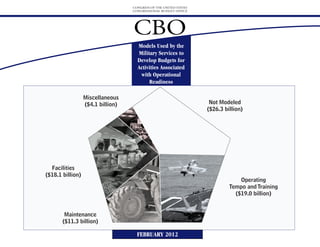
- 1. CONGRESS OF THE UNITED STATES CONGRESSIONAL BUDGET OFFICE CBO Models Used by the Military Services to Develop Budgets for Activities Associated with Operational Readiness Miscellaneous ($4.1 billion) Not Modeled ($26.3 billion) Facilities ($18.1 billion) Operating Tempo and Training ($19.0 billion) Maintenance ($11.3 billion) FEBRUARY 2012
- 3. CBO Models Used by the Military Services to Develop Budgets for Activities Associated with Operational Readiness February 2012 The Congress of the United States O Congressional Budget Office
- 4. Notes Unless otherwise indicated, all years referred to in this study are fiscal years, and all dollar amounts are in 2012 dollars. Numbers in the text and tables may not add up to totals because of rounding. The cover shows the following images (clockwise from bottom right): F/A-18F Super Hornet, photo by Communication Specialist 1st Class Jose Lopez Jr.; maintenance soldiers from Troop E, 2nd Squadron, 6th Cavalry Regiment, photo by Sgt. 1st Class Tyrone C. Marshall Jr., Task Force Wings Public Affairs; Marines in the Marine Corps Air Station Futenma mess hall, photo by Lance Cpl. Courtney G. White; and the 50th Anniversary Air Force Sergeants Association forum in San Antonio, Texas, photo by Tech. Sgt. Rey Ramon. CBO
- 5. Preface The military services (the Army, Navy, Air Force, and Marine Corps) use modeling techniques to inform parts of their annual budget requests. As directed by the Congress in the 2011 National Defense Authorization Act, this Congressional Budget Office (CBO) report provides information on the models used to develop budgets for activities that help to achieve operational readiness. In consultation with staff from the House and Senate Armed Services Committees, CBO focused on identifying models used in the operating forces category within the services’ operation and maintenance accounts. In keeping with CBO’s mandate to provide objective, impartial analysis, this report makes no recommendations. The report was prepared by Adebayo Adedeji, Daniel Frisk, and Derek Trunkey of CBO’s National Security Division under the supervision of Matthew Goldberg and David Mosher. CBO staff members Elizabeth Cove Delisle, Jason Wheelock, and William Ma provided helpful comments. Jeanine Rees edited the document, with assistance from John Skeen. Maureen Costantino designed the cover, and Jeanine Rees prepared the document for publication. Monte Ruffin produced the initial printed copies, and Linda Schimmel handled the print distribution. The report is available on the agency’s Web site (www.cbo.gov). Douglas W. Elmendorf Director February 2012 CBO
- 7. List of Exhibits Exhibit Page 1. Modeled and Unmodeled Activities Within the Military Services’ Operation and Maintenance Budget 5 2. Selected Methods Used by the Services to Develop Their Budgets for Operating Forces 6 3. Modeling of Budget Requests for Operating Forces, by Service and Function 7 4. Modeled Percentage of Operating Forces Budgets, by Service and Function 8 Models Used by Each Service 5. Modeled Amounts of the Navy’s Budget Request for Operating Forces 10 6. Modeled Amounts of the Army’s Budget Request for Operating Forces 11 7. Modeled Amounts of the Air Force’s Budget Request for Operating Forces 12 8. Modeled Amounts of the Marine Corps’ Budget Request for Operating Forces 13 Models for Operating Tempo and Training Functions 9. Modeling of Budgets for Operating Tempo and Training, by Service 15 10. The Navy’s Fleet Response Plan Cycle for Surface Combatants 16 11. Length of Fleet Response Plan Cycles for Selected Navy Units 17 12. The Navy’s Ship Operations Model 18 13. The Methodological Approach of the Navy and Marine Corps’ Flying Hour Requirements Model 19 14. Components of Cost per Flying Hour in the Navy and Marine Corps’ Flying Hour Requirements Model 20 15. The Army’s Force Generation Cycle 21 CBO
- 8. LIST OF EXHIBITS MODELS USED BY THE MILITARY SERVICES TO DEVELOP BUDGETS FOR ACTIVITIES ASSOCIATED WITH OPERATIONAL READINESS 2 Exhibit Page Number 16. The Army’s Model for Calculating Direct Costs for Unit Operating Tempo and Training 22 17. The Army’s Model for Calculating Indirect Costs for Unit Operating Tempo and Training 23 18. The Air Force’s Flying Hours Model 24 Models for Facilities and Maintenance Functions 19. Modeling of Budgets for Facilities and Maintenance, by Service 26 20. The Navy’s and Army’s Base Operating Support Models 27 21. OSD’s Facilities Sustainment Model for All Services 28 22. Modeling of Depot-Level Maintenance by All Services 29 CBO
- 9. Models Used by the Military Services to Develop Budgets for Activities Associated with Operational Readiness When developing their annual budgets, the mili- funds the department’s normal activities) and B Within the category of operating forces, all of tary services (the Army, Navy, Air Force, and $118 billion was for funding overseas contingency the services used models in forming all or Marine Corps) use models to estimate the quanti- operations in Afghanistan, Iraq, and elsewhere.2 almost all of their requests for funding for ties and costs of resources needed to carry out their CBO focused its analysis on the operating forces maintenance of equipment conducted at the missions.1 As directed by the Congress in the 2011 portion of services’ base budgets. In the 2012 depot level, and the services varied widely in the National Defense Authorization Act (Public Law request, that portion of the services’ base budgets degree to which they used models to generate 111-383, sec. 356), the Congressional Budget totaled $79 billion. The budget for operating their requests for funding for peacetime opera- Office (CBO) has examined the modeling tech- forces is the part of the operation and maintenance tions and training and for day-to-day operations niques the military services use to inform parts (O&M) budget most closely linked to operational and repairs at facilities and bases. of their annual budget requests, specifically, the readiness. Funds provided for operating forces pay models used “to determine funding levels for for the training of combat and support units, as operational readiness requirements.” Operational well as the operation of most service installations. CBO’s Analytic Approach readiness refers to the services’ ability to conduct CBO found that: To fulfill the Congress’s mandate, CBO examined military operations and meet the demands of the the operation and maintenance budget for each of National Military Strategy—an annual report by B Models informed about $53 billion, or two- the military services. The O&M budget amounts the Chairman of the Joint Chiefs of Staff that out- thirds, of the $79 billion request for funding for to just over one-third of the total base budget. It lines how the military will meet the strategic goals operating forces in 2012; pays for most of the day-to-day expenses of run- of the President and the Congress (and required ning the military, including the costs of training, B Depending on the military service, models under 10 U.S.C. section 153). fuel and power, operating facilities, maintaining informed anywhere from roughly 45 percent to equipment, and civilian salaries and benefits.3 The The Department of Defense’s (DoD’s) total budget roughly 80 percent of the total request for fund- O&M budget also pays for Defense-wide agencies request for fiscal year 2012 was $671 billion, of ing for operating forces; and and activities such as the Defense Finance and which $554 billion was for the base budget (which Accounting Service and the Defense Health 2. CBO’s analysis in this report is based on DoD’s submis- sion requesting its budget for fiscal year 2012. The Program.4 CBO excluded the Defense-wide part 1. The services develop their budgets using the planning, document providing the subsequent funding—title II of of the O&M budget from this analysis. programming, budgeting, and execution process. That the Department of Defense Appropriations Act, 2012 process is a mechanism for preparing the Department of (Division A of the Military Construction and Veterans Defense’s budget request for the Congress as well as for Affairs and Related Agencies Appropriations Act, 2012, 3. The remainder of the base budget pays for military “creating a long-range financial plan that relates defense P.L. 112-74)—contains insufficient detail for analysis. personnel, which represents about one-quarter of the total spending to assessments of potential military threats, as For example, the law gives the total appropriation budget; procurement, which is about one-fifth of the summarized in the President’s National Security Strategy amounts for operation and maintenance by military total; and research, development, test, and evaluation and the Quadrennial Defense Review.” For details, see service but offers no additional detail on the constituent (RDT&E), military construction, and family housing, http://comptroller.defense.gov/legislativeprocess.html. budget activities and subactivites. which together account for about one-sixth of the total. CBO
- 10. INTRODUCTION MODELS USED BY THE MILITARY SERVICES TO DEVELOP BUDGETS FOR ACTIVITIES ASSOCIATED WITH OPERATIONAL READINESS 2 Within the services’ O&M budgets, CBO concen- audit, or validate the services’ models or attempt to CBO attempted to link the services’ models to trated on the category covering operating forces, identify any deficiencies in them.6 In many cases, specific budgetary line items, known as subactivity labeled in budget justification materials as budget the methodologies are sufficiently complex and groups (SAGs), within O&M accounts. In many activity 01.5 The budget for operating forces is the data-intensive that a thorough analysis would cases, a model is used to inform the budget request largest piece of O&M, making up about two- require a separate study for each major model. for a single SAG, although in some cases, models thirds of the services’ O&M costs (excluding (such as the Army’s training model) are used to Defense-wide O&M funding). CBO considered The large assortment of activities covered in the inform the budget requests for multiple SAGs. only the components of the base budget used for O&M budget leads to a variety of budgeting meth- CBO classified the SAGs and their corresponding active-duty forces and not the components used for ods—including modeling—across the services and models into four groups on the basis of the type of the National Guard and reserves. across specific activities. For the purposes of this activity funded: operating tempo (optempo) and report, CBO defines a model as a set of mathemat- training, facilities, maintenance, and miscella- Because of the breadth of the O&M budget, CBO ical relationships or similar logical expressions that neous.7 The optempo and training SAGs support did not attempt to independently identify models link the amount of certain activities, such as train- units’ training activities such as steaming days for used in the formation of budget requests regarding ing and maintenance, to the cost of those activities. Navy ships and flying hours for the services’ avia- operating forces. Instead, CBO relied on the ser- For example, military training policy dictates the tion units.8 The facilities SAGs provide for the vices themselves to identify and characterize any number of training hours that a pilot must fly in day-to-day operations of installations and repairs models used for that purpose. As a result, this order to be ready to perform various tasks. Budget to facilities. The maintenance SAGs support analysis omits any models that the services did not models for flying hours calculate the quantities of depot-level maintenance of equipment and report. In addition, because the services were not fuel, spare parts, and other resources required per weapon systems. CBO categorized as able to identify any specific models used at lower hour of flight, and then apply historical cost factors miscellaneous any SAGs that are not clearly related organizational levels, CBO included only models to each of those resources to estimate the total cost to optempo and training, facilities, or that are used at the headquarters levels of the ser- per flying hour. In this report, CBO does not maintenance. vices. Therefore, although the services might build consider simple projections of historical budgets— some budget requests by aggregating the results which often involve simply applying inflation of models used at organizational levels below factors (or other assumed scaling factors) to the 7. DoD adopted the phrase “operations tempo” to refer to headquarters, such as individual commands or prior year’s budget—to be models. the pace of operations in terms of equipment usage, such installations, such models do not appear in this as aircraft flying hours or tank driving miles. As is com- analysis. Furthermore, CBO did not compare, mon in the military, the term became jargon: optempo. 6. In 2003, the Navy formally instituted a process to review See Jim Garamone, “Optempo, Perstempo: What They and evaluate its models used to develop budget requests. Mean,” American Forces Press Service, August 18, 1999. That process involves verification (whether the mathemat- 4. Agencies and activities within the Department of Defense More recently, DoD has switched to the term “operating ical equations for representing processes include all that are outside of the military services are contained tempo,” still shortened to optempo. See Department of relevant cost components and are correctly implemented within the Defense-wide budget. Defense Dictionary of Military and Associated Terms, Joint in software algorithms), validation (whether outputs from Publication 1-02, November 8, 2010, as amended 5. There are four budget activities in the services’ O&M the model accurately represent reality), and accreditation through October 15, 2011. budgets: budget activity 01 is operating forces, budget (whether the model meets established criteria and is activity 02 is mobilization, budget activity 03 is training certified as useful for a specified purpose). See Chief of 8. Actual military operations in a conflict are not included and recruiting, and budget activity 04 is administration Naval Operations Instruction OPNAVINST 5200.35, here because they are funded through separate requests, and servicewide activities. October 26, 2006, for more details. not through the base budget. CBO
- 11. INTRODUCTION MODELS USED BY THE MILITARY SERVICES TO DEVELOP BUDGETS FOR ACTIVITIES ASSOCIATED WITH OPERATIONAL READINESS 3 CBO’s Findings the headquarters level.9 All of the services model ing technique if the input data are inaccurate or the costs of facilities sustainment, and they all the mathematical relationships are not well under- CBO found that the share of the budget requests use the model created by the Office of the Sec- stood. Moreover, there are portions of the services’ for operating forces in 2012 that was informed by retary of Defense (OSD). The costs of restoring budgets where modeling is unnecessary, impracti- models varied considerably across the services, and modernizing facilities are modeled only by cal, or of limited benefit. For example, there is from about 45 percent to about 80 percent. In the Navy. usually little reason to model the amounts to be total, models informed roughly two-thirds, or used for contracted services, as those costs are $53 billion, of the $79 billion in that portion of CBO also found that the results of models are just largely dictated by the structure of the contracts the services’ base budget requests. The services one of many inputs to the budgeting process. and the bidding process rather than by DoD’s handle the different types of SAGs in different Other inputs include guidance from the Office of internal costs. ways: Management and Budget (OMB), the National B To estimate costs for optempo and training, all Military Strategy, individual program require- four services model some portion of their ments, and initiatives directed by the leadership About This Document requests for funding. For 2012, the Air Force’s of the military departments and DoD. DoD’s Exhibits 1 through 4 of this document summarize modeled portion of that function was the small- program and budget review process attempts to CBO’s findings. This section includes an overview est, 41 percent, and the Army’s was the largest, allocate the fixed overall funding amount that the of the services’ budgeting methods for operating 100 percent. The Navy and the Marine Corps’ President and OMB set for the Department. Mod- forces and a breakdown of modeling by type of portions are 74 percent and 79 percent, els inform decisions regarding resource allocation activity modeled. respectively. between competing areas of the budget, but they generally do not produce the final budget requests. Exhibits 5 through 8 examine the models each B All four services use models to determine Rather, the services often adjust the budget service uses and the budget subactivity groups each budget requests for depot-level maintenance amounts generated by models in order to address model influences. and to generate detailed schedules of the depots’ programmatic trade-offs, budget constraints, and other factors not included in the models. Exhibits 9 through 18 provide a brief overview of workload. the models the services use to estimate the cost of B Spending on facilities falls into three categories: CBO did not attempt to determine if budget optempo and training for their operational units. base operating support (the day-to-day expenses requests informed by the results of models are The discussion includes the processes the Navy and of facilities), facilities sustainment (periodic and superior to budget requests that do not involve any the Army use to prepare their units for possible preventative upkeep of facilities), and the resto- modeling input. Modeling can be a poor budget- deployment. ration and modernizing of facilities that have Exhibits 19 through 22 provide a brief description not been adequately sustained or that need 9. While the Air Force and the Marine Corps do not have base operating support models, they do use models to of the models the services use to estimate the cost reconfiguration. The costs of base operating of maintaining equipment and weapons and the inform their budget requests regarding civilian pay, which support are modeled by the Navy and the Army makes up more than one-third of their budgets for base cost of operating and repairing facilities. but not by the Air Force or the Marine Corps at operating support. CBO
- 13. MODELS USED BY THE MILITARY SERVICES TO DEVELOP BUDGETS FOR ACTIVITIES ASSOCIATED WITH OPERATIONAL READINESS 5 Exhibit 1. In consultation with staff from the House and Modeled and Unmodeled Activities Within the Military Services’ Senate Armed Services Committees, the Con- Operation and Maintenance Budget gressional Budget Office (CBO) focused on identifying budget models within the category of operating forces in the military services’ CBO’s Focus operation and maintenance (O&M) budgets. The services’ total 2012 budget request for O&M, excluding funding for Defense-wide Ship activities, was about $116 billion. About two- Operations Civilian Pay a thirds—$79 billion—of that request was for Depot budget activity 01 (operating forces), with the Maintenance remaining one-third covering budget activities 02, 03, and 04 (mobilization, training and recruiting, and administrative and servicewide Modeled activities, respectively). CBO’s focus in this Other report is on the portion of budget activity 01 Flying Hours that uses models at the headquarters level. Flying Hours Unknown Amount of That portion, represented by the dark shaded Army Modeling section in the illustration, was about Training Navy Transportation $53 billion in 2012 and represented roughly Miles two-thirds of the request for budget activity 01 and just under half of the total request for O&M excluding Defense-wide funding. Air Force Facilities The circles represent selected budget models, Marine including those mentioned in the Congress’s Not Corps tasking for this report from CBO in section Modeled Deployable 356 of the 2011 National Defense Authoriza- Days tion Act. Most models that CBO identified are specific to budgets for operating forces, but some models, such as those for civilian pay, Budget Activity 01 (Operating Forces) Budget Activities 02 to 04 b span multiple O&M budget activities. The services also use models for other appropria- Source: Congressional Budget Office. tions that CBO did not address. For example, the services use models in formulating budget Note: Not all modeled activities are shown. Areas are roughly proportional to the dollar amounts they represent. requests for their accounts for procurement a. Amounts not already included in other models. and military personnel, but those models fall b. Budget activities 02, 03, and 04 cover mobilization, training and recruiting, and administration and outside of the scope of this analysis. servicewide activities, respectively. CBO did not examine those activities and therefore did not determine how much of those activities are modeled. CBO
- 14. MODELS USED BY THE MILITARY SERVICES TO DEVELOP BUDGETS FOR ACTIVITIES ASSOCIATED WITH OPERATIONAL READINESS 6 Exhibit 2. CBO grouped the methods that the services Selected Methods Used by the Services to Develop Their Budgets for use to develop their budgets for operating Operating Forces forces into three categories. The first category consists of models for operating tempo (optempo) and training. The services use those Budgeting Method Description Examples models to estimate the cost of operating mili- tary units, such as the costs of ships’ steaming Models for Operating Models of services’ major training Flying hours (all services); ship days, miles driven by ground units, and hours Tempo and Training and peacetime deployment activities. operations (Navy); training miles flown by aviation units. Those models explic- Usually contain a readiness goal for (Army) itly account for the activities that units must deployable units. Model outputs such perform in order to be ready for deployment as flying hours are multiplied by a and therefore help to assess the cost of achiev- projected unit cost. ing certain readiness goals. Detailed Projection Detailed estimates of demands for Depot maintenance (all services); The second category comprises various models Models products, services, or resources are facilities sustainment (all services); that CBO classified as detailed projection multiplied by a projected unit cost. base operating support (Army, Navy); models. Those models include estimates of the civilian pay (all services) requirements for specific products, services, or resources, such as labor, spare parts, or mainte- Not Modeled, or Modeled Projections of historical budgets into Base operating support (Air Force, nance. The military services multiply those Below the Headquarters the current budget year, or projections Marine Corps); facility restoration requirements by the expected costs per prod- Level built at a level below headquarters and modernization (Army, Air Force, uct, service, or resource to obtain the total and aggregated. Marine Corps) estimated cost of the activity. Source: Congressional Budget Office. The third category includes methods of estimating costs that CBO did not consider to be models. Instead, those methods project historical budgets into the current budget year. The task is generally accomplished by adjusting past budgets for inflation or by mak- ing adjustments proportional to increases or decreases in the total budget. This category also includes budgeting methods that do not use headquarters-level models but may involve an aggregation of models from lower organizational levels. CBO
- 15. MODELS USED BY THE MILITARY SERVICES TO DEVELOP BUDGETS FOR ACTIVITIES ASSOCIATED WITH OPERATIONAL READINESS 7 Exhibit 3. Depending on the service, models informed Modeling of Budget Requests for Operating Forces, by roughly 45 percent to 80 percent of the budget requests for operating forces. CBO categorized the Service and Function models by function: optempo and training, mainte- (Billions of dollars) nance, facilities, and miscellaneous. Of the four functions, optempo and training had the largest Operating Tempo dollar amount of the budget request that is mod- and Training Facilities Maintenance Miscellaneous All Functions eled, and the maintenance function had the highest By Service percentage of the budget request that is modeled. Navy a a Modeled Amount 7.3 5.9 7.4 0.6 21.1 The optempo and training function supports activ- a a Budget Request 9.9 6.6 8.1 5.0 29.5 ities such as steaming days for ships and flying Percentage Modeled 74 89 91 12 72 hours for aviation units. The services modeled between 41 percent and 100 percent of the Army optempo and training function, amounting to Modeled Amount 5.6 8.8 1.2 1.9 17.4 roughly $19 billion in total. Budget Request 5.6 10.1 1.2 4.4 21.3 Percentage Modeled 100 87 100 41 82 The facilities function provides for day-to-day operations of and repairs to facilities. CBO found Air Force that the services vary in their budgeting approaches Modeled Amount 3.8 2.0 2.2 1.4 9.4 to that function. The Air Force and the Marine Budget Request 9.1 4.2 2.2 5.1 20.6 Corps do minimal modeling, while the Navy and Percentage Modeled 41 48 100 27 45 the Army model large portions of their budget requests for base operating support—the part of the Marine Corps facilities budget that pays for day-to-day opera- a a Modeled Amount 2.4 1.4 0.6 0.3 4.6 tions. All of the services have been directed to use a a Budget Request 3.0 3.0 0.6 0.8 7.4 the Office of the Secretary of Defense’s (OSD’s) Percentage Modeled 79 46 100 33 63 model to build their facilities sustainment budgets. All Services The maintenance function supports depot-level maintenance of equipment and weapon systems. Modeled Amount 19.0 18.1 11.3 4.1 52.5 Each of the services modeled all or almost all of its Budget Request 27.6 23.9 12.0 15.3 78.8 budget request for maintenance functions, repre- Percentage Modeled 69 76 94 26 67 senting over $11 billion in total. Source: Congressional Budget Office. Miscellaneous activities are those not included in the other three functions. The largest modeled a. For the purposes of this study, the Marine Corps’ flying hours and aviation depot-level maintenance were category within the miscellaneous function is for moved from the Navy’s budget to the Marine Corps’ budget to reflect which service actually performs those civilian pay; each service projects in detail the num- activities. ber of and costs for its civilian personnel. (Civilian pay also appears in the other three functions, either modeled by itself or included in other models.) CBO
- 16. MODELS USED BY THE MILITARY SERVICES TO DEVELOP BUDGETS FOR ACTIVITIES ASSOCIATED WITH OPERATIONAL READINESS 8 Exhibit 4. The pie charts show the same data as the previ- Modeled Percentage of Operating Forces Budgets, by ous exhibit but emphasize the variations in Service and Function modeling among the services. That variation reflects differences in the services’ organiza- Miscellaneous tional structures and in their approaches to Miscellaneous (2%) building budgets. (9%) The Navy and the Army have central com- mands at the headquarters level that manage Unmodeled Facilities facilities and model their associated costs. In Unmodeled (18%) (20%) contrast, the Air Force and the Marine Corps (28%) do not have central facilities commands; they Navy Optempo and Army generate their budgets for facilities operations Facilities Training and services at the installation level (which Maintenance Expeditionary (41%) (Ground miles, Optempo and Forces CBO does not cover in this report) rather than (25%) flying hours) Training (1%) (26%) the headquarters level, aggregating those esti- (25%) mates to determine their total budget requests. Steaming Days In addition, some services emphasize modeling (9%) Flying Hours Maintenance more than others. In recent years, the Navy (14%) and the Army in particular have expanded (6%) their modeling efforts for budgeting and have Miscellaneous Miscellaneous (4%) both developed new models for optempo and (6%) training. The Marine Corps currently does not model its budget request for ground unit train- Facilities ing, but it plans to begin modeling for that (10%) Facilities purpose in fiscal year 2013. (19%) Unmodeled CBO’s focus on only the operating forces bud- Maintenance (37%) Air (11%) Unmodeled Maintenance Marine get (budget activity 01) led to the exclusion of Force Optempo and (55%) (8%) Corps some services’ modeling of related activities Training that are categorized differently. For example, (Flying hours) Optempo and Training about 13 percent of the Air Force’s O&M (18%) (Flying hours) budget request for 2012 (including model- (32%) informed budgets for some flying hours and depot-level maintenance) fell into budget activity 02, mobilization, while each of the Source: Congressional Budget Office. other services had less than 2 percent of its Notes: For the purposes of this study, the Marine Corps’ flying hours and aviation depot-level maintenance were O&M request in that budget activity. Because moved from the Navy’s budget to the Marine Corps’ budget to reflect which service actually performs CBO did not include budget activity 02 in its those activities. CBO analysis, that additional modeling by the Air Optempo = operating tempo. Force is not counted here.
- 17. Models Used by Each Service CBO
- 18. MODELS USED BY EACH SERVICE MODELS USED BY THE MILITARY SERVICES TO DEVELOP BUDGETS FOR ACTIVITIES ASSOCIATED WITH OPERATIONAL READINESS 10 Exhibit 5. According to CBO’s analysis, models informed Modeled Amounts of the Navy’s Budget Request for $21.1 billion, or 72 percent, of the Navy’s $29.5 billion request for operating forces in 2012. Operating Forces About one-third of that modeled amount occurred in the Navy’s optempo and training function. The Modeled Amount SAG of the 2012 Request Flying Hour Requirements model is used to esti- Function Model Number SAG Name (Millions of dollars) mate the costs of operating aviation forces and b training student aircrews. Flying hour costs for the Operating Flying Hour Requirements 1A1A Mission and other flight operations 2,963 Marine Corps are included in the Navy’s budget; Tempo and 1A2A Fleet air training 1,272 b for this report, CBO reassigned those costs to the Training Ship Operations 1B1B Mission and other ship operations 2,369 Marines. The Ship Operations model is used to estimate the costs of preparing ships, training their Navy Expeditionary Combat 1C6C Combat support forces not assigned to ships 447 crews, and deploying ships on routine patrols, and Enterprise the Navy Expeditionary Combat Enterprise model Fleet Ordnance Support 1B2B Ship operations support and training 116 is used to estimate portions of the costs of training Civilian Paya 1B2B Ship operations support and training 114 combat support forces not assigned to ships, such as construction battalions. Facilities Base Operations Support BSS1 Base operating support 3,919 (15 models) Slightly less than one-third of the Navy’s operating OSD Facilities Sustainment BSM1 Sustainment, restoration, and modernization 1,355 forces budget pays for the operation, upkeep, and repair of facilities. The Navy used 15 separate Shore Facilities Investment BSM1 Sustainment, restoration, and modernization 592 models to estimate about 85 percent of the various Maintenance Ship Depot Maintenance 1B4B Ship depot maintenance 4,973 day-to-day costs of operating and providing services 1B5B Ship depot operations support 1,304 at installations. The Navy uses OSD’s Facilities Sus- tainment model to estimate the cost of periodic b Aviation Depot Maintenance 1A5A Aircraft depot maintenance 597 repairs to facilities. It also models its facility restora- 1A6A Aircraft depot operations support 37 tion and modernization requirements to repair Optimization Performance 1D1D, Cruise missiles; weapons maintenance 425 facilities that have not been adequately sustained or (Ordnance maintenance) 1D4D that need reconfiguration. Navy Expeditionary Combat 1D3D, In-service weapon systems support; 42 Maintenance of ships, aircraft, and weapon systems Enterprise 1D4D weapons maintenance constituted an additional one-third of the Navy’s modeled amount. The Ship Depot Maintenance Miscellaneous Civilian Paya Multiple Multiple subactivity groups 576 model and Aviation Depot Maintenance model are Total Modeled Amount of the Request 21,101 used to estimate the costs of engineering and main- tenance work on ships and aircraft at the depot Total Request 29,482 level. The Navy budget also includes aviation main- Source: Congressional Budget Office. tenance costs for the Marine Corps, but CBO reas- signed those costs to the Marine Corps for this Note: SAG = subactivity group; OSD = Office of the Secretary of Defense. report. a. Amounts not already included in other models. b. Excludes money budgeted for the Marine Corps. CBO
- 19. MODELS USED BY EACH SERVICE MODELS USED BY THE MILITARY SERVICES TO DEVELOP BUDGETS FOR ACTIVITIES ASSOCIATED WITH OPERATIONAL READINESS 11 Exhibit 6. According to CBO’s analysis, models informed Modeled Amounts of the Army’s Budget Request for $17.4 billion, or 82 percent, of the Army’s Operating Forces $21.3 billion request for operating forces in 2012. About one-third of that modeled Modeled Amount amount was in the optempo and training func- SAG of the 2012 Request tion. The Army’s Training Resource model is Function Model Number SAG Name (Millions of dollars) used to estimate the costs of driving combat vehicles (presented as a cost per full-spectrum Operating Training Resource 111 Maneuver units 1,400 mile, which is a composite measure of miles Tempo and (Includes full-spectrum 112 Modular support brigades 105 Training miles and flying hours)a driven by tanks, trucks, and other vehicles) 113 Echelons above brigade 816 and flying aircraft during training activities. 114 Theater-level assets 826 The model also estimates the costs of func- 115 Land forces operations support 1,245 tional support such as engineering brigades, 116 Aviation assets 1,199 units above the brigade level such as air defense battalions, units that directly support world- Facilities Base Operations 131 Base operations support 6,491 wide operations such as intelligence units, and Requirements modernization the Army’s Combat Training Centers. OSD Facilities Sustainment 132 Sustainment, restoration, and 2,303 The facilities function made up the largest por- modernization tion of the Army’s budget request for operating Civilian Payb 132 Sustainment, restoration, and 13 forces, with models influencing nearly modernization $9 billion. The Army uses its Base Operations Requirements model to estimate about 85 per- Maintenance Depot Maintenance 123 Land forces depot-level maintenance 1,180 cent of the requirements for operating and Miscellaneous Civilian Payb Multiple Multiple subactivity groups 1,810 providing services on bases. To generate its budget request for facilities sustainment, the Medical Field Services 122 Land forces systems readiness 54 Army uses OSD’s Facilities Sustainment model. Total Modeled Amount of the Request 17,442 Total Request 21,322 The Army also uses a model to determine its requirement for depot-level maintenance of Source: Congressional Budget Office. vehicles, aircraft, and weapon systems. All civilian pay in the Army’s operating forces Note: SAG = subactivity group; OSD = Office of the Secretary of Defense. budget was associated with a model. For civil- a. A full-spectrum mile is a composite measure of miles driven by tanks, trucks, and other vehicles. ian pay not already included in other models, b. Amounts not already included in other models. the Army’s request was $1.8 billion. CBO
- 20. MODELS USED BY EACH SERVICE MODELS USED BY THE MILITARY SERVICES TO DEVELOP BUDGETS FOR ACTIVITIES ASSOCIATED WITH OPERATIONAL READINESS 12 Exhibit 7. According to CBO’s analysis, models informed Modeled Amounts of the Air Force’s Budget Request for $9.4 billion, or 45 percent, of the Air Force’s Operating Forces $20.6 billion request for operating forces in 2012. More than one-third of that modeled Modeled Amount amount was in the optempo and training func- SAG of the 2012 Request tion. The Air Force uses the Flying Hour Function Model Number SAG Name (Millions of dollars) model to estimate the operational costs of combat forces such as fighters and bombers, Operating Flying Hour 11A Primary combat forces 2,167 combat enhancement forces such as electronic Tempo and 11C Combat enhancement forces 324 Training warfare aircraft, flight training programs, and 11D Air operations training 817 combat support programs such as opposition Civilian Paya 11A, 11C, Multiple subactivity groups 476 air forces used to develop and evaluate combat 11D skills. Facilities OSD Facilities Sustainment 11R Sustainment, restoration, and 972 For facilities, the only headquarters-level modernization model that the Air Force uses is OSD’s Facili- ties Sustainment model; unlike the Navy Civilian Paya 11Z, 11R Base operations support; 1,041 and the Army, the Air Force does not use Sustainment, restoration, and headquarters-level models to inform its budget modernization request for base operating support. The Air Maintenance Depot Maintenance 11M Depot-level maintenance 2,204 Force, however, does model all of its depot- level maintenance of aircraft and weapon Miscellaneous Flying Hour 12A Global C3I and early warning 29 systems. The Air Force also models civilian 12C Other combat operations support 95 pay, which, aside from civilian pay already programs included in other models, made up $2.7 bil- Civilian Paya Multiple Multiple subactivity groups 1,228 lion of the operating forces 2012 budget request. Total Modeled Amount of the Request 9,351 The modeled portion of the Air Force’s operat- Total Request 20,585 ing forces budget is less than that of the Navy and Army for two reasons. First, the Air Force Source: Congressional Budget Office. lacks a central facilities command and does not Notes: Unique among the services, the Air Force includes a portion of its flying hour, depot maintenance, and model at the headquarters level its budget for facilities sustainment budgets in subactivity groups outside of budget activity 01. base operating support—a large piece of the SAG = subactivity group; OSD = Office of the Secretary of Defense; C3I = command, control, budget for operating forces—aside from the communications, and intelligence. portion that is civilian pay. Second, the Air Force’s budget structure puts some items that a. Amounts not already included in other models. appear in the other services’ operating forces budgets (budget activity 01) in budget activi- ties 02, 03, and 04, which CBO did not CBO include in this analysis.
- 21. MODELS USED BY EACH SERVICE MODELS USED BY THE MILITARY SERVICES TO DEVELOP BUDGETS FOR ACTIVITIES ASSOCIATED WITH OPERATIONAL READINESS 13 Exhibit 8. According to CBO’s analysis, models informed Modeled Amounts of the Marine Corps’ Budget Request for $4.6 billion, or 63 percent, of the Marine Operating Forces Corps’ $7.4 billion request for operating forces in 2012. Most of that amount, $2.4 billion, Modeled Amount was for the Marine Corps’ flying hours costs. SAG of the 2012 Request Although those amounts are included in the Function Model Number SAG Name (Millions of dollars) Navy’s budget, CBO presents them as part of the Marine Corps’ budget for the purposes of Operating Flying Hour Requirements Navy Included in Navy budget 1,800 this analysis to reflect which service performs Tempo and 1A1A (Mission and other flight operations) Training those activities. Navy Included in Navy budget 500 1A2A (Fleet air training) The Marine Corps, like the other services, uses Civilian Pay a 1A1A Operational forces 95 OSD’s Facilities Sustainment model. Except for modeling civilian pay, the Marine Corps Facilities OSD Facilities Sustainment BSM1 Sustainment, restoration, and 566 does not use models to estimate funding needs modernization for base operating support, according to the information provided to CBO. The Marine Civilian Paya BSS1, Base operations support; sustainment, 833 BSM1 restoration, and modernization Corp models its depot-level maintenance costs for both ground and aviation units. Depot- Maintenance Depot Maintenance 1A3A Depot-level maintenance 191 level aviation maintenance is part of the Navy’s budget, but for this analysis, CBO included it Aviation Depot Navy Included in Navy budget 382 in the Marine Corps’ tabulation. Maintenance 1A5A (Aircraft depot maintenance) The Marine Corps does not have a model for Miscellaneous Civilian Paya 1A2A, Field logistics, maritime prepositioning 259 its training budget for ground units. Its 1B1B method of constructing that budget does not Total Modeled Amount of the Request 4,626 use a model to link ground-unit optempo Total Request 7,399 (known as deployable days) to the training that Marine Corps units undergo, the desired out- Source: Congressional Budget Office. come of that training, and the costs of the resources used. Notes: The Marine Corps uses deployable days as a measure of the percentage of days that ground units achieve deployable ratings in equipment and training. On the basis of a description provided in the Department of the Navy’s Fiscal Year 2012 Budget Estimates, Justification of Estimates (OP-5 1A1A pp. 6–8), CBO did not consider the deployable days metric to be a model and therefore excluded it from this table. SAG = subactivity group; OSD = Office of the Secretary of Defense. a. Amounts not already included in other models. CBO
- 22. Models for Operating Tempo and Training Functions CBO
- 23. MODELS FOR OPERATING TEMPO AND TRAINING FUNCTIONS MODELS USED BY THE MILITARY SERVICES TO DEVELOP BUDGETS FOR ACTIVITIES ASSOCIATED WITH OPERATIONAL READINESS 15 Exhibit 9. The services use models to inform most of Modeling of Budgets for Operating Tempo and Training, by Service their major peacetime operations and training functions such as flying hours, training miles, 2012 Budget Request Modeled Amount and steaming days. Those models accounted (Billions of dollars) (Billions of dollars) Percentage Modeled for $19 billion, or almost 70 percent, of the Navy 9.9 7.3 74 nearly $28 billion in requests for those activi- ties in 2012. The modeled portion of the Air Army 5.6 5.6 100 Force’s budget request for optempo and train- Air Force 9.1 3.8 41 ing is smaller than the modeled portion of other services’ requests because some of the Air Marine Corps 3.0 ____ 2.4 ____ 79 Force’s modeled flying hours fall outside bud- Total 27.6 19.0 69 get activity 01. Source: Congressional Budget Office. CBO
- 24. MODELS FOR OPERATING TEMPO AND TRAINING FUNCTIONS MODELS USED BY THE MILITARY SERVICES TO DEVELOP BUDGETS FOR ACTIVITIES ASSOCIATED WITH OPERATIONAL READINESS 16 Exhibit 10. The Navy’s budgeting models are built around The Navy’s Fleet Response Plan Cycle for Surface Combatants the Fleet Response Plan (FRP)—a structured training process used to prepare and train 27-Month Cycle Navy forces for routine deployment and, if Basic Integrated Sustainment Maintenance necessary, for contingency operations overseas. In the FRP cycle, training increases in com- Duration of Phase 112 days 90 days 546 days, of which 63 days plexity until units are ready for deployment. 183 are scheduled for deployment Not all units are expected to be at the highest Number of Days Under Way 43 days 43 days 117 days 0 days level of combat readiness at all times—only those that have an upcoming deployment are Activities Sea trials, Multiship Continued advanced multiship Major expected to be at that status. ammunition loading training exercises training, including carrier strike maintenance and unloading, up to the carrier group exercises after deployment overhaul This exhibit focuses on the FRP cycle for ships unit-level training strike group level because they are the predominant combat plat- form in the Navy. Other Navy forces, such as Source: Department of the Navy. construction battalions, also use the FRP pro- Note: Surface combatants include cruisers, destroyers, frigates, and littoral combat ships. cess to train and employ their forces and to synchronize their activities with ships’ cycles. The FRP cycle ranges from 15 months to 32 months, depending on ship class. Exhibit 10 illustrates the FRP cycle for surface com- batants, which include cruisers, destroyers, frigates, and littoral combat ships. Exhibit 11 lists the length of the cycle for other types of ships and other units. Ships begin the FRP cycle in the basic phase, during which crews undergo unit-level train- ing. The length of this phase for surface ships is, on average, 112 calendar days. Of those 112 days, ships are under way for an average of 43 days for sea trials, unit-level training, and loading and testing of ammunition. At the end of the basic phase, ships should be ready to operate as independent units. In the integrated phase, which lasts, on average, 90 days, ships train with other ships to fight as a larger force. At the end of that phase, ships are deemed to be sufficiently ready for major combat operations. CBO (Continued)