Ppt black 2014 july 24 age-wave_creating aging-friendly communities workshop_ bayfield and ashland counties wi
•Download as PPTX, PDF•
0 likes•507 views

Age-Wave/Aging-Friendly Communities Workshop - Bayfield County, July 24 2014 (Clifton E. Barber, UW-Madison and UW Extension Family Living Programs)

Recommended
Recommended
More Related Content
What's hot
What's hot (20)
Viewers also liked
Similar to Ppt black 2014 july 24 age-wave_creating aging-friendly communities workshop_ bayfield and ashland counties wi
Similar to Ppt black 2014 july 24 age-wave_creating aging-friendly communities workshop_ bayfield and ashland counties wi (20)
Recently uploaded
Recently uploaded (20)
Ppt black 2014 july 24 age-wave_creating aging-friendly communities workshop_ bayfield and ashland counties wi
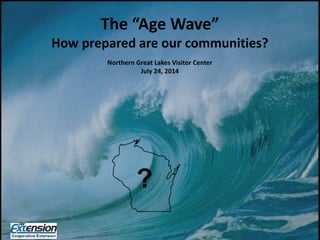
- 1. ? The “Age Wave” How prepared are our communities? Northern Great Lakes Visitor Center July 24, 2014 ?
- 2. Facilitators: • Liz Lexau, UW-Extension Family Living Educator • Tim Kane, UW-Extension Community Development Educator • Carrie Linder, Bayfield County Aging & Disability Services Manager • Clif Barber, University of Wisconsin- Madison/UW Extension Family Living Programs
- 3. Aging in Place • Americans want to age in place. • Communities will have to adapt.
- 4. How prepared are our communities for the impacts of a rapidly aging population? 10,000 Americans are turning 65 every day…a trend that will continue for the next 20 years! Nation’s Aging Population Booms
- 5. 2005 National Survey of 10,000 Communities National Association of Area Agencies on Aging (n4a) and the MetLife Foundation What percentage of communities in the United States have started to plan for the impacts of population aging?
- 6. Finding: Fewer than 46% of communities have begun to assess their “aging-readiness” and prepare for the impacts of an aging population.
- 7. 2010 Follow-Up Survey Reported that… “only limited progress in advancing the goal of preparing for an aging population. Many communities are struggling just to maintain the status quo.”
- 8. Questions to Guide Discussion: 1. What are some indicators of population aging? 2. What are some of the impacts of population aging on our communities? 3. What are the key attributes or characteristics of “aging-friendly” communities? 4. What steps can a community take to become more aging-friendly? What survey instruments can be used for an initial assessment? 5. What resources are available for communities?
- 9. Measures of Aging What are some ways of measuring the aging of individuals? What are some ways of measuring the aging of entire populations? Individuals Entire Populations
- 10. Measures/Indicators of Population Aging • Life expectancy • Number of persons age 65+ • Percent of persons age 65+ • Median age
- 11. Population Aging in the United States
- 14. Increase in Number and Percentage
- 15. Percentage of Americans Age 65 Expected to Survive to Age 90
- 16. Growth of U.S. Centenarians
- 17. Aging of the Baby Boomers… • Baby boomers started turning 65 in January 2011. Approximately 10,000 of them turn 65 every day — and this will continue for the next 20 years! • 2030: 65+ projected to be 72 million people (20% of population.) • 2050: 65+ projected to be 80 to 90 million people and those age 85+ close to 21 million
- 18. Population Aging in Wisconsin
- 21. Increasing Proportion of Persons Age 65+ in Wisconsin 2010 (13.7%) to 2040 (23.7%)
- 22. Percent of Population Age 65+ State Rankings (2010 Census) Ranked 1st 17.3% Ranked 22nd 13.7%
- 23. Iron (51.0) Vilas (50.7) Florence (49.9) Door (49.4) Bayfield (49.4) Adams (49.2) Burnett (49.1) Price (48.3) Oneida (48.0) Washburn (47.7) Population Aging in Wisconsin’s Counties Median Age by County (2010 Census) Median age for WI: 38.5 Ten “Oldest” Counties in Wisconsin:See Packet Handout
- 24. Projections for Oldest Counties Median age in 2010 # persons age 65+ in 2010 % persons age 65+ in 2010 Projected % in 2035 Iron 51 1,502 25.4% 35.9% Vilas 50.7 5,556 25.9% 36.8% Florence 49.9 931 21.0% 35.4% Door 49.4 6,245 22.5% 36.9% Bayfield 49.4 3,112 20.7% 41.6% Adams 49.2 4,899 23.5% 39.6% Burnett 49.1 3,569 23.1% 32.1% Price 48.3 2,968 21.0% 37.2% Oneida 48 7,800 21.7% 32.1% Washburn 47.7 3,380 21.2% 32.8% Ashland 40.3 2,567 15.9% 29.4%
- 25. Percentage of Persons Age 65+ by County: Changes Between 2010 and 2035 Wisconsin’s Age Wave
- 28. What Impacts Will Population Aging Have on Wisconsin Communities?
- 29. Areas of Community Life Impacted by Population Aging 1. Housing 2. Transportation, accessibility, and parking 3. Sidewalks & Pedestrian Crossings 4. Community and Health Care Resources 5. Family caregiving 6. Nutrition and Wellness 7. Arts, Culture, and Lifelong Learning 8. Employment and Workforce development 9. Public safety and emergency planning 10. Respect and Social Inclusion 11. Community Connectedness: Civic Engagement and Volunteer Opportunities 12. Taxation, Finance, Protection Against Fraud 13. Community Leadership and Intergenerational Collaboration
- 30. Packet Handout: Activity – Identifying Impacts
- 31. Group Reports: 1. Housing 2. Transportation, accessibility, and parking 3. Sidewalks & Pedestrian Crossings 4. Community and Health Care Resources 5. Family caregiving 6. Nutrition and Wellness 7. Arts, Culture, and Lifelong Learning 8. Employment and Workforce development 9. Public safety and emergency planning 10. Respect and Social Inclusion 11. Community Connectedness: Civic Engagement and Volunteer Opportunities 12. Taxation, Finance, Protection Against Fraud 13. Community Leadership and Intergenerational Collaboration
- 32. Creating Aging-Friendly Communities • What are the key attributes or characteristics of aging-friendly communities” • How can you tell whether a community offers a supportive environment for persons of all ages, including those who are elderly? • How can a community measure or assess the extent to which it is aging-friendly?
- 33. Qualities of Aging-Friendly Communities
- 34. Qualities or Attributes of an Aging- Friendly Community • Inclusive • Sustainable • Healthy • Accessible • Interdependent • Engaged Source: Thomas, W. H., & Blanchard, J. M. (2009). Moving beyond Place: Aging in community. Generations, 33(2), 12-17.
- 35. 1. Assemble a team of public and private leaders/stake holders in the community; provide education to increase awareness of population aging. 2. Assess the community’s aging-readiness. 3. Take focused-action. 4. Promote Success. 5. Set-a long-term course. 6. Obtain resources. Steps to Becoming More “Aging- Friendly” and “Aging-Ready”
- 36. Assessment Tool #1: Appendix B of “Blueprint for Action”
- 37. Assessment Tool #2: Community “Report Card”
- 38. Assessment Tool #3: Checklist of essential features of age-friendly cities
- 39. Assessment Tool #4: Cooperative Extension Survey
- 40. Survey Focuses on 13 Areas 1. Housing 2. Transportation, accessibility, and parking 3. Sidewalks and Pedestrian Crossings 4. Community and Health Care Resources 5. Family caregiving 6. Nutrition and Wellness 7. Arts, Culture, and Lifelong Learning 8. Employment and Workforce development 9. Public safety and emergency planning 10. Respect and Social Inclusion 11. Community Connectedness: Civic Engagement and Volunteer Opportunities 12. Taxation, Finance, Protection Against Fraud 13. Community Leadership and Intergenerational Collaboration
- 41. Survey Response Options After reading a list of aging-friendly attributes for each area, the respondent indicates how many on in her/his community: 1 = None of them 2 = A few of them 3 = About half of them 4 = Most of them 5 = All of them
- 42. Resources (updated in 2013) • Websites • Reports • Books • Journal articles • Agencies and organizations
- 43. UW Extension FYI Blog: http://fyi.uwex.edu/agingfriendlycommunities/
- 44. Those communities that design for livability empower their residents to remain independent and engaged, and offer a better quality of life. A Call for Action:
- 45. ?Questions We All Need to Ask? • Is your community a good place to grow up and grow old? • Will your community meet your needs when you are 65, 75, 85, 95…or even 105? • If not, what can you do now to begin to make your community a friendly and supportive environment for persons of all ages?
- 46. Be a catalyst for action! Are you willing to take the risk?
- 47. Questions
Editor's Notes
- Welcome. Our sincere appreciation to all of your for making time to be with us today. A key question guiding our discussion today is “How prepared are our communities for what has been referred to in the popular media as the “age wave” ? …referring, of course, to the increasing number of older persons…due largely to the aging of the “baby boom” generation. The image in this slide - of wave “engulfing” our state - could be viewed in a negative light; meaning that the increasing number of older persons is not a welcome trend. We do not mean to convey this message! There are many positive community impacts that may result from an increasing number of older persons. Older persons represent what is often an untapped resource for many communities, particularly in terms of their potential for swelling the ranks of much needed volunteer efforts in schools, hospitals, and community service agencies. The “wave” image in this slide is used primarily to convey the immensity of the demographic change about to occur, and a sense of urgency in preparing for it.
- Do introductions of facilitators (and participants, if time permits)
- Contrary to popular belief and stereotype, only a minority of older adults actually move to warmer climates upon retirement. Most remain in their own homes and communities as they age. In fact, the majority of people retire where they spend the final years of their career. Between 2011 and 2012, for example, only about 3 percent of people age 65 and older moved; compared to 14 percent of people under 65. And most of those age 65 and older who did move stayed in the same state (83 percent) and the same county (61 percent). During this period of time, only 16 percent of people who moved after age 65 relocated out of state or abroad. With this in mind, every community - rural or urban - will have to adapt to an increasingly older population. SOURCES: UW Extension Applied Population Lab: Net Migration Patterns for US Counties: http://www.netmigration.wisc.edu/ Internal Migration of the Older Population: 1995-2000 (issued August 2003), by Wan He and Jason Schachter, US Census Bureau. National Association of Area Agencies on Aging and Partners for Livable Communities (2006). The Maturing of America - Getting Communities on Track for an Aging Population. http://www.n4a.org/pdf/MOAFinalReport.pdf
- With the much heralded aging of the baby boomers, it is no surprise that the number of persons age 65 and older will significantly increase over the next 30 years. A number of news articles in the last year or so have highlighted the nation’s “aging boom”. With the aging of the Baby Boom generation, 10,000 Americans are turning 65 every day….a trend that will continue for the next 20 years. This slide shows one example: A USA Today headline entitled, “Nation’s aging population booms”. QUESTION: So, again, we pose the question: How prepared are our communities for the impacts of a rapidly aging population?
- To find an answer to this question, in 2005, the National Association of Area Agencies on Aging – together with several partners (e.g. the MetLife Foundation) – conducted a national survey of 10,000 communities wherein the focus was on assessing the extent to which American communities had begun to plan for population aging. Ask participants: Of those communities that responded to the Survey, what percent do you think indicated that they had started to plan for the impacts of population aging? HANDOUT: Included in the handout packet is a copy of the front page of this report, and the first page of the executive summary.
- A key finding in a report published in 2006 (Maturing of America: Getting Communities on Track for an Aging Population) was that fewer than half (46%) had even begun to prepare for this important demographic trend. The report stated that “Although many communities have some programs to address the needs of older adults, few have undertaken a comprehensive assessment to make their communities ‘aging-friendly’ or livable for people of all ages.” NOTE: Report may be found online at: http://www.n4a.org/pdf/MOAFinalReport.pdf “Although many communities have some programs to address the needs of older adults, very few have undertaken a comprehensive assessment to make their communities ‘aging-friendly’ or livable for people of all ages.”
- A follow-up survey was conducted in 2010, and revealed that only limited progress had been made in becoming aging-ready. As a result of the severe economic challenges associated with the recession, most communities have been able only to “hold the line”— maintaining policies, programs and services already established. They have not been able to move forward to the degree needed to address the nation’s current “age wave.” Source: National Association of Area Agencies on Aging (2011). The Maturing of America: Communities Moving Forward for an Aging Population, Washington, D.C. Website: http://www.n4a.org/files/MOA_FINAL_Rpt.pdf
- Here is a list of five questions that will guide our discussion today. We will begin with a focus on population aging. (NOTE: This is a sample slide only. The questions to be addressed will vary with the setting, time constraints, and target audience).
- What are some ways used to measure the aging of individuals? Chronological age (birthdays). Functional/physical age (ability to perform activities of daily living; physical health; etc.). Psychological age (problem-solving ability). Just as the aging of individuals can be measured so, too, can the aging of entire populations (i.e. groups of people living in a given geographical area). QUESTION: What are some ways that aging is measured for entire populations?
- The focus of the Survey is to collect information on the extent to which a person perceives that the community in which they reside has “aging-friendly characteristics” in each of 13 areas: Housing Transportation, accessibility, and parking Sidewalks and Pedestrian Crossings Community and Health Care Resources Family caregiving Nutrition and Wellness Arts, Culture, and Lifelong Learning Employment and Workforce development Public safety and emergency planning Respect and Social Inclusion Community Connectedness: Civic Engagement and Volunteer Opportunities Taxation, Finance, Protection Against Fraud Community Leadership and Intergenerational Collaboration
- The focus of the Survey is to collect information on the extent to which a person perceives that the community in which they reside has “aging-friendly characteristics” in each of 13 areas. After reading a list of aging-friendly attributes for each area, the respondent indicates how many on in her/his community: 1 = None of them 2 = A few of them 3 = About half of them 4 = Most of them 5 = All of them
- In the packet of handout materials is a list of resources that communities/counties might find useful as they begin to plan for population aging. Included in the list of resources are websites, reports, books, articles, agencies, and organizations.
- UW Extension Family Living Programs has developed a website aimed at helping to create aging-friendly communities in Wisconsin. One of the sheets in your packet provide the web address this blog. You can also access it by simply typing the following phrase into a web browser: “Creating Aging-Friendly Communities in Wisconsin”. The blog contains information that may be helpful to communities and counties. It also affords the opportunity for communities to share what they are doing – to highlight “best practice” examples of aging-friendly environments. This slide shows one of the posts on the blog highlighting efforts in LaCrosse County to become more “aging-friendly”. HYPERLINK NOTE: If you are connected to the internet, clicking on this screen shot provides access to the blog: http://fyi.uwex.edu/agingfriendlycommunities/
- In 2005, AARP published a booklet entitled “Beyond 50.05”, the focus of which was to encourage the development of livable communities. The booklet issues a “call for action” and makes specific recommendations. The booklet concludes with the following: Unless America makes a commitment to livable, “aging-friendly” communities, baby boomers and other persons of a range of ages and with a variety of abilities will find it difficult to age successfully and remain engaged with their communities... On the other hand, those communities that design for livability empower their residents to remain independent and engaged, and offer a better quality of life.
- With this call for action in mind, we pose three questions: 1. Is your community a good place to grow up and grow old? 2. Will your community meet your needs when you are 65, 75, 85, 95…or even 105? 3. If not, what can you do now to begin to make your community a friendly and supportive environment for persons of all ages?
- Responses to these questions will require your involvement in your respective communities and counties. Are you willing to take the risk? Will you be a catalyst for action?
- Questions