SlideShare a Scribd company logo
1 of 10
Unit 2 – Data Analysis & Interpretation
Consumer Mathematics 30S
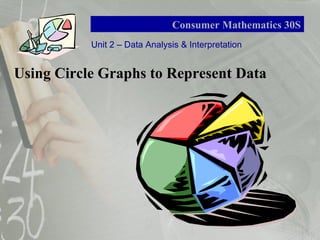
Using Circle Graphs to Represent Data
Circle Graphs
Another way to display data is in the form of a circle
graph or pie chart. Circle graphs are useful in
displaying percentages, or parts of a whole.
Unit 2 – Data Analysis & Interpretation
Consumer Mathematics 30S
Circle Graphs
Unit 2 – Data Analysis & Interpretation
Consumer Mathematics 30S
Properties of Circle Graphs:
• They are circular shaped graphs with the entire circle
representing the whole.
• The circle is then split into parts, or sectors.
• Each sector represents a part of the whole.
• Each sector is proportional in size to the amount each
sector represents, therefore it is easy to make
generalizations and comparisons.
Constructing Circle Graphs
Unit 2 – Data Analysis & Interpretation
Consumer Mathematics 30S
When constructing a circle graph, follow the steps below
1. Is the Data Suitable--Determine if there is a "whole" for the data. Then
determine what the different parts, or data groups, of the whole are.
2. Calculate Percentages--For data that is not already given as a percentage,
convert the amounts for each part, or data group size, into a percentage of the whole.
3. Draw the Graph--Draw a circle and draw in a sector for each data group.
4. Title and Label the Graph--Label the sectors with the data group name
and percentage. Then add a title to the graph. This is the same as the title of the table.
Example
Unit 2 – Data Analysis & Interpretation
Consumer Mathematics 30S
Construct a circle graph for the following data.
Constructing a Circle Graph
Unit 2 – Data Analysis & Interpretation
Consumer Mathematics 30S
Step 1 – Is the Data Suitable?
• There are five parts to the whole. Each data group is a
category of sneaker brands (1) Adidas, (2) Nike, (3)
Reebok, (4) Asics, (5) Other.
Step 2 – Calculate Percentages
• Calculate the whole: 150 + 192 + 60 + 108 + 90 = 600
• Calculate the percentage for each part
ex. Adidas: 150/600 = .25 or 25%
Constructing a Circle Graph
Unit 2 – Data Analysis & Interpretation
Consumer Mathematics 30S
Step 3 – Draw the Graph
• First, draw a circle. Then, draw in the sectors of the
circle using a protractor to calculate the size of the
sector.
• The percentage has to be converted to a degrees.
ex. 25% or .25 x 360o
= 90o
Step 4 – Title and Label the Graph
Can circle graphs be misleading?
Unit 2 – Data Analysis & Interpretation
Consumer Mathematics 30S
Classroom Activity: Page 118 - 119
Unit 2 – Data Analysis & Interpretation
Consumer Mathematics 30S
Textbook Assignment:
Page 120 - 121
Questions 1 - 2
Unit 2 – Data Analysis & Interpretation
Consumer Mathematics 30S
Textbook Assignment:
Page 120 - 121
Questions 1 - 2

More Related Content

What's hot

Evaluating an Algebraic Expression
Evaluating an Algebraic ExpressionEvaluating an Algebraic Expression
Evaluating an Algebraic ExpressionJC Alisasis
 
Introduction to algebra
Introduction to algebraIntroduction to algebra
Introduction to algebraSukkur IBA
 
Scientific notation powerpoint
Scientific notation powerpointScientific notation powerpoint
Scientific notation powerpointEdison Orgil
 
6. lesson 5 multiplication of whole numbers
6. lesson 5 multiplication of whole numbers6. lesson 5 multiplication of whole numbers
6. lesson 5 multiplication of whole numbersJohn Rome Aranas
 
Lesson Plan- Measures of Central tendency of Data
Lesson Plan- Measures of Central tendency of DataLesson Plan- Measures of Central tendency of Data
Lesson Plan- Measures of Central tendency of DataElton John Embodo
 
Dividing decimals part 1
Dividing decimals part 1Dividing decimals part 1
Dividing decimals part 1grace_job
 
Adding and subtracting polynomials
Adding and subtracting polynomialsAdding and subtracting polynomials
Adding and subtracting polynomialsholmsted
 
Fractions, Decimals, and Percents
Fractions, Decimals, and PercentsFractions, Decimals, and Percents
Fractions, Decimals, and Percentstoni dimella
 
Greatest Common Factor
Greatest Common FactorGreatest Common Factor
Greatest Common Factormmeddin
 
Adding Polynomials
Adding PolynomialsAdding Polynomials
Adding Polynomialschulitt
 
Multiplying and Dividing Integers
Multiplying and Dividing IntegersMultiplying and Dividing Integers
Multiplying and Dividing IntegersBrooke Young
 
2-10 Adding and Subtracting Decimals
2-10 Adding and Subtracting Decimals2-10 Adding and Subtracting Decimals
2-10 Adding and Subtracting DecimalsRudy Alfonso
 
What is Line Graph
What is Line GraphWhat is Line Graph
What is Line GraphAsad Afridi
 
Long and synthetic division
Long and synthetic divisionLong and synthetic division
Long and synthetic divisionJessica Garcia
 
Parallel and perpendicular lines
Parallel and perpendicular linesParallel and perpendicular lines
Parallel and perpendicular linesJessica Garcia
 

What's hot (20)

Evaluating an Algebraic Expression
Evaluating an Algebraic ExpressionEvaluating an Algebraic Expression
Evaluating an Algebraic Expression
 
Introduction to algebra
Introduction to algebraIntroduction to algebra
Introduction to algebra
 
Scientific notation powerpoint
Scientific notation powerpointScientific notation powerpoint
Scientific notation powerpoint
 
Multiplying polynomials
Multiplying polynomialsMultiplying polynomials
Multiplying polynomials
 
6. lesson 5 multiplication of whole numbers
6. lesson 5 multiplication of whole numbers6. lesson 5 multiplication of whole numbers
6. lesson 5 multiplication of whole numbers
 
Lesson Plan- Measures of Central tendency of Data
Lesson Plan- Measures of Central tendency of DataLesson Plan- Measures of Central tendency of Data
Lesson Plan- Measures of Central tendency of Data
 
Dividing decimals part 1
Dividing decimals part 1Dividing decimals part 1
Dividing decimals part 1
 
Algebraic Expression
Algebraic ExpressionAlgebraic Expression
Algebraic Expression
 
Adding and subtracting polynomials
Adding and subtracting polynomialsAdding and subtracting polynomials
Adding and subtracting polynomials
 
Fractions, Decimals, and Percents
Fractions, Decimals, and PercentsFractions, Decimals, and Percents
Fractions, Decimals, and Percents
 
Grade 7 Statistics
Grade 7 StatisticsGrade 7 Statistics
Grade 7 Statistics
 
Greatest Common Factor
Greatest Common FactorGreatest Common Factor
Greatest Common Factor
 
Adding Polynomials
Adding PolynomialsAdding Polynomials
Adding Polynomials
 
Multiplying and Dividing Integers
Multiplying and Dividing IntegersMultiplying and Dividing Integers
Multiplying and Dividing Integers
 
Organizing and presenting data
Organizing and presenting dataOrganizing and presenting data
Organizing and presenting data
 
2-10 Adding and Subtracting Decimals
2-10 Adding and Subtracting Decimals2-10 Adding and Subtracting Decimals
2-10 Adding and Subtracting Decimals
 
What is Line Graph
What is Line GraphWhat is Line Graph
What is Line Graph
 
Long and synthetic division
Long and synthetic divisionLong and synthetic division
Long and synthetic division
 
Parallel and perpendicular lines
Parallel and perpendicular linesParallel and perpendicular lines
Parallel and perpendicular lines
 
Measurement PPT
Measurement PPTMeasurement PPT
Measurement PPT
 

Viewers also liked

Pie charts (interpreting and drawing)
Pie charts (interpreting and drawing)Pie charts (interpreting and drawing)
Pie charts (interpreting and drawing)sidraqasim99
 
Pie charts explained
Pie charts explainedPie charts explained
Pie charts explainedDaksha Bhat
 
Read electric meter
Read electric meterRead electric meter
Read electric meterJorge Jasso
 
How to make pie chart and it’s uses
How to make pie chart and it’s usesHow to make pie chart and it’s uses
How to make pie chart and it’s usesMohammed Rahat Kaleem
 
Pie charts and graphs slideshare
Pie charts and graphs slidesharePie charts and graphs slideshare
Pie charts and graphs slideshareamy_adele22
 
Volume of solid rectangular prism
Volume of solid rectangular prismVolume of solid rectangular prism
Volume of solid rectangular prismBrenda Obando
 
Mathematics for Grade 5, Topic: Pie Graph
Mathematics for Grade 5, Topic: Pie GraphMathematics for Grade 5, Topic: Pie Graph
Mathematics for Grade 5, Topic: Pie GraphDepartment of Education
 
Converting Metric Units
Converting Metric UnitsConverting Metric Units
Converting Metric UnitsPassy World
 
Line Graph Presentation
Line Graph Presentation Line Graph Presentation
Line Graph Presentation Jennifer Field
 
Interpreting charts and graphs
Interpreting charts and graphsInterpreting charts and graphs
Interpreting charts and graphslesliejohnson441
 

Viewers also liked (20)

Pie chart
Pie chartPie chart
Pie chart
 
Circle graphs[1]
Circle graphs[1]Circle graphs[1]
Circle graphs[1]
 
PIE GRAPH
PIE GRAPHPIE GRAPH
PIE GRAPH
 
Pie charts (interpreting and drawing)
Pie charts (interpreting and drawing)Pie charts (interpreting and drawing)
Pie charts (interpreting and drawing)
 
Pie chart
Pie chartPie chart
Pie chart
 
Pie Charts
Pie ChartsPie Charts
Pie Charts
 
Pie charts explained
Pie charts explainedPie charts explained
Pie charts explained
 
Bar Graph
Bar GraphBar Graph
Bar Graph
 
Bar Graphs
Bar GraphsBar Graphs
Bar Graphs
 
Water meter
Water meterWater meter
Water meter
 
Bar chart
Bar chartBar chart
Bar chart
 
Read electric meter
Read electric meterRead electric meter
Read electric meter
 
How to make pie chart and it’s uses
How to make pie chart and it’s usesHow to make pie chart and it’s uses
How to make pie chart and it’s uses
 
Pie Chart or Bar Chart?
Pie Chart or Bar Chart?Pie Chart or Bar Chart?
Pie Chart or Bar Chart?
 
Pie charts and graphs slideshare
Pie charts and graphs slidesharePie charts and graphs slideshare
Pie charts and graphs slideshare
 
Volume of solid rectangular prism
Volume of solid rectangular prismVolume of solid rectangular prism
Volume of solid rectangular prism
 
Mathematics for Grade 5, Topic: Pie Graph
Mathematics for Grade 5, Topic: Pie GraphMathematics for Grade 5, Topic: Pie Graph
Mathematics for Grade 5, Topic: Pie Graph
 
Converting Metric Units
Converting Metric UnitsConverting Metric Units
Converting Metric Units
 
Line Graph Presentation
Line Graph Presentation Line Graph Presentation
Line Graph Presentation
 
Interpreting charts and graphs
Interpreting charts and graphsInterpreting charts and graphs
Interpreting charts and graphs
 

Similar to Circle Graphs

Math 227 Sample Project Project 1 Data Collection and Desc
Math 227 Sample Project Project 1 Data Collection and DescMath 227 Sample Project Project 1 Data Collection and Desc
Math 227 Sample Project Project 1 Data Collection and DescAbramMartino96
 
STAT200 Assignment #2 - Descriptive Statistics Analysis and.docx
STAT200 Assignment #2 - Descriptive Statistics Analysis and.docxSTAT200 Assignment #2 - Descriptive Statistics Analysis and.docx
STAT200 Assignment #2 - Descriptive Statistics Analysis and.docxsusanschei
 
STAT200 Assignment #2 - Descriptive Statistics Analysis and.docx
STAT200 Assignment #2 - Descriptive Statistics Analysis and.docxSTAT200 Assignment #2 - Descriptive Statistics Analysis and.docx
STAT200 Assignment #2 - Descriptive Statistics Analysis and.docxrafaelaj1
 
An Educational PPT on Handling data
An Educational PPT on Handling dataAn Educational PPT on Handling data
An Educational PPT on Handling dataBhartendu Jain
 
What is the KMeans Clustering Algorithm and How Does an Enterprise Use it to ...
What is the KMeans Clustering Algorithm and How Does an Enterprise Use it to ...What is the KMeans Clustering Algorithm and How Does an Enterprise Use it to ...
What is the KMeans Clustering Algorithm and How Does an Enterprise Use it to ...Smarten Augmented Analytics
 
Building and deploying analytics
Building and deploying analyticsBuilding and deploying analytics
Building and deploying analyticsCollin Bennett
 
Business Analytics 1 Module 4.pdf
Business Analytics 1 Module 4.pdfBusiness Analytics 1 Module 4.pdf
Business Analytics 1 Module 4.pdfJayanti Pande
 
Sheet1Washer ThicknessKevinYuxuanBolt DimensionsKevinYuxuanSample .docx
Sheet1Washer ThicknessKevinYuxuanBolt DimensionsKevinYuxuanSample .docxSheet1Washer ThicknessKevinYuxuanBolt DimensionsKevinYuxuanSample .docx
Sheet1Washer ThicknessKevinYuxuanBolt DimensionsKevinYuxuanSample .docxmaoanderton
 
Machine Learning, K-means Algorithm Implementation with R
Machine Learning, K-means Algorithm Implementation with RMachine Learning, K-means Algorithm Implementation with R
Machine Learning, K-means Algorithm Implementation with RIRJET Journal
 
STATISTCAL MEASUREMENTS.pptx
STATISTCAL MEASUREMENTS.pptxSTATISTCAL MEASUREMENTS.pptx
STATISTCAL MEASUREMENTS.pptxShyma Jugesh
 
Metric Recovery from Unweighted k-NN Graphs
Metric Recovery from Unweighted k-NN GraphsMetric Recovery from Unweighted k-NN Graphs
Metric Recovery from Unweighted k-NN Graphsjoisino
 
ESMA 650 Fall2023 Topic C02 Cost Estimation Methods.pptx
ESMA 650 Fall2023 Topic C02 Cost Estimation Methods.pptxESMA 650 Fall2023 Topic C02 Cost Estimation Methods.pptx
ESMA 650 Fall2023 Topic C02 Cost Estimation Methods.pptxAhmadMayyas3
 
Analysis of indian weather data sets using data mining techniques
Analysis of indian weather data sets using data mining techniquesAnalysis of indian weather data sets using data mining techniques
Analysis of indian weather data sets using data mining techniquescsandit
 
AlgorithmsModelsNov13.pptx
AlgorithmsModelsNov13.pptxAlgorithmsModelsNov13.pptx
AlgorithmsModelsNov13.pptxPerumalPitchandi
 
Dsa module 1 ppt
Dsa module 1 pptDsa module 1 ppt
Dsa module 1 pptSree Kanth
 

Similar to Circle Graphs (20)

Math 227 Sample Project Project 1 Data Collection and Desc
Math 227 Sample Project Project 1 Data Collection and DescMath 227 Sample Project Project 1 Data Collection and Desc
Math 227 Sample Project Project 1 Data Collection and Desc
 
STAT200 Assignment #2 - Descriptive Statistics Analysis and.docx
STAT200 Assignment #2 - Descriptive Statistics Analysis and.docxSTAT200 Assignment #2 - Descriptive Statistics Analysis and.docx
STAT200 Assignment #2 - Descriptive Statistics Analysis and.docx
 
STAT200 Assignment #2 - Descriptive Statistics Analysis and.docx
STAT200 Assignment #2 - Descriptive Statistics Analysis and.docxSTAT200 Assignment #2 - Descriptive Statistics Analysis and.docx
STAT200 Assignment #2 - Descriptive Statistics Analysis and.docx
 
An Educational PPT on Handling data
An Educational PPT on Handling dataAn Educational PPT on Handling data
An Educational PPT on Handling data
 
M2R Group 26
M2R Group 26M2R Group 26
M2R Group 26
 
Preprocessing_new.ppt
Preprocessing_new.pptPreprocessing_new.ppt
Preprocessing_new.ppt
 
What is the KMeans Clustering Algorithm and How Does an Enterprise Use it to ...
What is the KMeans Clustering Algorithm and How Does an Enterprise Use it to ...What is the KMeans Clustering Algorithm and How Does an Enterprise Use it to ...
What is the KMeans Clustering Algorithm and How Does an Enterprise Use it to ...
 
Building and deploying analytics
Building and deploying analyticsBuilding and deploying analytics
Building and deploying analytics
 
Business Analytics 1 Module 4.pdf
Business Analytics 1 Module 4.pdfBusiness Analytics 1 Module 4.pdf
Business Analytics 1 Module 4.pdf
 
Sheet1Washer ThicknessKevinYuxuanBolt DimensionsKevinYuxuanSample .docx
Sheet1Washer ThicknessKevinYuxuanBolt DimensionsKevinYuxuanSample .docxSheet1Washer ThicknessKevinYuxuanBolt DimensionsKevinYuxuanSample .docx
Sheet1Washer ThicknessKevinYuxuanBolt DimensionsKevinYuxuanSample .docx
 
Machine Learning, K-means Algorithm Implementation with R
Machine Learning, K-means Algorithm Implementation with RMachine Learning, K-means Algorithm Implementation with R
Machine Learning, K-means Algorithm Implementation with R
 
STATISTCAL MEASUREMENTS.pptx
STATISTCAL MEASUREMENTS.pptxSTATISTCAL MEASUREMENTS.pptx
STATISTCAL MEASUREMENTS.pptx
 
Metric Recovery from Unweighted k-NN Graphs
Metric Recovery from Unweighted k-NN GraphsMetric Recovery from Unweighted k-NN Graphs
Metric Recovery from Unweighted k-NN Graphs
 
ESMA 650 Fall2023 Topic C02 Cost Estimation Methods.pptx
ESMA 650 Fall2023 Topic C02 Cost Estimation Methods.pptxESMA 650 Fall2023 Topic C02 Cost Estimation Methods.pptx
ESMA 650 Fall2023 Topic C02 Cost Estimation Methods.pptx
 
forecasting.pptx
forecasting.pptxforecasting.pptx
forecasting.pptx
 
forecasting.pptx
forecasting.pptxforecasting.pptx
forecasting.pptx
 
Diagrams part 4
Diagrams part 4Diagrams part 4
Diagrams part 4
 
Analysis of indian weather data sets using data mining techniques
Analysis of indian weather data sets using data mining techniquesAnalysis of indian weather data sets using data mining techniques
Analysis of indian weather data sets using data mining techniques
 
AlgorithmsModelsNov13.pptx
AlgorithmsModelsNov13.pptxAlgorithmsModelsNov13.pptx
AlgorithmsModelsNov13.pptx
 
Dsa module 1 ppt
Dsa module 1 pptDsa module 1 ppt
Dsa module 1 ppt
 

More from Bruce Coulter

More from Bruce Coulter (20)

Unit 4 Notes
Unit 4 NotesUnit 4 Notes
Unit 4 Notes
 
Unit 5 Notes
Unit 5 NotesUnit 5 Notes
Unit 5 Notes
 
Respiration Notes
Respiration NotesRespiration Notes
Respiration Notes
 
Kinematics 2012
Kinematics 2012Kinematics 2012
Kinematics 2012
 
The Heart
The HeartThe Heart
The Heart
 
Managing Money
Managing Money Managing Money
Managing Money
 
Unit 3 Statistics
Unit 3 Statistics Unit 3 Statistics
Unit 3 Statistics
 
Vehicle Finance
Vehicle Finance Vehicle Finance
Vehicle Finance
 
Unit 3 Precision Measurement
Unit 3  Precision MeasurementUnit 3  Precision Measurement
Unit 3 Precision Measurement
 
Unit 2 Notes
Unit 2 NotesUnit 2 Notes
Unit 2 Notes
 
Unit 2 3D Geometry
Unit 2 3D GeometryUnit 2 3D Geometry
Unit 2 3D Geometry
 
Unit 1 Interest & Credit
Unit 1   Interest & CreditUnit 1   Interest & Credit
Unit 1 Interest & Credit
 
Unit 2 - Statistics
Unit 2 - StatisticsUnit 2 - Statistics
Unit 2 - Statistics
 
Unit 1 Home Finance
Unit 1   Home FinanceUnit 1   Home Finance
Unit 1 Home Finance
 
Chem 40S Unit 5 Notes
Chem 40S Unit 5 NotesChem 40S Unit 5 Notes
Chem 40S Unit 5 Notes
 
Chem 40S Unit 4 Notes
Chem 40S Unit 4 NotesChem 40S Unit 4 Notes
Chem 40S Unit 4 Notes
 
Chem 40S Unit 3 Notes
Chem 40S Unit 3 NotesChem 40S Unit 3 Notes
Chem 40S Unit 3 Notes
 
Chem 40Ss Unit 2 Notes
Chem 40Ss Unit 2 NotesChem 40Ss Unit 2 Notes
Chem 40Ss Unit 2 Notes
 
Chem 40S Uunit 1 Notes
Chem 40S Uunit 1 NotesChem 40S Uunit 1 Notes
Chem 40S Uunit 1 Notes
 
Unit 5 Immune System
Unit 5 Immune SystemUnit 5 Immune System
Unit 5 Immune System
 

Recently uploaded

Unit-IV; Professional Sales Representative (PSR).pptx
Unit-IV; Professional Sales Representative (PSR).pptxUnit-IV; Professional Sales Representative (PSR).pptx
Unit-IV; Professional Sales Representative (PSR).pptxVishalSingh1417
 
Advanced Views - Calendar View in Odoo 17
Advanced Views - Calendar View in Odoo 17Advanced Views - Calendar View in Odoo 17
Advanced Views - Calendar View in Odoo 17Celine George
 
SOCIAL AND HISTORICAL CONTEXT - LFTVD.pptx
SOCIAL AND HISTORICAL CONTEXT - LFTVD.pptxSOCIAL AND HISTORICAL CONTEXT - LFTVD.pptx
SOCIAL AND HISTORICAL CONTEXT - LFTVD.pptxiammrhaywood
 
The basics of sentences session 2pptx copy.pptx
The basics of sentences session 2pptx copy.pptxThe basics of sentences session 2pptx copy.pptx
The basics of sentences session 2pptx copy.pptxheathfieldcps1
 
APM Welcome, APM North West Network Conference, Synergies Across Sectors
APM Welcome, APM North West Network Conference, Synergies Across SectorsAPM Welcome, APM North West Network Conference, Synergies Across Sectors
APM Welcome, APM North West Network Conference, Synergies Across SectorsAssociation for Project Management
 
Russian Escort Service in Delhi 11k Hotel Foreigner Russian Call Girls in Delhi
Russian Escort Service in Delhi 11k Hotel Foreigner Russian Call Girls in DelhiRussian Escort Service in Delhi 11k Hotel Foreigner Russian Call Girls in Delhi
Russian Escort Service in Delhi 11k Hotel Foreigner Russian Call Girls in Delhikauryashika82
 
Paris 2024 Olympic Geographies - an activity
Paris 2024 Olympic Geographies - an activityParis 2024 Olympic Geographies - an activity
Paris 2024 Olympic Geographies - an activityGeoBlogs
 
microwave assisted reaction. General introduction
microwave assisted reaction. General introductionmicrowave assisted reaction. General introduction
microwave assisted reaction. General introductionMaksud Ahmed
 
Explore beautiful and ugly buildings. Mathematics helps us create beautiful d...
Explore beautiful and ugly buildings. Mathematics helps us create beautiful d...Explore beautiful and ugly buildings. Mathematics helps us create beautiful d...
Explore beautiful and ugly buildings. Mathematics helps us create beautiful d...christianmathematics
 
Measures of Dispersion and Variability: Range, QD, AD and SD
Measures of Dispersion and Variability: Range, QD, AD and SDMeasures of Dispersion and Variability: Range, QD, AD and SD
Measures of Dispersion and Variability: Range, QD, AD and SDThiyagu K
 
Nutritional Needs Presentation - HLTH 104
Nutritional Needs Presentation - HLTH 104Nutritional Needs Presentation - HLTH 104
Nutritional Needs Presentation - HLTH 104misteraugie
 
Class 11th Physics NEET formula sheet pdf
Class 11th Physics NEET formula sheet pdfClass 11th Physics NEET formula sheet pdf
Class 11th Physics NEET formula sheet pdfAyushMahapatra5
 
Presentation by Andreas Schleicher Tackling the School Absenteeism Crisis 30 ...
Presentation by Andreas Schleicher Tackling the School Absenteeism Crisis 30 ...Presentation by Andreas Schleicher Tackling the School Absenteeism Crisis 30 ...
Presentation by Andreas Schleicher Tackling the School Absenteeism Crisis 30 ...EduSkills OECD
 
Web & Social Media Analytics Previous Year Question Paper.pdf
Web & Social Media Analytics Previous Year Question Paper.pdfWeb & Social Media Analytics Previous Year Question Paper.pdf
Web & Social Media Analytics Previous Year Question Paper.pdfJayanti Pande
 
PROCESS RECORDING FORMAT.docx
PROCESS      RECORDING        FORMAT.docxPROCESS      RECORDING        FORMAT.docx
PROCESS RECORDING FORMAT.docxPoojaSen20
 
Introduction to Nonprofit Accounting: The Basics
Introduction to Nonprofit Accounting: The BasicsIntroduction to Nonprofit Accounting: The Basics
Introduction to Nonprofit Accounting: The BasicsTechSoup
 
1029 - Danh muc Sach Giao Khoa 10 . pdf
1029 -  Danh muc Sach Giao Khoa 10 . pdf1029 -  Danh muc Sach Giao Khoa 10 . pdf
1029 - Danh muc Sach Giao Khoa 10 . pdfQucHHunhnh
 
Beyond the EU: DORA and NIS 2 Directive's Global Impact
Beyond the EU: DORA and NIS 2 Directive's Global ImpactBeyond the EU: DORA and NIS 2 Directive's Global Impact
Beyond the EU: DORA and NIS 2 Directive's Global ImpactPECB
 
Accessible design: Minimum effort, maximum impact
Accessible design: Minimum effort, maximum impactAccessible design: Minimum effort, maximum impact
Accessible design: Minimum effort, maximum impactdawncurless
 
Z Score,T Score, Percential Rank and Box Plot Graph
Z Score,T Score, Percential Rank and Box Plot GraphZ Score,T Score, Percential Rank and Box Plot Graph
Z Score,T Score, Percential Rank and Box Plot GraphThiyagu K
 

Recently uploaded (20)

Unit-IV; Professional Sales Representative (PSR).pptx
Unit-IV; Professional Sales Representative (PSR).pptxUnit-IV; Professional Sales Representative (PSR).pptx
Unit-IV; Professional Sales Representative (PSR).pptx
 
Advanced Views - Calendar View in Odoo 17
Advanced Views - Calendar View in Odoo 17Advanced Views - Calendar View in Odoo 17
Advanced Views - Calendar View in Odoo 17
 
SOCIAL AND HISTORICAL CONTEXT - LFTVD.pptx
SOCIAL AND HISTORICAL CONTEXT - LFTVD.pptxSOCIAL AND HISTORICAL CONTEXT - LFTVD.pptx
SOCIAL AND HISTORICAL CONTEXT - LFTVD.pptx
 
The basics of sentences session 2pptx copy.pptx
The basics of sentences session 2pptx copy.pptxThe basics of sentences session 2pptx copy.pptx
The basics of sentences session 2pptx copy.pptx
 
APM Welcome, APM North West Network Conference, Synergies Across Sectors
APM Welcome, APM North West Network Conference, Synergies Across SectorsAPM Welcome, APM North West Network Conference, Synergies Across Sectors
APM Welcome, APM North West Network Conference, Synergies Across Sectors
 
Russian Escort Service in Delhi 11k Hotel Foreigner Russian Call Girls in Delhi
Russian Escort Service in Delhi 11k Hotel Foreigner Russian Call Girls in DelhiRussian Escort Service in Delhi 11k Hotel Foreigner Russian Call Girls in Delhi
Russian Escort Service in Delhi 11k Hotel Foreigner Russian Call Girls in Delhi
 
Paris 2024 Olympic Geographies - an activity
Paris 2024 Olympic Geographies - an activityParis 2024 Olympic Geographies - an activity
Paris 2024 Olympic Geographies - an activity
 
microwave assisted reaction. General introduction
microwave assisted reaction. General introductionmicrowave assisted reaction. General introduction
microwave assisted reaction. General introduction
 
Explore beautiful and ugly buildings. Mathematics helps us create beautiful d...
Explore beautiful and ugly buildings. Mathematics helps us create beautiful d...Explore beautiful and ugly buildings. Mathematics helps us create beautiful d...
Explore beautiful and ugly buildings. Mathematics helps us create beautiful d...
 
Measures of Dispersion and Variability: Range, QD, AD and SD
Measures of Dispersion and Variability: Range, QD, AD and SDMeasures of Dispersion and Variability: Range, QD, AD and SD
Measures of Dispersion and Variability: Range, QD, AD and SD
 
Nutritional Needs Presentation - HLTH 104
Nutritional Needs Presentation - HLTH 104Nutritional Needs Presentation - HLTH 104
Nutritional Needs Presentation - HLTH 104
 
Class 11th Physics NEET formula sheet pdf
Class 11th Physics NEET formula sheet pdfClass 11th Physics NEET formula sheet pdf
Class 11th Physics NEET formula sheet pdf
 
Presentation by Andreas Schleicher Tackling the School Absenteeism Crisis 30 ...
Presentation by Andreas Schleicher Tackling the School Absenteeism Crisis 30 ...Presentation by Andreas Schleicher Tackling the School Absenteeism Crisis 30 ...
Presentation by Andreas Schleicher Tackling the School Absenteeism Crisis 30 ...
 
Web & Social Media Analytics Previous Year Question Paper.pdf
Web & Social Media Analytics Previous Year Question Paper.pdfWeb & Social Media Analytics Previous Year Question Paper.pdf
Web & Social Media Analytics Previous Year Question Paper.pdf
 
PROCESS RECORDING FORMAT.docx
PROCESS      RECORDING        FORMAT.docxPROCESS      RECORDING        FORMAT.docx
PROCESS RECORDING FORMAT.docx
 
Introduction to Nonprofit Accounting: The Basics
Introduction to Nonprofit Accounting: The BasicsIntroduction to Nonprofit Accounting: The Basics
Introduction to Nonprofit Accounting: The Basics
 
1029 - Danh muc Sach Giao Khoa 10 . pdf
1029 -  Danh muc Sach Giao Khoa 10 . pdf1029 -  Danh muc Sach Giao Khoa 10 . pdf
1029 - Danh muc Sach Giao Khoa 10 . pdf
 
Beyond the EU: DORA and NIS 2 Directive's Global Impact
Beyond the EU: DORA and NIS 2 Directive's Global ImpactBeyond the EU: DORA and NIS 2 Directive's Global Impact
Beyond the EU: DORA and NIS 2 Directive's Global Impact
 
Accessible design: Minimum effort, maximum impact
Accessible design: Minimum effort, maximum impactAccessible design: Minimum effort, maximum impact
Accessible design: Minimum effort, maximum impact
 
Z Score,T Score, Percential Rank and Box Plot Graph
Z Score,T Score, Percential Rank and Box Plot GraphZ Score,T Score, Percential Rank and Box Plot Graph
Z Score,T Score, Percential Rank and Box Plot Graph
 

Circle Graphs

  • 1. Unit 2 – Data Analysis & Interpretation Consumer Mathematics 30S Using Circle Graphs to Represent Data
  • 2. Circle Graphs Another way to display data is in the form of a circle graph or pie chart. Circle graphs are useful in displaying percentages, or parts of a whole. Unit 2 – Data Analysis & Interpretation Consumer Mathematics 30S
  • 3. Circle Graphs Unit 2 – Data Analysis & Interpretation Consumer Mathematics 30S Properties of Circle Graphs: • They are circular shaped graphs with the entire circle representing the whole. • The circle is then split into parts, or sectors. • Each sector represents a part of the whole. • Each sector is proportional in size to the amount each sector represents, therefore it is easy to make generalizations and comparisons.
  • 4. Constructing Circle Graphs Unit 2 – Data Analysis & Interpretation Consumer Mathematics 30S When constructing a circle graph, follow the steps below 1. Is the Data Suitable--Determine if there is a "whole" for the data. Then determine what the different parts, or data groups, of the whole are. 2. Calculate Percentages--For data that is not already given as a percentage, convert the amounts for each part, or data group size, into a percentage of the whole. 3. Draw the Graph--Draw a circle and draw in a sector for each data group. 4. Title and Label the Graph--Label the sectors with the data group name and percentage. Then add a title to the graph. This is the same as the title of the table.
  • 5. Example Unit 2 – Data Analysis & Interpretation Consumer Mathematics 30S Construct a circle graph for the following data.
  • 6. Constructing a Circle Graph Unit 2 – Data Analysis & Interpretation Consumer Mathematics 30S Step 1 – Is the Data Suitable? • There are five parts to the whole. Each data group is a category of sneaker brands (1) Adidas, (2) Nike, (3) Reebok, (4) Asics, (5) Other. Step 2 – Calculate Percentages • Calculate the whole: 150 + 192 + 60 + 108 + 90 = 600 • Calculate the percentage for each part ex. Adidas: 150/600 = .25 or 25%
  • 7. Constructing a Circle Graph Unit 2 – Data Analysis & Interpretation Consumer Mathematics 30S Step 3 – Draw the Graph • First, draw a circle. Then, draw in the sectors of the circle using a protractor to calculate the size of the sector. • The percentage has to be converted to a degrees. ex. 25% or .25 x 360o = 90o Step 4 – Title and Label the Graph
  • 8. Can circle graphs be misleading? Unit 2 – Data Analysis & Interpretation Consumer Mathematics 30S Classroom Activity: Page 118 - 119
  • 9. Unit 2 – Data Analysis & Interpretation Consumer Mathematics 30S Textbook Assignment: Page 120 - 121 Questions 1 - 2
  • 10. Unit 2 – Data Analysis & Interpretation Consumer Mathematics 30S Textbook Assignment: Page 120 - 121 Questions 1 - 2