Micro-Scholarship, What it is, How can it help me.pdf
Statistics assignment
1. AssignmentonStatisticsformanagement
1 | P a g e
Ans 1. Meaning of classification:
Classification is a process ofarranging things or data in groups or classes
according to their resemblances and affinities.
According to Secrist, “Classification is the process ofarranging data into
sequences and groups according to their common characteristics or separating
them into different but related parts”.
According to Stocktonand Clark, “The process ofgrouping large number of
individual facts and observations, on the basis of similarity among the items is
called Classification”.
Meaning of Tabulation:
Tabulation follows classification. It is a logical or systematic listing of related
data in rows and columns. The row of a table represents the horizontal
arrangement of data and column represents the vertical arrangement of data.
The presentation of data in tables should be simple, systematic and
unambiguous.
The objectives of tabulation are to:
a) Simplify complex data
b) Highlight important characteristics
c) Present data in minimum space
d) Facilities comparison
e) Bring out trends and tendencies
f) Facilitate further analysis
Difference betweenClassificationand Tabulation:
Classification Tabulation
It is the basis for tabulation It is the basis for further analysis
It is the basis for simplification It is the basis for presentation
Data is divided into groups and sub-
groups on the basis of similarities and
dissimilarities
Data is listed according to a logical
sequence of related characteristics
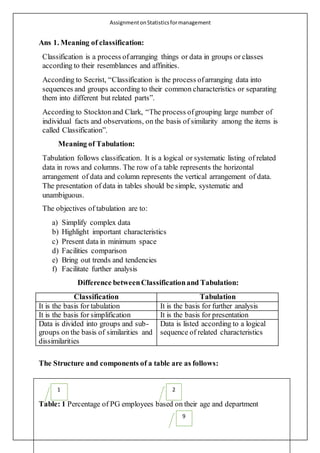
The Structure and components of a table are as follows:
Table: 1 Percentage of PG employees based on their age and department
1 2
9
2. AssignmentonStatisticsformanagement
2 | P a g e
(Age in Years)
Source:…………….
Tab 1: Table Number
Tab 2: Title
Tab 3 & 4: Caption
Tab 5 & 6: Subheadings (Stubs)
Tab 7: Body of the table
Tab 8: Totals
Tab 9: Head note
Tab 10:Source of note
Ans 2. Arithmetic mean is defined as the sum of all values divided by number
of values and is represented by ....Arithmetic mean is also called ‘average’. It
is most commonly used in measures of central tendency. Arithmetic mean of a
series is the value obtained by adding all the observations of a series and
dividing this total by the number of observations.
There are two types of Arithmetic Mean:
a) Simple Arithmetic Mean – Arithmetic mean is simply sometimes referred
as ‘Mean’. Forexample: mean income, mean expenses, mean marks, etc.
Unlike other averages, mean has to be computed by considering each and
ever observation in the series. Hence, the mean cannot be found by either
inspection or observation of items.
Departments Age
20-40 40 and above
Accounts 2.658 1.348
Finance 2.359 1.267
Personal 3.168 1.648
Production 4.251 2.159
Marketing 1.459 4.359
Total 13.895 10.781
35
7
4
10
8
9
3. AssignmentonStatisticsformanagement
3 | P a g e
Simple Arithmetic Mean is equal to the sum of values of the variables
divided by their number of observations.
b) Weighted Arithmetic Mean – Weighted Arithmetic mean is computed by
considering the relative importance of each of the values to the total value.
The Arithmetic mean gives equal importance to all the items of
distribution. In certain cases, relative importance of items is not the same.
To give relative importance, weightage may be given to variables
depending on cases. Thus, weightage represents the relative importance of
the items.
Solution:
We have by data, X1 =75, σ1 = 5, N1 = 1000
X2=60, σ2 = 4.5, N1 = 1500
Combined Mean:
N1 X1 + N2 X2 1000*75+ 1500*60
X12 = = = 66
N1 + N2 1000 + 1500
Combined Standard deviation:
d1 = X1 –X12 = (75-66) = 9 Therefore, d1
2 = 81
d2 = X1 – X12 = (60-66) = -6 Therefore, d2
2 = 36
(N1 +N2 ) σ2 = N1 (σ1
2 + d1
2) + N2 (σ2
2 + d2
2)
(1000+1500) σ2 = 1000 (52 +81) + 1500 (4.52 + 36)
2500 σ2 = 190375
σ2 = 76.15
Therefore, σ = 8.73
Ans 3. Solution:
Let Xi be the random variable and P (Xi) be its probability. The
probabilities and indicated in the below given table:
Required Values for calculating Meanand Variance for the data
No. (Xi) P (Xi) Xi P(Xi)
1 -2 1/6 -2/6
2 4 1/6 4/6
3 -6 1/6 -6/6
4 8 1/6 8/6
5 -10 1/6 -10/6
4. AssignmentonStatisticsformanagement
4 | P a g e
6 12 1/6 12/6
Total 1 1
Therefore, Expectation of Mr. Arun is E (X) = ∑ Xi P ( Xi) = 1
Ans 4. Solution:
Given that:
𝑝 =
20
100
= 0.2
Therefore, q = 1 - 0.2 = 0.8
N = 5
Therefore, by binomial distribution, P (X = x) = 5 C x (0.8) 5-x
(0.2)x
I. The probability that none of the employees get the diseaseis
given by: P (X = 0) = (0.8)5
= 0.3277
Therefore, the probability that none of the employees get the
diseaseis 0.3277
II. The probability that exactly two employees will get the diseaseis
given by : P (X = 2) =5
C2 (0.8)3
(0.2)2
=(10) (0.512)(0.04) =0.2048
Therefore, the probability that exactly two employees will get the
diseaseis 0.2048
III. The probability that more than four employees will get the
diseases is given by: P (X > 4) = P(X = 5) = (0.2)5
= 0.00032
Therefore, the probability that more than four employees will get
the diseaseis 0.00032
Ans 5. Solution:
The procedureis explained in the following steps:
1. Null hypothesis Ho : p = 0.35
Alternate hypothesis H1 : p < 0.35
2. Level of significance α = 0.05 ⇒ Ztab =-1.645 and R:z < -1.645
3. Test statistics
𝑍 =
(ˆ𝑝 − 𝑝)
√(
𝑝𝑞
𝑛
) √(
𝑁 − 𝑛
𝑁 − 1
)
5. AssignmentonStatisticsformanagement
5 | P a g e
4. Given ˆp = 950/3000 = 19/60 = 0.317, p = 0.35, q = 1-p = 1- p = 1- 0.35 =
0.65, N = 10,000, n = 3000
√(
𝑝𝑞
𝑛
)√(
𝑁 − 𝑛
𝑁 − 1
) = √(
0.35∗ 0.65
3000
)√(
10000− 3000
10000 − 1
) = 0.0073
Zcal =
(0.317−0.35)
0.0073
= - 4.52
5. Conclusion: Since Zcal (-4.52) < Ztab (-1.645) and is in the rejection
region. Ho is rejected. At 5% level of significance, we conclude that the
proportion of sceptical people has significantly decreased.
Ans 6. The Chi-square test is one of the most commonly used non-parametric
tests in statistical work. The Greek letter 𝑥2 is used to denote this test. 𝑥2
describe the magnitude of discrepancy between the observed and the expected
frequencies. The value of 𝑥2 is calculated as:
( Oi – Ei )2 ( O1 – E1 )2 ( O2 – E2 )2 ( O3 – E3 )2 ( On – En )2
𝑥2 = Ʃ = + + +….+
Ei E1 E2 E3 En
Where, O1 , O2 , O3 …..onare the observed frequencies and E1, E2, E3,
….En are the corresponding expected or theoretical frequencies.
Conditions for applying the Chi-Square test
The following are the conditions for using the Chi-Square test:
1. The frequencies used in Chi-Square test must be absolute and not in
relative terms.
2. The total number of observations collected for this test must be large.
3. Each of the observations which make up the sample of this test must be
independent of each other.
4. As 𝑥2 test is based wholly on sample data, no assumption is made
concerning the population distribution. In other words, it is a non-
parametric test.
5. 𝑥2 test is wholly dependent on degrees of freedom. As the degrees of
freedom increase, the Chi-Square distribution curve becomes
symmetrical.
6. AssignmentonStatisticsformanagement
6 | P a g e
6. The expected frequency of any item or cell must not be less than 5, the
frequencies of adjacent items or cells should be polled together in order to
make it more than 5.
7. The data should be expressed in original units for convenience of
comparison and the given distribution should be replaced by relative
frequencies or proportions.
8. This test is used only for drawing interferences through test of the
hypothesis, so it cannot be used for estimation of parameter values.