C2.01: Cabled ocean observatories as tools for studying biodiversity change - Kim Juniper

Recent initiatives have established cabled ocean observatories from the subtidal zone down to abyssal depths, including sites in the North Pacific (Ocean Networks Canada, U.S. Ocean Observatories Initiative, DONET-Japan, MACHO-Taiwan), the Arctic (Ocean Networks Canada), the Atlantic (EMSO-Azores), the northwestern Mediterranean (EMSO-OBSEA) and in coral reef habitats (OCTOPUS-Okinawa; QIMOS-Australia). Cabled observatories enable real-time, continuous monitoring of seawater properties and ocean currents, and biological features that can be detected using video and still cameras and hydrophones. These integrated sensor systems provide opportunities for long-term observations of biodiversity change, in relation to environmental variables. The planned, multi-decadal lifetimes of cabled observatories should allow seasonal and inter-annual variability to be 'filtered' from longer term trends that could be related to ocean change. International organizations such as the Group on Earth Observations' Biodiversity Observation Network (GEO-BON) and the European Multidisciplinary Seafloor and water-column Observations (EMSO) network are developing monitoring programs and suites of "Essential Biodiversity Variables" that are intended to establish a standardized, global framework for detecting biodiversity change, based on scientific principles. This presentation will consider how some of these essential variables can be monitored continuously, using current cabled observatory technologies, with the aim of encouraging the development of a coordinated international program. We will use examples from the VENUS, NEPTUNE and Arctic observatories operated by Ocean Networks Canada, the EMSO OBSEA and Azores test sites, and the OCTOPUS coral reef observatory, to illustrate how underwater cameras and sensors can be used to quantify seasonal shifts in community composition, responses to rapid changes in oceanographic conditions, and ecosystem service activities such as seafloor bioturbation. Ultimately, observatory technologies could become valuable tools for managing human impacts on marine ecosystems, through the provision of baseline information and the detection of acute and long-term ecosystem responses to disturbance.

Recommended
Recommended
More Related Content
What's hot
What's hot (13)
Viewers also liked
Viewers also liked (13)
Similar to C2.01: Cabled ocean observatories as tools for studying biodiversity change - Kim Juniper
Similar to C2.01: Cabled ocean observatories as tools for studying biodiversity change - Kim Juniper (20)
More from Blue Planet Symposium
More from Blue Planet Symposium (20)
Recently uploaded
Recently uploaded (20)
C2.01: Cabled ocean observatories as tools for studying biodiversity change - Kim Juniper
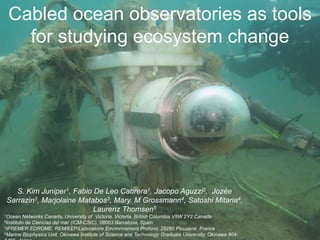
- 1. Arctic Change 2014 | Ottawa Cabled ocean observatories as tools for studying ecosystem change S. Kim Juniper1, Fabio De Leo Cabrera1, Jacopo Aguzzi2, Jozée Sarrazin3, Marjolaine Matabos3, Mary. M Grossmann4, Satoshi Mitaria4, Laurenz Thomsen5 1Ocean Networks Canada, University of Victoria, Victoria, British Columbia V8W 2Y2 Canada 2Instituto de Ciencias del mar (ICM-CSIC), 08003 Barcelona, Spain 3IFREMER EDROME, REM/EEP/Laboratoire Environnement Profond, 29280 Plouzané, France 4Marine Biophysics Unit, Okinawa Institute of Science and Technology Graduate University, Okinawa 904-
- 2. Arctic Change 2014 | Ottawa What are cabled ocean observatories? • Power and communications cable to shore • Single or multiple instrument platforms • Data archived in near-real-time • Data accessed through online interface
- 3. Arctic Change 2014 | Ottawa Node module Instrument platforms
- 4. Arctic Change 2014 | OttawaOCTOPUS Coral Reef Observatory – Okinawa
- 5. Arctic Change 2014 | Ottawa www.obsea.es OBSEA (Spain)
- 6. Arctic Change 2014 | Ottawa Essential biodiversity variables (EBVs) Standardized, global framework for detecting biodiversity change, based on scientific principles EBV Category Measurable with cabled observatory technology Genetic composition not yet Species populations ** Species traits * Community composition ** Ecosystem function * Ecosystem structure *
- 7. Arctic Change 2014 | Ottawa EBV studies using cabled observatory technology Advantages • Continuous and real-time observations • Co-located imagery and sensor data • Few power or data storage limitations Constraints • Fixed locations, limited spatial footprint • Species IDs often require sampling • Installation and maintenance costs
- 8. Arctic Change 2014 | Ottawa EBV studies using time-series imaging coupled with oceanographic sensors Community Dynamics • Species presence/absence & abundance versus oceanographic variables • Community responses to perturbations – experimental manipulationsEcosystem Processes • Quantifying ecosystem services (eg. surface bioturbation) • Chronobiology – activity and abundance rhythms
- 9. Arctic Change 2014 | Ottawa Vent fauna in a dynamic habitat
- 10. Arctic Change 2014 | Ottawa Tidal periodicity and microhabitat preferences Cuvelier et al. (2014) PLOS ONE 9 (5) Periodogram – tubeworm extension/retraction Period (hours) Pycnogonid distribution heat map (23 days)
- 11. Arctic Change 2014 | Ottawa Events - Barkley Canyon Pod 3 – camera and oceanographic sensors Surface storm drives water mass change and megafaunal species shift at 900 m depth Matabos et al. (2014) J. Mar. Syst. 130, 56-68 Water mass shift shrimp whelk
- 12. Arctic Change 2014 | Ottawa 0 100 200 300 400 500 01Jan.2014 01Mar.2014 01May.2014 01Jul.2014 01Sept.2013 01N ov.2013 *1000Trichomes/m3 /Hr 20.0 22.5 25.0 27.5 Temperature (°C) 01Jan. 2014 01Mar. 2014 01May. 2014 01Jul.2014 01Sept. 2013 01N ov. 2013 Hourlyabundance Typhoon Neoguri Okinawa Phytoplankton response to typhoon Okinawa - Trichodesmium bloom
- 13. Arctic Change 2014 | OttawaSeasonal patterns Juniper et al. (2013) Deep-Sea Res. II 92, 114-12 Seasonal presence/absence trends in benthic megafauna at 900 m
- 14. Arctic Change 2014 | OttawaSeasonal Migrations – diapausing copepods Ongoing study - matching abundance peaks with environmental triggers
- 15. Arctic Change 2014 | Ottawa Pod 1 – canyon axis at 1000 m depth Seasonal Migrations – Tanner crabs
- 16. Arctic Change 2014 | OttawaSeasonal patterns - annual hypoxia cycle
- 17. Arctic Change 2014 | OttawaQuantifying Ecosystem Services - Surface bioturbation Robert & Juniper (2012) MEPS doi: 10.3354/meps09623 Number of days required to turn over 8.8 m2 study area Frequency Sea urchin + flatfish bioturbation Bayesian model output Upper slope 400 m depth
- 18. Arctic Change 2014 | Ottawa Current meter Microsensors Camera Methane CTD Turbidity Fluorescence Wally – mobile sensor platform
- 19. Arctic Change 2014 | OttawaInter-Annual Change on Methane Hydrate Mounds - comparing image mosaics from Wally‘s camera Methods in Oceanography 5 (2013): 1-18..
- 20. Arctic Change 2014 | OttawaExperimental use of cabled observatories Deep-water forensics Whale bone colonization Organic enrichmen t Deep-sea recruitment (INDEEP)
- 21. Arctic Change 2014 | OttawaEarly benthic successional processes on implanted substrata me-lapse video from frame grabs (8 months of data): May 2014 – Jan 201 Authigenic carbonate Wood - Douglas Fir 3 Humpback ribs Bacterial mat growth over time
- 22. Arctic Change 2014 | Ottawa Imagery - a key source of biological information
- 23. Arctic Change 2014 | Ottawa Aguzzi et al., 2015. Rev. Fish. Biol. Fisher. Accepted Detecting change - How many observations? Number of images
- 24. Arctic Change 2014 | Ottawa Addressing the image analysis bottleneck • Computer vision Object recognition algorithms • Crowd sourcing Citizen science Number of images
- 25. Arctic Change 2014 | Ottawa slightly from the fish detection stage due to slow moving fish and heavily crowded scenes. The false positives decreased significantly; the few which occurred were mainly due to fish over counting from failed tracking. Thefalse negatives(missed counts) were typically caused by occlusion which caused the tracking algorithm to fail, or as a result of the aforementioned failed segmentation. An example of a failed tracking result due to occlusion is shown in Figure 7. Fig. 7. A sample frame with a failed tracking due to fish occlusion (note that both fish in bottom right are contained in one bounding box). Thetracking method showed someability to detect occluded fish, but only if at some point the fish swim in different di- rections and enough information is gathered from the separate tracks to conclude they are two separate fish. V. CONCLUSION AND FUTURE WORK This paper presented a novel approach for detecting, track- ing, and counting fish in noisy deep-sea videos. The method was developed using an experimental database provided by Ocean Networks Canada, recorded at the Barkley Canyon Detection module: • Precision: 65.8% • Sensitivity: 84.5% Tracking and Counting module: • Precision: 83.8% • Sensitivity: 77.9% . Fier et al. IEEE Oceans 2014 Failed tracking Successful tracking Fish counting algorithms
- 26. Arctic Change 2014 | Ottawa A B Aguzzi et al., 2011. Sensors-Basel 11: 5850-5872 Automated time-series fish counts Combined with sensor data
- 27. Arctic Change 2014 | Ottawa Crowd Sourcing Comparative Study • Crowd sourcing, computer algorithm, expert, 3rd year biology class • Same video clip time series analyzed by all
- 28. Arctic Change 2014 | Ottawa Preliminary results ● ● ● ● ● 0.20 0.25 0.30 0.35 0.40 0.45 Expert Algorithm Student advCrowd novCrowd Absolutedifferencefromglobalmean vs. global mean 0.0 0.2 0.4 0.6 0.0 0.2 0.4 0.6 0.0 0.2 0.4 0.6 0.0 0.2 0.4 0.6 0.0 0.2 0.4 0.6 ExpertAlgorithmStudentadvCrowdnovCrowd 0 5 10 15 20 25 30 35 40 45 50 55 60 65 70 75 Period (1 hour) Whittaker−RobinsonStatistic Periodogram
- 29. Arctic Change 2014 | Ottawa A nested collaborative approach? 0 5 10 0 5 10 0 5 10 0 5 10 0 5 10 ExpertAlgorithmStudentadvCrowdnovCrowd Oct 17 Oct 24 Oct 31 Nov 06 SablefishCounts Algorithm scans time series for trends/events Focused crowd sourcing to improve data Expert analysis for research publication
- 30. Arctic Change 2014 | Ottawa Summary Studying ecosystem change with cabled ocean observatories Community Dynamics • Species presence/absence & abundance versus oceanographic variables • Community responses to perturbations natural and experimental Ecosystem Processes • Quantifying ecosystem services surface bioturbation • Chronobiology activity and abundance rhythms Challenge – image analysis bottleneck
- 31. Arctic Change 2014 | Ottawa Acknowledgements • Canada Foundation for Innovation • British Columbia Knowledge Development Fund • Natural Sciences and Engineering Research Council of Canada • University of Victoria
- 32. Arctic Change 2014 | Ottawa Data Access and Data Tools • all sensor data and imagery archived • free and open access to all data and imagery • online graphical previews of scalar data • online viewing of annotated, archived video • downloads of all data Seatube Plotting utility Data Acquisition Parser, Calibration Data QA/QC Data Storage File Management Archive Database Data Archiving www.oceannetworks.ca
- 33. Arctic Change 2014 | Ottawa Kirill Dudko - Donestk, Ukraine Citizen Science - the unexpected “I saw a monster eat a hagfish…” January 2013
- 34. Arctic Change 2014 | Ottawa
- 35. Arctic Change 2014 | Ottawa New Main Instrument Platform Arctic • Less studied than other Arctic marine habitats. • More likely to be impacted by human disturbance
- 36. Arctic Change 2014 | Ottawa Main Instrument Platform PAR sensor CTD pump outlet HD video camera Preliminary Results - seasonal trends in species presence/absence and activity