Climate Change v 2012
•Als PPTX, PDF herunterladen•
1 gefällt mir•560 views

The document discusses several factors related to climate change: 1. It discusses three primary factors that influence Earth's orbit and axial tilt - eccentricity, axial tilt, and precession - and how these Milankovitch cycles impact climate over long time periods. 2. It explains the Ruddiman hypothesis, which suggests that human agricultural activities beginning around 8,000 years ago prevented the onset of a natural ice age, and industrialization in the 19th century further disrupted the climate cycle. 3. It provides examples of how human activities like fossil fuel use, deforestation, and agriculture have increased greenhouse gases in the atmosphere like carbon dioxide and methane, driving unprecedented modern climate change.

Empfohlen
Weitere ähnliche Inhalte
Was ist angesagt?
Was ist angesagt? (16)
Ähnlich wie Climate Change v 2012
Ähnlich wie Climate Change v 2012 (20)
Mehr von Gordon M. Groat
Mehr von Gordon M. Groat (13)
Kürzlich hochgeladen
Kürzlich hochgeladen (20)
Climate Change v 2012
- 3. Climate Systems Climate Planetary Position & Human Solar Output Change Systems Ecological Systems
- 4. This is a physically Impossible view of Earth imaged by Galileo Orbiter taken directly over the South Pole. Why is this view physically impossible? Image credit NASA/JPL
- 5. Solar Insolation Milankovitch Cycles The Anthropocene Stall The Ruddiman early Anthropocene hypothesis suggests that if solar insolation and Milankovitch cycle theories are ascribed to, then Earth is in an Ice Age now... But that the effects and full onset of a normal Ice Age have been forsetalled by the onset of agrarian activities some 8,000 years ago and accelerated in the 19th century by the advent of the industrial age
- 6. 3 Primary Factors Eccentricity Axial Tilt Precession Credit: Montana State University Department of Earth Sciences Dr. William W. Locke A hypertext for the appreciation of glaciers, and how they work By the students in Geology 445 Glacial Geology - Spring, 1999
- 11. Grinnell Glacier taken from the Grinnell Glacier Overlook off the Highline Trail, Glacier National Park. The view of Grinnell Glacier taken circa 1940 shows the early formation of Upper Grinnell Lake, a pro-glacier lake visible at the terminus of the glacier.
- 12. The lake continues to enlarge as the glacier recedes. Icebergs can be seen floating in Upper Grinnell Lake. This this photo was taken in 2005. Credit: Blase Reardon US Geological Survey
- 14. The Sun observed by SUMER instrument on the SOHO satellite on March 2-4, 1996. (Source: SOHO - SUMER Instrument).
- 15. Volcanic eruptions may send ash and sulphate gas high into the atmosphere. The sulphate may combine with water to produce tiny droplets (aerosols) of sulphuric acid, which reflect sunlight back into space. Large eruptions reach the middle stratosphere (19 miles to 30 kilometres high). At this altitude, the aerosols can spread around the world.
- 17. Cloud feedback could accelerate global warming. Fewer low level clouds mean that more sunlight reaches Earth’s surface, leading to further warming. Credit: Goddard Space Flight Center - EOS Project Science Office
- 18. Credit: University of Hawaii at Manoa College of Tropical Agriculture and Human Resources CTAHR Exchange – C. Y. Hu Sustainable Agriculture
- 22. Source:
- 23. Source:
- 24. 400 Billion at risk today 3.5 Trillion at risk by 2070 Source:
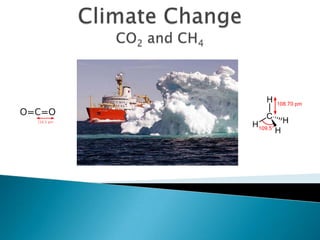
- 25. CO2 carbon dioxide CH4 Methane N2 O Nitrous oxide High GWP (global warming potential) gas ◦ HFC’s hydrofluorocarbons ◦ PFCs perfluorocarbons ◦ SF6 sulphur hexafluoride * To name some
- 27. The Montreal Protocol demonstrates what can be achieved with global perspective, effective collaboration, and prudent stewardship.
- 28. 2006 World Meteorological Organization/United Nations Environment Programme Scientific Assessment of Ozone Depletion concluded the ozone hole recovery would be masked by annual variability for the near future and the ozone hole would fully recover in approximately 2065. Full Recovery estimated 2065
- 31. We know about CO2 and CH4 We can mitigate through human intervention Methane Gas (CH4) has significant potential to damage to Earth’s Atmosphere There could be 400 Gigatons of Methane locked in the frozen Arctic Tundra
- 32. Methane has significant capacity to accelerate global warming We do not know if there is a tipping point in atmospheric composition It is possible that Methane can contribute to a chain reaction that could alter the fundamental composition of atmospheric gases
- 33. Massive Organic Content Warming causes microbial activity that generates methane Methane on this scale could tip climate change beyond human control
- 39. Seeding the ocean with iron to produce extensive phytoplankton blooms Off the coast of Vancouver Island, Canada. Millions of tiny ocean plants called phytoplankton Risks: Oceanic ecosystem complexity Production of domoic acid Toxic to marine mammal life Credit: NASA Goddard Space Flight Center (MODIS)
- 49. 1 typical car annual = 5.5 tonnes 100 watt light bulb annual = .9 tonnes Upgrading and refining 10 barrels of bitumen = 1 tonne Cool It - Free Online CO2 Calculator http://www.cool-it.us/index.php?refer=&task=carbon&step=1
Hinweis der Redaktion
- As Climate Change accelerates, the need for Canada to assume a global leadership role grows.
- While some may debate if climate change is anthropogenic, there is little room to debate the global land-ocean temperature index. The rise is indisputable and, if it continues, there are other factors that can further accelerate climate change. Methane release is certainly a very important subject in this context.What Causes Climate Change?Climate change is enormously complex. We know it is caused by Earth (natural causes) and Human systems a.k.a. anthropological impact. Emissions of gases, aerosols, and various pollutants combined with anthropological changes in global ecosystems weave an intricate and complex fabric of climate change accelerators (CCA).Earth systems, i.e. (natural causes) contribute to climate change primarily via planetary positioning relative to the sun and variance of solar output. It is also impacted by volcanic activity and other naturally occurring geological events.Of the human generated greenhouse gases, it is CO2 that represents the largest human system contribution to climate change. Methane CH4 has significant potential to accelerate climate change.
- Climate change is a result the interwoven fabric of Earth and Human systems. No one solution can possibly resolve the issue. The only logical solutions are to fund and conduct research in the environmental sciences and take actionable steps designed to reduce the human contribution to climate change. We’ve all heard that a journey of a thousand miles begins with a single step. The precise impact human changes will have upon complex global ecosystems are impossible to fully predict. As such, existing technologies are not sufficient to resolve climate change. That said, combinations of international, national, provincial, state, and municipal policies and action may mitigate the greenhouse gas (GHG) emissions that are classified as anthropogenic. Applied research, extending technologies, and reducing human contribution to climate change are, without a doubt, part of an immense matrix for success. Ecological systems also have tremendous impact. Mass extinction events, geologically speaking, can be traced to roughly correlate with massive releases of methane into the atmosphere. Methane is a GHG that is substantially more potent then man made GHG emissions. There are manmade contributions to methane emissions, namely through the protein consumption requirements of a growing planetary population and, as the mean oceanic and atmospheric temperatures rise, methane release from microorganisms feeding on organic material and the release of methane from methane hydrate form will accelerate. This will be felt first, fastest, and hardest in the Arctic.
- This image is beautiful – but it’s not an image we are widely familiar with. I show this for two reasons. First, it demonstrates that humanity is capable of great science. The second reason is that it clearly demonstrates that humans are extraordinarily gifted at thinking “outside” the box when faced with challenging tasks.This view of the Earth shows a wonderfully unique but physically impossible view of the southern hemisphere and Antarctica. While a spacecraft could find itself directly over the Earth's pole, roughly half of the image should be in darkness! This view was created by mosaicing together several images taken by Galileo over a 24 hour period and projecting them as they would be seen from above the pole. The continents of South America, Africa, and Australia are respectively seen at the middle left, upper right, and lower right. The slightly bluish ice and snow of Antarctica include large ice shelves (upper left, lower middle), a broad fan of broken offshore pack ice (lower left and middle) and continental glaciers protruding into the sea (lower right).Most spacecraft traveling near the Earth's poles are in very low Earth orbit, and cannot acquire panoramic shots like this one. Galileo's view of the southern hemisphere, combined with the spacecraft's special spectral properties (four separate narrowband filters that measure the brightness of reflected light at specific infrared wavelengths), led to a number of unique observations. For example, Galileo's cameras distinguished between ice and high stratospheric clouds, allowing scientists to study the correlation between these clouds and growth of the ozone hole.This image and other images and data received from Galileo are posted on the World Wide Web, on the Galileo mission home page at URL http://galileo.jpl.nasa.gov. Image Credit: NASA/JPL Image Addition Date: 1997-09-10nental glaciers protruding into the sea (lower right). The regularly spaced weather systems are prominent.
- There is evidence that greenhouse gas levels fell at the start of ice ages and rose during the retreat of the ice sheets, but it is difficult to establish cause and effect. What we do know is that the influence of these cycles on insolation (INcidentSOLarradiATION) at different latitudes has been calculated by Berger (1991), and Laskar (1993). In the Northern Hemisphere, peak summer insolation occurred about 9,000 years ago when the last of the large ice sheets melted. Since that time Northern Hemisphere summers have seen less solar radiation.Greenhouse gas levels may also have been affected by other factors which have been proposed as causes of ice ages, such as the movement of continents and volcanism. The Snowball Earth hypothesis maintains that the severe freezing in the late Proterozoic was ended by an increase in CO2 levels in the atmosphere, and some supporters of Snowball Earth argue that it was caused by a reduction in atmospheric CO2. The hypothesis also warns of future Snowball Earths.The August, 2009 edition of Science provides further evidence that changes in solar insolation provide the initial trigger for the Earth to warm after an Ice Age, with secondary factors like increases in greenhouse gases accounting for the magnitude of the change. The insolation into a surface is largest when the surface directly faces the Sun. As the angle increases between the direction at a right angle to the surface and the direction of the rays of sunlight, the insolation is reduced in proportion to the cosine of the angle.William Ruddiman has proposed the earlyanthropocene hypothesis, according to which the anthropocene era, as some people call the most recent period in the Earth's history when the activities of the human race first began to have a significant global impact on the Earth's climate and ecosystems, did not begin in the 18th century with the advent of the Industrial Era, but dates back to 8,000 years ago, due to intense farming activities of our early agrarian ancestors. It was at that time that atmospheric greenhouse gas concentrations stopped following the periodic pattern of the Milankovitch cycles. In his overdue-glaciation hypothesis Ruddiman states that an incipient ice age would probably have begun several thousand years ago, but the arrival of that scheduled ice age was forestalled by the activities of early farmers.Clark, Peter U.; Dyke, Arthur S.; Shakun, Jeremy D.; Carlson, Anders E.; Clark, Jorie; Wohlfarth, Barbara; Mitrovica, Jerry X.; Hostetler, Steven W. et al. (2009), "The Last Glacial Maximum", Science325 (5941): 710–714
- Milankovitch CyclesEccentricity – Eccentricity is not favourable to glaciation – periodicity 100,000 yearsEccentricity changes the shape of the Earth's orbit around the Sun. This constantly fluctuating, orbital shape ranges between more and less elliptical (0 to 5% ellipticity) on a cycle of about 100,000 years. These oscillations alter the distance from the Earth to the Sun, thus changing the distance the Sun's short wave radiation must travel to reach Earth, subsequently reducing or increasing the amount of radiation received at the Earth's surface in different seasons.Current Status: 3% variance estimated between nearest and farthest point and probably increases the solar energy received in Jan by aprox. 6%> than July. The most elliptical orbit would create a 20 to 30% greater range between nearest and furthest point a.k.a. Aphelion (furthest point) and Perihelion (closest point).Axial Tilt – Axial tilt is not favourable to glaciation – periodicity 41,000 yearsToday the Earth's axial tilt is about 23.5 degrees, which largely accounts for our seasons. Because of the periodic variations of this angle the severity of the Earth's seasons changes. With less axial tilt the Sun's solar radiation is more evenly distributed between winter and summer. However, less tilt also increases the difference in radiation receipts between the equatorial and polar regions. One hypothesis for Earth's reaction to a smaller degree of axial tilt is that it would promote the growth of ice sheets. This response would be due to a warmer winter, in which warmer air would be able to hold more moisture, and subsequently produce a greater amount of snowfall. In addition, summer temperatures would be cooler, resulting in less melting of the winter's accumulation. At present, axial tilt is in the middle of its range.Precession - precession is in the glacial mode – periodicity 23,000 yearsPrecessionis the Earth's slow wobble as it spins on axis. This wobbling of the Earth on its axis can be likened to a top running down, and beginning to wobble back and forth on its axis. The precession of Earth wobbles from pointing at Polaris (North Star) to pointing at the star Vega. When this shift to the axis pointing at Vega occurs, Vega would then be considered the North Star. This top-like wobble, or precession, has a periodicity of 23,000 years.Credit: Montana State University Department of Earth Sciences, Dr. William W. LockeA hypertext for the appreciation of glaciers, and how they work By the students in Geology 445 Glacial Geology - Spring, 1999
- Climate forcing or “anthropogenic” causes began to create a large variation in climate temperature at the onset of the industrial age. Modern forcing catalysts include man-made aerosols, solar irradiance, and volcanic aerosols. The onset of the industrial age is clearly defined when all forcings are compared graphically with GHG forcing and the rise of global temperature.
- There is substantial scientific evidence that anthropogenic causes are contributing to the rising mean global temperature. Some scientists suggest there is enough evidence to consider that we are now shifting from a
- Glacier Deterioration : Pederson Glacier andthe Muir and Riggs Glaciers in AlaskaSometimes a picture speaks a thousand words. These photographs document a relatively short period of geologic time during a time when Milankovitch Cycles would predict ice sheet growth, and yet, we can see in evidence all around us, that glaciers are retreating on a planetary scale and at an accelerating pace.
- Glacier Deterioration South Cascade range in Washington, USA.
- The Grinnell Glacier in Montana, USA
- US Geological Survey photo creditPhoto by Blase Reardon of the U.S. Geological Survey.
- When the Larsen B Ice Shelf in Antarctica collapsed in 2002, the event appeared to be a sudden response to climate change, and this long, fringing ice shelf in the north west part of the Weddell Sea was assumed to be the latest in a long line of victims of Antarctic summer heat waves linked to Global Warming.Prof. Neil Glasser of Aberystwyth University, working as a Fulbright Scholar in the US, and Dr. Ted Scambos of University of Colorado’s National Snow and Ice Data Centre, in the Journal of Glaciology, say that the shelf was already teetering on collapse before the final summer.“Ice shelf collapse is not as simple as we first thought,” said Professor Glasser, lead author of the paper. “Because large amounts of meltwater appeared on the ice shelf just before it collapsed, we had always assumed that air temperature increases were to blame. But our new study shows that ice-shelf break up is not controlled simply by climate. A number of other atmospheric, oceanic and glaciological factors are involved. For example, the location and spacing of fractures on the ice shelf such as crevasses and rifts are very important too because they determine how strong or weak the ice shelf is”.The study is important because ice shelf collapse contributes to global sea level rise, albeit indirectly. “Ice shelves themselves do not contribute directly to sea level rise because they are floating on the ocean and they already displace the same volume of water. But when the ice shelves collapse the glaciers that feed them speed up and get thinner, so they supply more ice to the oceans,” Prof. Glasser explained.Professor Glasser acknowledges that global warming had a major part to play in the collapse, but emphasises that it is only one in a number of contributory factors, and despite the dramatic nature of the break-up in 2002, both observations by glaciologists and numerical modeling by other scientists at NASA and CPOM (Centre of Polar Observation and Modeling) had pointed to an ice shelf in distress for decades previously. “It’s likely that melting from higher ocean temperatures, or even a gradual decline in the ice mass of the Peninsula over the centuries, was pushing the Larsen to the brink”, said co-author Ted Scambos of University of Colorado’s National Snow and Ice Data Centre.
- Much of the energy that drives the various Earth systems (climate systems, ecosystems, hydrologic systems, etc.) originates from the Sun. Solar energy is created at the core of the Sun when hydrogen atoms are fused into helium by nuclear fusion. For each second of this nuclear process, 700 million tons of hydrogen are converted into 695 million tons of helium. The remaining 5 million tons are turned into electromagnetic energy that radiates from the Sun's surface out into space.The radiative surface of the Sun, or photosphere, has an average temperature of about 58,00 Kelvins...Apx. (57,726 C or 103,940 F)The Earth's orbital path varies in the degree to which it is circular. This change in its "eccentricity" varies between 0.00 and 0.06 on a 100,000 year cycle. When the eccentricity equals 0.00 the orbital path is circular and when it is 0.06 the orbital path is slightly elliptical. The current value is 0.0167 and is not favourable to glaciation.
- Volcanic ActivityVolcanic dust blasted into the atmosphere causes temporary cooling. The amount of cooling depends on the amount of dust put into the air, and the duration of the cooling depends on the size of the dust particles. Particles the size of sand grains fall out of the air in a matter of a few minutes and stay close to the volcano. These particles have little effect on the climate. Tiny dust-size ash particles thrown into the lower atmosphere will float around for hours or days, causing darkness and cooling directly beneath the ash cloud, but these particles are quickly washed out of the air by the abundant water and rain present in the lower atmosphere. However, dust tossed into the dry upper atmosphere, the stratosphere, can remain for weeks to months before they finally settle. These particles block sunlight and cause some cooling over large areas of the earth.Volcanic eruptions may send ash and sulphate gas high into the atmosphere. The sulphate may combine with water to produce tiny droplets (aerosols) of sulphuric acid, which reflect sunlight back into space. Large eruptions reach the middle stratosphere (19 miles to 30 kilometres high). At this altitude, the aerosols can spread around the world.A massive volcanic eruption can cool the Earth for one or two years. The 1982 El Chichon eruption and the 1991 Pinatubo eruption caused the globally averaged surface temperature to cool less than 1°F.
- Volcanoes that release large amounts of sulphur compounds like sulphur oxide or sulphur dioxide affect the climate more strongly than those that eject just dust. The sulphur compounds are gases that rise easily into the stratosphere. Once there, they combine with the (limited) water available to form a haze of tiny droplets of sulphuric acid. These tiny droplets are very light in color and reflect a great deal of sunlight for their size. Although the droplets eventually grow large enough to fall to the earth, the stratosphere is so dry that it takes time, months or even years to happen. Consequently, reflective hazes of sulphur droplets can cause significant cooling of the Earth for as long as two years after a major sulphur-bearing eruption. sulphur hazes are believed to have been the primary cause of the global cooling that occurred after the Pinatubo and Tambora eruptions. For many months, a satellite tracked the sulphur cloud produced by Pinatubo. The image shows the cloud about three months after the eruption.Volcanoes also release large amounts of water and carbon dioxide. When these two compounds are in the form of gases in the atmosphere, they absorb heat radiation (infrared) emitted by the ground and hold it in the atmosphere. This causes the air below to get warmer. Therefore, you might think that a major eruption would cause a temporary warming of the atmosphere rather than a cooling. However, there are very large amounts of water and carbon dioxide in the atmosphere already, and even a large eruption doesn't change the global amounts very much. In addition, the water generally condenses out of the atmosphere as rain in a few hours to a few days, and the carbon dioxide quickly dissolves in the ocean or is absorbed by plants. Consequently, the sulphur compounds have a greater short-term effect, and cooling dominates. However, over long periods of time (thousands or millions of years), multiple eruptions of giant volcanoes, such as the flood basaltvolcanoes, can raise the carbon dioxide levels enough to cause significant global warming.
- Changes in clouds result from changes in the distribution of water vapour, temperature, and winds. The effects of global warming on these factors are complex and not well understood. Met Office (UK gov) atmospheric research modeling predicts that low-level cloud cover over a test area decreased under global warming, creating positive feedback. This is apparently due to an increase in sea-surface temperatures and weakening of the large-scale atmospheric circulation. While this provides a significant step in understanding the link between low-level cloud and climate change, there are still no conclusive answers according to the Met Office.Further research indicates that aerosols may also play a role in cloud formation. Tiny aerosol particles can “seed” clouds by providing the “nuclei” around which cloud droplets are formed. High concentrations of some aerosol types may affect the character of clouds by causing many tiny droplets to form rather than a few big ones. Clouds with more tiny droplets reflect more solar energy and tend to produce less rainfall. This spectacular “blue marble” image is a detailed true-color image of the entire Earth. Using a collection of satellite-based observations, scientists and visualizers stitched together months of observations of the land surface, oceans, sea ice, and clouds into a seamless, true-color mosaic of every square kilometre of our planet. These images are freely available to educators, scientists, museums, and the public.Much of the information contained in this image came from a single remote-sensing device-NASA’s Moderate Resolution Imaging Spectroradiometer, or MODIS. Flying over 700 km above the Earth onboard the Terra satellite, MODIS provides an integrated tool for observing a variety of terrestrial, oceanic, and atmospheric features of the Earth. The land and coastal ocean portions of these images are based on surface observations collected from June through September 2001 and combined, or composited, every eight days to compensate for clouds that might block the sensor’s view of the surface on any single day. Two different types of ocean data were used in these images: shallow water true color data, and global ocean color (or chlorophyll) data. Topographic shading is based on the GTOPO 30 elevation dataset compiled by the U.S. Geological Survey’s EROS Data Center. MODIS observations of polar sea ice were combined with observations of Antarctica made by the National Oceanic and Atmospheric Administration’s AVHRR sensor—the Advanced Very High Resolution Radiometer. The cloud image is a composite of two days of imagery collected in visible light wavelengths and a third day of thermal infra-red imagery over the poles. Terra/MODIS Visualization Date2002-02-08 The Visible Earth is part of the EOS Project Science Office, Goddard Space Flight Center.Low Level Met Office Credit: Clement, A.C., Burgman, R. and Norris, J.R., 2009: Observational and model evidence for positive low-level cloud feedback. Science, 325, 460-464, DOI: 10.1126/science.1171255 .
- Methane (CH4) is the second largest GHG that is produced due to human activity. In addition to the methane produced from the increasing demand for protein in developing countries, land is often deforested in order to accommodate the production of protein, thus accelerating climate change.
- The U.S. Department of Energy NCAR Climate Model makes a prediction based on GHG emissions without substantial curbs... a.k.a. Business as Usual (BAU) model. With this extrapolation, the expected precipitation changes can be considered to be substantial. This is likely to present in the form of single storm events and overall, year over year, precipitation increases. The impact is likely to be felt in municipal infrastructure from waterways and sewer systems to snow removal.
- This is the analysis assuming .5 meter sea level rise by 2070 of the top 20 port cities by population.
- The B.C. Government has received a report that projects sea level rise in order to create mitigation strategies for coastal areas.
- Top 10 countries exposed by assets exposed assuming a .5 meter rise in sea level by 2070.
- China, India, Bangladesh, Vietnam, and the United States are the top five countries whose population will be exposed to factors related to climate change in coastal areas.
- Miami is the most at risk – with approximately 400 billion at risk to day. This is expected to move towards 3.5 trillion in exposure by 2070. This presumes a global sea level rise of .5 meters by 2070
- CO2 CO2 is still, after significant scientific analysis, widely considered to be the largest contributing factor to climate change. Scientists have estimated the contribution to warming made by a range of gases, dust and solar radiation. They have a high level of certainty that greenhouse gases contribute the most to warming, with increases in CO2 as the greatest contributor with about 1.4 watts/meter2.Aerosols Methane, nitrous oxide, and halocarbons make smaller contributions. Scientists have a lower level of certainty about the contributions of reductions in stratospheric ozone and increases in tropospheric aerosols, which cool the Earth by 0.3 watts/meter2 and 0.9 watts/meter2 respectively. Solar radiation may also contribute to warming but scientists have a very low certainty about the level of this contribution.
- Human Systems - CO2CO2 accounts for approximately 70% of anthropogenic contribution to GHG’s. The image above shows the estimated impact from the preindustrial era to the present, measured in watts/metre2.Other major anthropogenic emissions include Methane (CH4), Nitrous Oxide (N2O), and various gases that have a high global warming potential (GWP).
- Clearly, there can be positive change and the human species is capable of making positive changes that do have global impact. The Montreal Protocol is an important example of this.
- The Vienna Convention for the Protocol of the Ozone layer treaty was opened for signature on September 16, 1987, and entered into force on January 1, 1989As a result of the Montreal Protocol and its amendments, the concentrations of ozone-depleting substances in the lower atmosphere (troposphere) peaked around 1995 and are decreasing in both the troposphere and stratosphere. It is estimated these gases reached peak levels in the Antarctica stratosphere in 2001. However, these ozone-depleting substances typically have very long lifetimes in the atmosphere (more than 40 years). As a result of this slow decline, the ozone hole is estimated to annually very slowly decrease in area by about 0.1 to 0.2 percent for the next five to 10 years. This slow decrease is masked by large year-to-year variations caused by Antarctic stratospheric weather fluctuations. The recently completed 2006 World Meteorological Organization/United Nations Environment Programme Scientific Assessment of Ozone Depletion concluded the ozone hole recovery would be masked by annual variability for the near future and the ozone hole would fully recover in approximately 2065.http://www.nasa.gov/vision/earth/lookingatearth/ozone_record.html
- CFC-11 levels have peaked and decreased. This represents the value of global collaboration.Although there are now quantitative constraints on the global magnitude of the emissions of some GHG’s, only educated guesses can be made as to the relative importance of their individual sources: enteric (cattle, etc.) and soil (rice, etc.) methanogens, biomass burning, fossil fuel mining, clathrates, etc. for CH4; soil and oceanic denitrifiers, biomass and fossil fuel combustion, etc. for N2O.The Montreal Protocol demonstrates that human systems intervention is possible and can achieve positive results.
- CFC-12 stabilization and reduction is also seen
- Some scientists estimate400 gigatons of methane locked in the frozen arctic tundra may be enough to start a chain reaction. The kind of warming the Arctic Council predicts is sufficient to melt the clathrates and release substantial quantities of greenhouse gas into the atmosphere.A growing body of data shows that more methane is emanating from the rapidly thawing Arctic Ocean than previously thought. This has caught the attention of many climate scientists. There are concerns that vast releases of huge quantities of sub-sea Arctic methane long trapped by a permafrost layer could accelerate climate change at unprecedented rates. In recent years, climate scientists have been concerned about a so-called “methane time bomb” on land, which would be detonated when warming Arctic temperatures melt permafrost and cause frozen vegetation in peat bogs and other areas to decay, releasing methane and carbon dioxide. Now come fears of a methane time bomb, part two, this one bursting from the sea floor of the shallow Arctic continental shelf. The Arctic sea floor contains a rich, decayed layer of vegetation from earlier eras when the continental shelf was not underwater.
- This scenario could ultimately lead to mass extinction most planetary species, including humans.According to Gregory Ryskin, associate professor of chemical engineering at Northwestern University, "explosive clouds of methane gas, initially trapped in stagnant bodies of water and suddenly released, could have killed off the majority of marine life and land animals and plants at the end of the Permian era" — long before dinosaurs lived and died. Ryskin believes that methane may have been the driving force in previous catastrophic changes of the earth's climate, where 95 percent of marine species and 70 percent of land species were lost in - geologically speaking - the blink of an eye.Once triggered, this cycle could result in runaway global warming. Strong geologic evidence suggests something similar has happened at least twice before.The most recent of these catastrophes occurred about 55 million years ago in what geologists call the Paleocene-Eocene Thermal Maximum (PETM), when methane burps caused rapid warming and massive die-offs, disrupting the climate for more than 100,000 years.The granddaddy of these catastrophes occurred 251 million years ago, at the end of the Permian period, when a series of methane burps came close to wiping out all life on Earth.More than 94 percent of the marine species present in the fossil record disappeared suddenly as oxygen levels plummeted and life teetered on the verge of extinction. Over the ensuing 500,000 years, a few species struggled to gain a foothold in the hostile environment. It took 20 million to 30 million years for even rudimentary coral reefs to re-establish themselves and for forests to regrow. In some areas, it took more than 100 million years for ecosystems to reach their former healthy diversity.
- Few national scientific leaders are talking about the possibility of massive methane release from the Arctic as global temperatures warm. The most notable issue is related to Arctic warming where massive amounts of organic content is stored. As the temperatures rise and the organic material begins to be consumed by microbes, they will emit methane which will be released into the atmosphere.
- Regardless of the arguments for and against the relative factors that impact global climate change, the fact that it is happening is indisputable. Glacial deterioration and polar ice cap deterioration are both well documented. Accordingly, it becomes increasingly clear that humanity must seek, through science, rational policy, and political solutions, a logical strategy to mitigate and reduce the human driven components of global climate change.
- As of March 2009, CO2 in the Earth’s Atmosphere was at a concentration of 387 parts per million by volume. Carbon dioxide has no liquid state at pressures below 5.1 atmospheres. At 1 atmosphere (near mean sea level pressure), the gas deposits directly to a solid at temperatures below -78 °C and the solid sublimes directly to a gas above -78 °C. In its solid state, carbon dioxide is commonly called dry ice.
- Why the Fluctuation in the Annual Cycle?Atmospheric concentrations of carbon dioxide fluctuate slightly with the change of the seasons, driven primarily by seasonal plant growth in the Northern Hemisphere. Concentrations of carbon dioxide fall during the northern spring and summer as plants consume the gas, and rise during the northern autumn and winter as plants go dormant, die and decay. Due to human systems such as the combustion of fossil fuels and deforestation, the concentration of atmospheric carbon dioxide has increased by about 35% since the industrial age. Emissions of CO2 by human activities are currently more than 130 times greater than the quantity emitted by volcanoes, amounting to about 27 billion tonnes per year.The oceansThere is about 50 times as much carbon dissolved in the oceans in the form of CO2 and carbonic acid, bicarbonate and carbonate ions as exists in the atmosphere. The oceans act as an enormous carbon sink, having "absorbed about one-third of all human-generated CO2 emissions to date.” Gas solubility decreases as the temperature of water increases and therefore the rate of uptake from the atmosphere decreases as ocean temperatures rise.Most of the CO2 taken up by the ocean forms carbonic acid in equilibrium with bicarbonate and carbonate ions. Some is consumed in photosynthesis by organisms in the water, and a small proportion of that sinks and leaves the carbon cycle. Increased CO2 in the atmosphere has led to increasing acidity (strictly, decreasing alkalinity) of seawater and there is some concern that this may adversely affect organisms living in the water. In particular, with decreasing alkalinity, the availability of carbonates for forming shells decreases.
- Ice Core data supports the trend progression of data points gathered since 1958 at Mauna Loa.Analysis of proxy records, such as gas bubbles trapped in glacial ice, at a variety of places throughout the world suggests that the atmospheric concentration of CO2 has varied considerably over geologic time but generally remained in the range 280 +/- 10 ppm for several thousand years prior to the onset of the industrial era. Over the 420,000 years preceding the industrial era the concentration appears not to have exceeded 300 ppm (Barnola et al., 1999)An Italian monitoring site on Lampedusa Island, just south of Sicily, shows an increase from 360.8 ppm in 1993 to 371.3 ppm in 2000 (Chamard et al., 2001)(Figure1), and the CDIAC data files (http://cdiac.esd.ornl.gov) contain records from over 50 different sampling sites. It seems clear that the atmospheric concentration of CO2 is increasing and that it is now in a range that has not been experienced for perhaps 20 million years (IPCC, 2001).Source: THE INCREASING CONCENTRATION OF ATMOSPHERIC CO2: HOW MUCH, WHEN, AND WHY?Gregg Marland and Tom Boden, Environmental Sciences DivisionOak Ridge National Laboratory
- This picture shows the Earth’s carbon “metabolism”, the rate at which plants absorbed carbon out of the atmosphere during the years 2001 and 2002. The map shows the global, annual average of the net productivity of vegetation on land and productivity of the oceanic carbon sink. Simply stated, the largest carbon sink rates of consumption are in Red and Yellow where carbon absorption rates can range from 2 to 3 kilograms of carbon consumed per square kilometre annually. Green areas reflect intermediate rates of carbon absorption. Blue and Purple areas represent lower rates of absorption while the areas of grey, such as the Arctic or Antarctic, are at the bottom of the scale.Although tropical rainforests are the chief carbon sinks on Earth, oceanic organisms still absorb about the same amount, making the ocean roughly as productive as the land. Unfortunately, climate change is reducing ocean life and as such, lessening the impact oceans have on the global carbon cycle.Carbon sinks are different ways that carbon dioxide is taken out of the atmosphere. Plants and algae take carbon dioxide out of the atmosphere and the oceans absorb carbon dioxide. These different mechanisms are referred to as carbon sinks. For millennia, the system of carbon sinks around the planet maintained a relative balance in the system.The last few centuries have ushered in a rapid growth in carbon dioxide emissions, largely from coal and subsequent to the coal age, oil and gas have added to the growth. Rapidly growing economic capacity in coal driven energy regions are placing strong and rapid upward pressure on carbon dioxide emissions.
- The coastal waters of the Eastern Pacific are productive because wind and ocean currents allow nutrient-rich water from deep in the ocean to rise to the surface. The cold, rising water carries phosphates and nitrates, which act as fertilizer to the phytoplankton that grow in the sunlit waters at the ocean’s surface. Since phytoplankton are the base of the food chain, areas that support large phytoplankton blooms tend to have large fish populations.Off the coast of Vancouver Island, phytoplankton blooms tend to happen when winds blow down the coast from the north. The winds push the ocean’s surface water west, out to sea. Deep water rises up to replace the wind-blown surface water, and it carries the nutrients needed to support phytoplankton blooms.Charles G. Trick, et al, from the University of Western Ontario investigated everal species of diatoms and the genus Pseudonitzschia. This genus was found to produce domoic acid. Phytoplankton use this acid to fuel growth, but it is also highly toxic to many marine mammals and humans. Large blooms of Pseudonitzschia in coastal waters have implicated the toxin in the poisoning of sea lions via tainted shellfish. Studies suggest that when such phytoplankton blooms occur in mid-ocean waters, they do not produce the toxin. The mid-ocean water finding was disputed by Dr. Trick who said his Pseudonitzschia collected in mid-ocean and subjected to shipboard experiments produced plenty of domoic acid. 'We found there is a lot of toxin out there,' he said. These two viewpoints underscore the intense complexity of global oceanic ecosystems.
- This slide gives you an idea of the amount of CO2 emissions per fuel type and adjusted for an equivalent heating value.
- Contrast emissions data from 4 countries (USA, Italy, Norway, and China) Illustrate how the different countries and their varying economies and access to resources are reflected in their CO2 emissions. The table shows that per capita emissions from the USA are nearly 3 times those of the 2 European countries and 9 times those of China. Part of the differences among countries is seen in row 3 of the table, which reveals that China is the most dependent on coal while Norway derives a large fraction of its total energy supply from non-fossil sources. Row 4 of Table 2 gives insight into the structures and efficiencies of the economies. Countries with larger contributions from the primary and heavy, and hence energy-intensive, industries will have high emissions per unit of GDP while those in which the information and service industries play a larger role will have lower emissions per unit of GDP. Similarly, an economy characterized by low efficiency will have higher emissions per unit of GDP.
- The US, as the second largest producer of CO2 emissions, will likely continue to battle with emissions, especially from coal fired electricity. The US Department of Energy notes that technological advancements have been realized in the last five years, the United States is eager to demonstrate carbon capture and storage technology on commercial plants that when operational, will be the cleanest coal-fired plants in the world.With such a huge part of the US electric power complex being fuelled by coal, and given that the US has the largest coal reserves in the World, it is likely that the US will continue to seek to establish clean coal technologies that, if modeled after existing clean coal plants in the US, may well involve extensive carbon dioxide capture and sequestration technologies.
- China's GDP carbon dioxide emissions will rise with the growth of a middle class and wealth generation created by economic prosperity - China is likely to build a lot of coal fired plants.Other countries, like India, where coal is a primary fuel for energy, will continue to advance economically and increase their GDP carbon dioxide production - and they are equally likely to build more coal driven energy plants in order to accelerate economic growthPer GDP carbon dioxide production in the USA during the last decade has remained fairly constant, this pattern is repeated across most of the developed countries.Recent data indicates the growth in China's CO2 emissions are far outpacing previous estimates, making the goal of stabilizing atmospheric greenhouse gases even more difficult, according to a new analysis by economists at the University of California, Berkeley, and UC San Diego.Previous estimates, including those used by the Intergovernmental Panel on Climate Change (IPCC), say the region that includes China will see a 2.5 to 5 percent annual increase in CO2 emissions, the largest contributor to atmospheric greenhouse gases, between 2004 and 2010. The new UC analysis puts that annual growth rate for China to at least 11 percent for the same time period.
- China emits more CO2 than any other country and it is growing emissions faster than any other country. Recent studies indicate that between 2004 and 2010, China’s emission growth rate will be closer to 11% instead of the forecasted 2.5 to 5% used in various protocols including Kyoto. Conservative forecasts place Chinese CO2 emission growth to be 600 million metric tonnes more than in the year 2000. This 600 million additional tonnes compares to the 116 million metric tons of emission reductions pledged by all the countries that signed the Kyoto Protocol.The United states was the largest single emitter of CO2 until 2006 when China took over as the leading carbon dioxide emitting country. China currently produces over 70% of its energy requirements through coal generated power and over 80% of China's electricity is derived from coal. China now builds the equivalent of two new coal-fired 500 Megawatt power plants every week. China leverages coal due to the abundance of the resource and also because it is far less expensive to use compared to an energy unit derived from gas or petroleumChina has the third largest coal reserves in the World. For China, coal is very cost effective per unit of energy compared to other energy alternatives. China gives priority to economic growth and is unlikely to agree to absolute ceilings. Given the population of China, it is likely they will advocate for per capita emissions.
- OECD dataThe United States had the most emissions until 2006. Analyzed on a per capita basis, both Canada and the United States produce GHG’s at a rate nearly four times that of China on a per capita basis.
- This is an image that conveys carbon dioxide emissions on a per capita basis. The “redder” the colour, the higher the gross emissions per capita.
- This graph gives a view of how it looks with US, BRIC, and a few other countries that have significant emissions.Note that China and the United States drive about half the emissions on a global scale.
- Leveraging carbon dioxide sequestration, the growth in oil-sands carbon emissions can be turned back to the point where the carbon footprint of a barrel of Canadian synthetic crude will be smaller than the carbon footprint of a barrel of Saudi Light.
- Bit of perspective and link to a free carbon footprint calculator
- Perspective