Plotting Straight Lines from Values Tables
•
1 gefällt mir•1,191 views

This presentation shows how to plot a straight line graph from a horizontally aligned table of x and y values. To plot a graph using a values table we follow these steps: Step 1) Write the table out as a set of (x,y) coordinates. Step 2) Rule up an X-Y grid on graph paper. Step 3) Plot the points onto the grid. Step 4) If the points from a pattern, then use a ruler to join the points together. Step 5) Extend the line to fill the grid, and add arrows to both ends. To obtain a PowerPoint format download of this presentation, go to the following page: http://passyworldofmathematics.com/pwerpoints/

Empfohlen
Weitere ähnliche Inhalte
Mehr von Passy World
Mehr von Passy World (20)
Kürzlich hochgeladen
Kürzlich hochgeladen (20)
Plotting Straight Lines from Values Tables
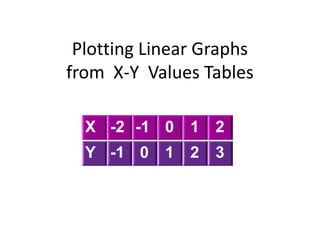
- 1. Plotting Linear Graphs from X-Y Values Tables X -2 -1 0 1 2 Y -1 0 1 2 3
- 2. Plotting Points on the X-Y Grid X -2 -1 0 1 2 5 Y -1 0 1 2 3 The above table represents -3 3 the following (x,y) points: (-2,-1) (-1,0) (0,1) (1,2) (2,3) -5
- 3. Plotting Points on the X-Y Grid X -2 -1 0 1 2 5 Y -1 0 1 2 3 When the above (x,y) points: -3 3 (-2,-1) (-1,0) (0,1) (1,2) (2,3) -5 Are plotted on the X-Y grid, they form a straight line pattern.
- 4. Plotting Points on the X-Y Grid X -2 -1 0 1 2 5 Y -1 0 1 2 3 When the plotted (x,y) points: -3 3 (-2,-1) (-1,0) (0,1) (1,2) (2,3) -5 are connected together, they form a perfect straight line.
- 5. Plotting Points on the X-Y Grid X -2 -1 0 1 2 Y -1 0 1 2 3 5 To finish the graph, the straight line is extended and arrows are added to each end. -3 3 This shows that if we kept adding points to the line, it -5 would extend forever in both directions.