SlideShare ist ein Scribd-Unternehmen logo
1 von 2
Downloaden Sie, um offline zu lesen
Report and analyze—Splunk Storm helps you extract the precise
information you need out of your machine data and generate
reports dynamically and iteratively. A late-binding schema
applies structure at search/query time, allowing you to define
dashboards on the fly and create valuable operational views.
Powerful visualizations help you identify trends, chart and graph
relevant metrics as well as generate heat maps and scatter plots
from your data.
Scale dynamically—Handle spikes in data volumes seamlessly.
A simple slider allows you to adjust the amount of storage
you need in Splunk Storm. No need to purchase hardware or
infrastructure. Just scale up or down easily by simply moving a
slider.
Collaborate and share information—Share your Splunk Storm
projects with other developers/operations/DevOps professionals
in your organization to generate cross-functional views of your
data.
Customer Successes with Splunk Storm
Extract analytics from cloud apps
Newstex, an authoritative content aggregation and distribution
service, runs in Amazon Web Services and only uses cloud
services for their infrastructure. Newstex uses Splunk Storm
to get insights into application errors as well as to report on
content usage like charting the path of content files across the
entire distribution network.
“I love Splunk Storm’s ability to precisely extract
information from my logs to generate content
usage analytics and tracking for Newstex.”
—Chris Moyer, VP Technology, Newstex LLC and
author of “Building Applications in the Cloud”
Developers Need Visibility
Whether you’re developing new mobile, social, gaming or
e-commerce applications, cloud services such as Amazon® Web
Services, Heroku®, Rackspace®, Google® App Engine provide a
fast route to market. However, running applications in the cloud
comes with a potential loss of visibility and control. While logs
and metrics can provide some insight into how your application
is doing, this data is often in different formats making it difficult
to gain full visibility into your operations.
Splunk Storm Advantages
Splunk Storm takes the machine data from your cloud services
and applications (logs, events, metrics, and more) and harnesses
that data to generate critical operational insights and application
intelligence. Splunk Storm is a cloud service, based on the tried
and proven, powerful Splunk software, used by thousands of
enterprise customers worldwide.
•	Diagnose and troubleshoot application problems and
investigate security incidents in minutes instead of hours
or days
•	Gain rapid visibility and insights into your cloud-based
applications such as user experience, user behavior,
monetization triggers, response times and more
•	Monitor critical operational metrics such as system
uptimes, usage metrics, response times and error rates
for more effective operational management of your cloud
applications
Splunk Storm Capabilities
Analyze machine data from almost any source—Splunk Storm
indexes and stores machine data in real time from virtually
any source, format, platform, or cloud provider without the
need for custom parsers or connectors. Machine data includes
application logs, syslog streams from applications, network
devices or load-balancers, metrics from your virtual machine
instances, web server logs or database logs, infrastructure/
platform/application service provider logs, stack traces, event
data and more. Whether your application is written in Ruby,
Java, Python, PHP, .NET, Node.js or any other language or
framework, send data to Splunk Storm using network streams
such as syslog, or using Splunk forwarders. Use the universal
forwarder to gather data from a variety of inputs and forward
the data to Splunk Storm for indexing and searching.
Search, investigate, correlate—Splunk Storm supports the
powerful Splunk search language which lets you search real-
time and historical machine data, filter events, correlate
information across various data types, link transactions across
multiple application components and trend critical operational
parameters. Powerful statistical and reporting commands let you
detect anomalies, eliminate noise and update transaction counts
and durations.
Analyze and Troubleshoot Your Cloud–based Applications
Splunk Storm®
F A C T S H E E T
	
  Analyze and report dynamically and iteratively.
	
  
www.splunk.com
250 Brannan St, San Francisco, CA, 94107 info@splunk.com | sales@splunk.com 866-438-7758 | 415-848-8400 www.splunkbase.com
Copyright © 2012 Splunk Inc. All rights reserved. Splunk Enterprise is protected by U.S. and international copyright and intellectual property laws.
Splunk is a registered trademark or trademark of Splunk Inc. in the United States and/or other jurisdictions. All other marks and names mentioned
herein may be trademarks of their respective companies. Item #FS-Splunk-Storm-105
F A C T S H E E T
www.splunk.com
250 Brannan St, San Francisco, CA, 94107 info@splunk.com | sales@splunk.com 866-438-7758 | 415-848-8400 www.splunkbase.com
Sign Up Now, it’s Free!
Go to www.splunkstorm.com and sign up.
Gain operational insights
SendHub enables businesses, educators, healthcare workers and
other users to easily communicate with individuals and groups of
any size through SMS, voice calls and voicemail. SendHub relies
on Splunk Storm to provide insight into how issues across their
infrastructure impact customers.
“Splunk Storm is clearly one of the most powerful
application analysis tools on the market. It’s
reduced application diagnosis from half a day
to 15 minutes and lets us achieve an even faster
implementation. We know exactly which points are
failing and what parts we need to optimize.”
—Ryan Pfeffer, Co-founder, SendHub
Liverpoolfc.com, the official website of Liverpool Football Club,
experiences massive traffic peaks during matches, promotions
and breaking news. Effectively monitoring the infrastructure
during such spikes is critical to the success of the website, so
the Club is using Splunk Storm to gain visibility into a wide
range of operational metrics. They are looking metrics such as
how many web requests are handled per second or measuring
load balancer output. Splunk Storm also reports on purchases
handled by the website, in real time.
““We use Splunk Storm for operational analytics.
It provides us views on everything from how many
requests are handled per second to how many
purchases are happening per minute and how well
our infrastructure is handling peak traffic volumes.”
—David Channon, Application Development Analyst,
Liverpool Football Club
Rapid issue resolution
ClientMagnet, a new marketing automation service focused
on small businesses, runs on Heroku. While Heroku is great
for flexible scalability, it provides limited visibility into the
infrastructure.
Investigating application errors was a daunting task for Jeff,
founder and CEO of ClientMagnet until he got the logs into
Splunk Storm. Now Jeff relies on Splunk Storm to analyze
complex Heroku logs and find trouble spots in his application.
How to Get It
Splunk Storm is an online service. Simply sign up today at :
www.splunkstorm.com
Splunk Storm offers monthly plans with no commitments or
contracts. Simply pick the plan you need, based on the total
amount of data you need to analyze. Change plans at any time to
accommodate peaks and valleys in your data traffic.
If you need the capabilities of Splunk software, but running on-
premises, download our free solution:
www.splunk.com/download


Weitere ähnliche Inhalte

Mehr von Greg Hanchin

Administering splunk 43 course
Administering splunk 43 courseAdministering splunk 43 course
Administering splunk 43 courseGreg Hanchin
 
Using splunk43course
Using splunk43courseUsing splunk43course
Using splunk43courseGreg Hanchin
 
Using Splunk course outline
Using Splunk course outline Using Splunk course outline
Using Splunk course outline Greg Hanchin
 
Advanced Splunk Administration
Advanced Splunk AdministrationAdvanced Splunk Administration
Advanced Splunk AdministrationGreg Hanchin
 
Splunk Advanced searching and reporting Class description
Splunk Advanced searching and reporting Class descriptionSplunk Advanced searching and reporting Class description
Splunk Advanced searching and reporting Class descriptionGreg Hanchin
 
Administering Splunk course
Administering Splunk courseAdministering Splunk course
Administering Splunk courseGreg Hanchin
 
Splunk Searching and Reporting Class Details
Splunk Searching and Reporting Class DetailsSplunk Searching and Reporting Class Details
Splunk Searching and Reporting Class DetailsGreg Hanchin
 
Splunk FISMA for Continuous Monitoring
Splunk FISMA for Continuous Monitoring Splunk FISMA for Continuous Monitoring
Splunk FISMA for Continuous Monitoring Greg Hanchin
 
Splunk forwarders tech_brief
Splunk forwarders tech_briefSplunk forwarders tech_brief
Splunk forwarders tech_briefGreg Hanchin
 
Splunk and map_reduce
Splunk and map_reduceSplunk and map_reduce
Splunk and map_reduceGreg Hanchin
 
Splunk for xen_desktop
Splunk for xen_desktopSplunk for xen_desktop
Splunk for xen_desktopGreg Hanchin
 
Splunk for palo_alto
Splunk for palo_altoSplunk for palo_alto
Splunk for palo_altoGreg Hanchin
 
Splunk for db_connect
Splunk for db_connectSplunk for db_connect
Splunk for db_connectGreg Hanchin
 
Splunk for active_directory
Splunk for active_directorySplunk for active_directory
Splunk for active_directoryGreg Hanchin
 
Splunk app for_windows
Splunk app for_windowsSplunk app for_windows
Splunk app for_windowsGreg Hanchin
 
Splunk app for_enterprise_security
Splunk app for_enterprise_securitySplunk app for_enterprise_security
Splunk app for_enterprise_securityGreg Hanchin
 
Splunk guide for_iso_27002
Splunk guide for_iso_27002Splunk guide for_iso_27002
Splunk guide for_iso_27002Greg Hanchin
 

Mehr von Greg Hanchin (20)

Administering splunk 43 course
Administering splunk 43 courseAdministering splunk 43 course
Administering splunk 43 course
 
Using splunk43course
Using splunk43courseUsing splunk43course
Using splunk43course
 
Using Splunk course outline
Using Splunk course outline Using Splunk course outline
Using Splunk course outline
 
Advanced Splunk Administration
Advanced Splunk AdministrationAdvanced Splunk Administration
Advanced Splunk Administration
 
Splunk Advanced searching and reporting Class description
Splunk Advanced searching and reporting Class descriptionSplunk Advanced searching and reporting Class description
Splunk Advanced searching and reporting Class description
 
Administering Splunk course
Administering Splunk courseAdministering Splunk course
Administering Splunk course
 
Splunk Searching and Reporting Class Details
Splunk Searching and Reporting Class DetailsSplunk Searching and Reporting Class Details
Splunk Searching and Reporting Class Details
 
Splunk FISMA for Continuous Monitoring
Splunk FISMA for Continuous Monitoring Splunk FISMA for Continuous Monitoring
Splunk FISMA for Continuous Monitoring
 
Splunk forwarders tech_brief
Splunk forwarders tech_briefSplunk forwarders tech_brief
Splunk forwarders tech_brief
 
Splunk and map_reduce
Splunk and map_reduceSplunk and map_reduce
Splunk and map_reduce
 
Splunk for xen_desktop
Splunk for xen_desktopSplunk for xen_desktop
Splunk for xen_desktop
 
Splunk for palo_alto
Splunk for palo_altoSplunk for palo_alto
Splunk for palo_alto
 
Splunk for ibtrm
Splunk for ibtrmSplunk for ibtrm
Splunk for ibtrm
 
Splunk for fisma
Splunk for fismaSplunk for fisma
Splunk for fisma
 
Splunk for f5
Splunk for f5Splunk for f5
Splunk for f5
 
Splunk for db_connect
Splunk for db_connectSplunk for db_connect
Splunk for db_connect
 
Splunk for active_directory
Splunk for active_directorySplunk for active_directory
Splunk for active_directory
 
Splunk app for_windows
Splunk app for_windowsSplunk app for_windows
Splunk app for_windows
 
Splunk app for_enterprise_security
Splunk app for_enterprise_securitySplunk app for_enterprise_security
Splunk app for_enterprise_security
 
Splunk guide for_iso_27002
Splunk guide for_iso_27002Splunk guide for_iso_27002
Splunk guide for_iso_27002
 

Storm product fact_sheet

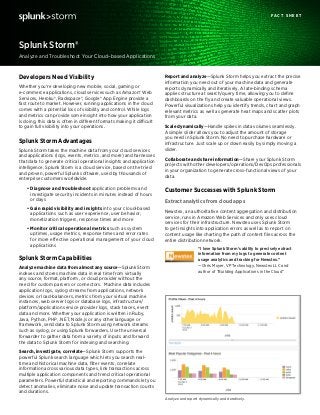
  • 1. Report and analyze—Splunk Storm helps you extract the precise information you need out of your machine data and generate reports dynamically and iteratively. A late-binding schema applies structure at search/query time, allowing you to define dashboards on the fly and create valuable operational views. Powerful visualizations help you identify trends, chart and graph relevant metrics as well as generate heat maps and scatter plots from your data. Scale dynamically—Handle spikes in data volumes seamlessly. A simple slider allows you to adjust the amount of storage you need in Splunk Storm. No need to purchase hardware or infrastructure. Just scale up or down easily by simply moving a slider. Collaborate and share information—Share your Splunk Storm projects with other developers/operations/DevOps professionals in your organization to generate cross-functional views of your data. Customer Successes with Splunk Storm Extract analytics from cloud apps Newstex, an authoritative content aggregation and distribution service, runs in Amazon Web Services and only uses cloud services for their infrastructure. Newstex uses Splunk Storm to get insights into application errors as well as to report on content usage like charting the path of content files across the entire distribution network. “I love Splunk Storm’s ability to precisely extract information from my logs to generate content usage analytics and tracking for Newstex.” —Chris Moyer, VP Technology, Newstex LLC and author of “Building Applications in the Cloud” Developers Need Visibility Whether you’re developing new mobile, social, gaming or e-commerce applications, cloud services such as Amazon® Web Services, Heroku®, Rackspace®, Google® App Engine provide a fast route to market. However, running applications in the cloud comes with a potential loss of visibility and control. While logs and metrics can provide some insight into how your application is doing, this data is often in different formats making it difficult to gain full visibility into your operations. Splunk Storm Advantages Splunk Storm takes the machine data from your cloud services and applications (logs, events, metrics, and more) and harnesses that data to generate critical operational insights and application intelligence. Splunk Storm is a cloud service, based on the tried and proven, powerful Splunk software, used by thousands of enterprise customers worldwide. • Diagnose and troubleshoot application problems and investigate security incidents in minutes instead of hours or days • Gain rapid visibility and insights into your cloud-based applications such as user experience, user behavior, monetization triggers, response times and more • Monitor critical operational metrics such as system uptimes, usage metrics, response times and error rates for more effective operational management of your cloud applications Splunk Storm Capabilities Analyze machine data from almost any source—Splunk Storm indexes and stores machine data in real time from virtually any source, format, platform, or cloud provider without the need for custom parsers or connectors. Machine data includes application logs, syslog streams from applications, network devices or load-balancers, metrics from your virtual machine instances, web server logs or database logs, infrastructure/ platform/application service provider logs, stack traces, event data and more. Whether your application is written in Ruby, Java, Python, PHP, .NET, Node.js or any other language or framework, send data to Splunk Storm using network streams such as syslog, or using Splunk forwarders. Use the universal forwarder to gather data from a variety of inputs and forward the data to Splunk Storm for indexing and searching. Search, investigate, correlate—Splunk Storm supports the powerful Splunk search language which lets you search real- time and historical machine data, filter events, correlate information across various data types, link transactions across multiple application components and trend critical operational parameters. Powerful statistical and reporting commands let you detect anomalies, eliminate noise and update transaction counts and durations. Analyze and Troubleshoot Your Cloud–based Applications Splunk Storm® F A C T S H E E T  Analyze and report dynamically and iteratively.  
  • 2. www.splunk.com 250 Brannan St, San Francisco, CA, 94107 info@splunk.com | sales@splunk.com 866-438-7758 | 415-848-8400 www.splunkbase.com Copyright © 2012 Splunk Inc. All rights reserved. Splunk Enterprise is protected by U.S. and international copyright and intellectual property laws. Splunk is a registered trademark or trademark of Splunk Inc. in the United States and/or other jurisdictions. All other marks and names mentioned herein may be trademarks of their respective companies. Item #FS-Splunk-Storm-105 F A C T S H E E T www.splunk.com 250 Brannan St, San Francisco, CA, 94107 info@splunk.com | sales@splunk.com 866-438-7758 | 415-848-8400 www.splunkbase.com Sign Up Now, it’s Free! Go to www.splunkstorm.com and sign up. Gain operational insights SendHub enables businesses, educators, healthcare workers and other users to easily communicate with individuals and groups of any size through SMS, voice calls and voicemail. SendHub relies on Splunk Storm to provide insight into how issues across their infrastructure impact customers. “Splunk Storm is clearly one of the most powerful application analysis tools on the market. It’s reduced application diagnosis from half a day to 15 minutes and lets us achieve an even faster implementation. We know exactly which points are failing and what parts we need to optimize.” —Ryan Pfeffer, Co-founder, SendHub Liverpoolfc.com, the official website of Liverpool Football Club, experiences massive traffic peaks during matches, promotions and breaking news. Effectively monitoring the infrastructure during such spikes is critical to the success of the website, so the Club is using Splunk Storm to gain visibility into a wide range of operational metrics. They are looking metrics such as how many web requests are handled per second or measuring load balancer output. Splunk Storm also reports on purchases handled by the website, in real time. ““We use Splunk Storm for operational analytics. It provides us views on everything from how many requests are handled per second to how many purchases are happening per minute and how well our infrastructure is handling peak traffic volumes.” —David Channon, Application Development Analyst, Liverpool Football Club Rapid issue resolution ClientMagnet, a new marketing automation service focused on small businesses, runs on Heroku. While Heroku is great for flexible scalability, it provides limited visibility into the infrastructure. Investigating application errors was a daunting task for Jeff, founder and CEO of ClientMagnet until he got the logs into Splunk Storm. Now Jeff relies on Splunk Storm to analyze complex Heroku logs and find trouble spots in his application. How to Get It Splunk Storm is an online service. Simply sign up today at : www.splunkstorm.com Splunk Storm offers monthly plans with no commitments or contracts. Simply pick the plan you need, based on the total amount of data you need to analyze. Change plans at any time to accommodate peaks and valleys in your data traffic. If you need the capabilities of Splunk software, but running on- premises, download our free solution: www.splunk.com/download