SlideShare a Scribd company logo
1 of 8
Download to read offline
EMsSolar Installation – A new trend in US Utilities
January 2015
© Aranca 2015. All rights reserved. | info@aranca.com | www.aranca.com
Aranca is an ISO 27001:2013 certified company
P a g e | 1
Solar Photovoltaic installations driving capacity additions in the US
The total power generation capacity installations every year in the US has expanded significantly, led majorly by solar energy sources.
Specifically, solar Photovoltaic (PV) installation has been gaining pace since 2007, contributing ~53% to total capacity additions in the
US in 1H 2014. Within PV, Distributed Generation (DG) capacity increased at a CAGR of over 55% since 2007. A favorable
environment, with declining costs of solar rooftop installation and energy production as well as beneficial regulations including Net
Metering and the SunShot initiative, has further driven this growth. These factors have cumulatively led to growth in solar capacity
installations, both DG and the traditional centralized model of operating solar farms and supplying through the grid. PV installation
capacity is expected to expand at a four-year CAGR of around 48% over 2013-16. However, certain regulatory and legislative
challenges may impede the growth in DG capacity.
Government support and lower costs boost solar electricity installations in the US
Solar energy capacity addition growing at high rate
Solar energy – propelling growth of overall electricity generation capacity in the US
Solar electricity generation has been witnessing high growth rate in the US, driven by an increase in affordability and accessibility.
Installed Solar Photovoltaic (PV) capacity in the US rose to over 14,500 megawatts (MW) in 1H14 from just ~140MW in 2004. This
growth has been contributed equally by Distributed Generation (DG) companies (added ~7,100MW to capacity over the period) and
utility companies (added ~7,300MW to capacity). Overall, there has been an uptrend in the contribution of solar electricity generation
compared with other sources since 2012.
Solar energy driving US electricity generation capacity additions
Source: Greentech Media Research, Solar Energy Industries Association, Aranca Research
10%
29%
53%31%
46%
30%
16%
10% 0%
41%
7% 14%
2% 8% 3%
0%
20%
40%
60%
80%
100%
2012 2013 1H 14
Solar Natural Gas Coal Wind Other
Total Additions 33.7 GW 16.4 GW 4.7 GW
EMsSolar Installation – A new trend in US Utilities
January 2015
© Aranca 2015. All rights reserved. | info@aranca.com | www.aranca.com
Aranca is an ISO 27001:2013 certified company
P a g e | 2
Growth in PV capacity installation resulting in 10-yr CAGR of over 65%
Decline in solar energy system installation costs and an increase in retail utility electricity prices have made distributed generation of
solar energy a viable option for the middle class. As per Lawrence Berkeley National Laboratory, the cost of a DG solar energy systems
has been declining at a CAGR of about 10–11% ($4.7—3.9 per watt over varying capacity ranges) over 2007-2013 due to an increase
in global production of solar panels (creating economies of scale), government incentives and declining raw material costs. On the other
hand, according to EIA, retail utility electricity prices in the US expanded at a CAGR of 3.2% over 2004–13. Installations of DG solar
energy systems have grown at an annual rate of 56% over 2003–13 (Source: Solar Energy Industries Association).
Separately, the government’s SunShot Initiative aimed at reducing the cost of solar-powered electricity generation across the US, along
with increasing competitive threat from DG, has resulted in utilities adding large, centralized PV systems to their existing generation
portfolios. Overall, PV installation capacity of utilities increased at a CAGR of 93% over 2003–13.
On a cumulative basis, total PV installations have improved by over 65% CAGR over the 10-year period between 2003-2013. This
growth has been better than the world average of ~49% CAGR, while in-line with the growth in Europe (~63% CAGR) and less than
that of China (~80% CAGR)
Total PV installations grew 59.4% Y-o-Y (2,478 MW) in 1H14 (36% Y-o-Y for 2Q14), mainly driven by the Utility PV market, which
accounted for 60% of the capacity installed in 1H14 (55% for 2Q14). Utility PV installation surged 94.5% in 1H14 (38%), while DG
installations grew 24.8% (34%).
PV installations are expected to remain the largest additions to energy generation capacity, driven by traditional utilities and DG
companies. According to GTM research, PV installation capacity is expected to increase at a CAGR of around 48% (approximately
9,000MW addition per annum) to around 40,000GW over 2013–16.
Solar PV capacity installations growing at high rate
Source: Greentech Media Research, Solar Energy Industries Association, Aranca Research
Competitive pricing and cost efficiencies driving the DG business model
DG solar utility companies such as SolarCity Corp and Vivint Solar Inc provide electricity through solar energy systems installed at
customers’ rooftops, as against the traditional model of supplying electricity through the grid from solar farms (traditional utility model).
Customers sign long-term contracts for solar electricity wherein they can pay DG companies recurring monthly payments for the PV
energy systems, thus avoiding an upfront installation cost. Alternatively, customers may also purchase the systems on loan basis.
Furthermore, customers also benefit from lower monthly bills owing to a phenomenon called Net Metering which reduces tariff by
providing credit to the customers for unused electricity generated.
0
9,000
18,000
27,000
36,000
45,000
2007 2008 2009 2010 2011 2012 2013 2014E 2015E 2016E
InstalledCapacity(MW)
DG PV Utility PV
55% CAGR over 2013-2016
41% CAGR over 2013-2016
EMsSolar Installation – A new trend in US Utilities
January 2015
© Aranca 2015. All rights reserved. | info@aranca.com | www.aranca.com
Aranca is an ISO 27001:2013 certified company
P a g e | 3
Hence, with low upfront installation payments and running costs, the DG solar energy model helps customers save 15–30% in utility
bills over traditional electricity sources. In addition, the business model does not require grids to transmit power to customers, thereby
eliminating grid (transmission & distributions) losses of at least 6–7% percent, which would have been passed on to the customer in
case of traditional utilities.
In recent times, DG utilities have also started offering battery storage systems that provide power backup in case the utility grid goes
down. The size of a battery unit is similar to that of a solar power inverter, and can be mounted on the wall or near an electrical panel.
DG Utilities also benefit from this business model in the form of long-term contracts (typically for about 20 years) providing revenue
visibility and stable recurring cash flows. In addition, the federal government offers a 30% Investment Tax Credit (ITC) to such
companies under Section 48(a) of the Internal Revenue Code for installation of solar power facilities. However, this tax credit would
reduce to 10% from January 1, 2017.
Decline in generation cost and threat from DG pushing utility companies toward PV installations
The Utility PV segment has emerged from a greenhorn in the solar market to fastest growing sector in the industry. Utilities build large,
centralized PV systems that feed power directly to the grid.
Utilities providing electricity to the US have started considering residential solar systems as a threat. According to a study by Lawrence
Berkeley National Laboratory, if rooftop solar gains 10% of the market share in the next decade, utility earnings could decline by about
41%.
Utilities have also started considering solar energy as a means to reduce costs. Government initiatives have helped lower solar power
generation cost from $0.21 per kilowatt-hour in 2010 to $0.11 per kilowatt-hour in 2013. The falling price of utility PV projects since
SunShot’s inception has driven major expansions in the segment, with utilities quadrupling their capacities to 7,308MW since 1H2012.
Increasing Average Retail Electricity Prices Utility PV – Installed Capacity quadrupled since 1H 12
Source: EIA – Electric Power Monthly October 2014, Aranca Research Source: Greentech Media Research, Solar Energy Industries Association, Aranca
Research
6.5
7.0
7.5
8.0
8.5
9.0
9.5
10.0
10.5
11.0
2004
2005
2006
2007
2008
2009
2010
2011
2012
2013
c/kwh
0
2,000
4,000
6,000
8,000
Residential Non Residential Utility
InstalledCapacity(MW)
1H 12 1H 14
EMsSolar Installation – A new trend in US Utilities
January 2015
© Aranca 2015. All rights reserved. | info@aranca.com | www.aranca.com
Aranca is an ISO 27001:2013 certified company
P a g e | 4
Regulations and Policies: All you need to know
SunShot Initiative to help lower cost of utility PV generation
In 2011, the Energy Department of the US launched the SunShot Initiative to reduce solar energy cost and make it cost competitive
compared with other traditional energy sources in the US. Through affiliations with the industry, universities, local communities and the
Department’s national laboratories, the initiative is aimed at reducing the cost of solar energy from about $0.21 per kilowatt-hour in
2010 to $0.06 per kilowatt-hour by 2020. The initiative has been successful in reducing the solar energy cost to $0.11 per kilowatt-hour
at the end of 2013 which is below the average US electricity price of about $0.12 per kilowatt-hour (Source: Energy Information
Administration).
Decline in cost of Utility PV Projects
Source: National Renewable Energy Lab, Aranca Research
Net Metering continues to be accepted by most states
Net Metering, also called Net Energy Metering (NEM), allows residential and commercial customers who generate their own electricity
from solar systems to feed excess electricity back into the grid and earn credits in return.
NEM is a billing mechanism that allows solar energy systems that generate more electricity than required to feed it back into the grid.
Since the output from a PV system may not exactly match the on-site demand for electricity, a home or business with a PV system
could export the excess power to the electric grid and import power from the grid when required.
For example, if a residential customer has a PV installation on his/her rooftop and it produces excess electricity than what is needed
during daytime, it may return the excess units back to the grid; during this time, the electric meter runs backward, providing credit to the
customer. The customer can use these credits in times of shortage in electricity production or when the home’s electricity use exceeds
the system’s capacity. Customers are only billed for their “net” energy consumption.
Currently, 43 states and Washington D.C. have passed Net Metering laws. In other states, utilities may offer net metering programs
voluntarily or as a result of regulatory decisions.
0
6
12
18
24
2010 2011 2012 2013
CostofElectricity(c/kwh)
Module Inverter Other Hardware Soft Costs
2020 Target
EMsSolar Installation – A new trend in US Utilities
January 2015
© Aranca 2015. All rights reserved. | info@aranca.com | www.aranca.com
Aranca is an ISO 27001:2013 certified company
P a g e | 5
Net Metering Policies’ effectiveness varies among states
Source: www.freeingthegrid.org
Grades in the above map represent various levels of effectiveness of the Net Metering Policies in each state depending on the fee,
additional charges, and other obstacles in installation of the Net Metering Systems, with “A” being the most effective and “E” the least.
States with grade equivalent to “N/A” do not have any statewide net metering policy.
Some utilities perceive this net metering as lost revenue opportunities. On the other hand, proponents of this methodology claim that
net metering policies create a smoother demand curve for electricity and allow utilities to better manage their peak electricity loads,
thereby increasing reliability of the system.
Property-assessed Clean Energy (PACE) program supporting DG installations
Property-assessed Clean Energy (PACE) program is aimed at helping homes and business owners finance energy efficiency and
renewable energy projects for their properties. It is a voluntary program under which a home or business owner is entitled to receive
financing from the local government to cover the up-front cost for qualified energy improvements. Owners have to repay the amount in
the form of special assessment on their property tax over a period of years or decades. This financing is secured with a lien on the
property, i.e., in case of a foreclosure, financing must be repaid before other claims against the property.
Energy efficiency improvements covered include insulation, weather sealing and high-efficiency water heaters as well as solar and
other on-site renewable energy systems.
EMsSolar Installation – A new trend in US Utilities
January 2015
© Aranca 2015. All rights reserved. | info@aranca.com | www.aranca.com
Aranca is an ISO 27001:2013 certified company
P a g e | 6
Some best practices favoring DG
Interconnection Standards need to be pro-DG
These are the rules for connecting solar and other electrical systems to the grid and apply to both electricity customers and
utilities:
State Interconnection Standards: States have jurisdiction over interconnection of customer-owned solar generation to the
distribution grid, including projects that are net metered.
Federal Interconnection Standards: The Federal Government holds jurisdiction over the interconnection of distributed generation
solar projects involving sale of electricity to a utility through the Federal Energy Regulatory Commission (FERC).
The FERC issued standards in 2005 facilitating interconnection procedures for small generators that generate 20 megawatts (MW)
or less.
15-percent rule/screen: Under the rules governing solar generators interconnections, solar projects under 2 MW may enter into a
“fast-track” process of interconnection as long as the total distributed generation is less than 15% of the circuit peak load.
Stringent local solar permitting procedures to affect DG adversely
In order to install a solar system on a property, the property owner needs to obtain the requisite permissions.
Legislations under consideration:
According to a report released by SunRun, a streamlined and cost-effective process for permitting solar system installations could
reduce the costs for residential systems equivalent to $1 billion in 5 years.
Legislation S. 1108 (10 Million Solar Roofs Act of 2011) would provide local communities with a grant and the methods to make
solar permitting more feasible.
Solar Access Rights to protect property-owners' rights to unobstructed sunlight
Local ordinances and Homeowner’s Association (HOA) rules may affect the installation of solar energy systems in homes and
businesses. In lieu of outright prohibition, some rules allow third parties to require that solar customers make modifications to their
system design; this could unreasonably increase costs, decrease efficiency, or both.
Lawmakers are trying to protect property-owners’ solar access rights.
 Solar Easements: allow a property owner to negotiate for the rights to unobstructed sunlight on their property
 Solar Access Laws: provide more protection to solar customers by prohibiting or limiting private restrictions on solar
energy installations
Legislations under consideration:
The Solar Opportunity & Local Access Rights (SOLAR) Act establishes the right of every American citizen to:
 operate a solar energy system on their property;
 restrict excessive local solar permitting fees; and
 establishes national net metering and interconnection standards, solar access rights, and 30-year government power
contracting authority.
EMsSolar Installation – A new trend in US Utilities
January 2015
© Aranca 2015. All rights reserved. | info@aranca.com | www.aranca.com
Aranca is an ISO 27001:2013 certified company
P a g e | 7
Solar electricity generation – a long way to go...
Constitutes just a small proportion of the US electricity generation capacity
Considering the prevalence of natural gas and coal as major sources of fuel in the US (constituting about 68% of the country’s total
generation capacity), solar at 1% accounts for a very small portion of this huge generation base. Therefore, the impact of growth in
solar has not been as phenomenal in terms of generation as one would have expected. Nevertheless, the trend is positive and solar as
a base fuel can be considered a viable option with more government support programs (like the SunShot initiative) that promote
distributed generation.
Solar electricity – accounting for small % of overall generation capacity
Source: EIA – Electric Power Monthly October 2014, Greentech Media Research, Solar Energy Industries Association, Aranca Research
Reduced electricity usage from grid to adversely impact prices due to fixed grid maintenance charges
Electricity demand from utilities has declined following the increase in DG’s reach. However, utilities would still be required to incur fixed
costs associated with maintaining grids, as customers with installed solar rooftops would still be connected to the grid. This would result
in higher electricity rates for existing utility customers; this would encourage more people to install solar rooftop panels for cheaper
electricity.
Traditional utilities trying to limit solar rooftop installation growth, sighting DG companies as threat
Consumers with rooftop solar installations have already reduced their electricity usage from the traditional grid. Not only is the solar
rooftop energy model cost efficient but also the net metering system provides end users with electricity credit for the excess energy
generated and exported to the grid. Traditional utilities are protesting against the net metering laws and battery backups wired to solar
panels, stating that the power flowing back to the grid may not be “clean energy”. The net metering policy requires utilities to purchase
electricity from consumers with solar installations (obligatory by state legislation or voluntarily by some utilities) at the price that
customers pay for the grid. This results in loss of revenues for utilities. Furthermore, utilities are demanding a maintenance or
connection charge from rooftop solar owners. Alternatively, utilities in a few states have proposed lower prices to be paid for exported
excess solar electricity.
The Arizona Public Service Company (an electric utility engaged in retail and wholesale electric distribution in the State of Arizona), for
instance, demanded a $50 per month charge from its rooftop solar owners. The regulator approved a charge of $5 for the same.
Currently, there are pending proposals to scale back net metering laws in 20 states. While new regulatory laws are expected to be
issued at some point in future, how much would those favor solar rooftop installations or hamper their growth is anybody’s guess.
Research Note by: Kartik Sabharwal and Jay Thakker
Natural Gas
40%
Coal
28%
Other renewable
Sources
15%
Nuclear
9%
Petroleum Liquids
4%
Solar energy
1%
Other Sources
3%
EMsSolar Installation – A new trend in US Utilities
January 2015
© Aranca 2015. All rights reserved. | info@aranca.com | www.aranca.com
Aranca is an ISO 27001:2013 certified company
P a g e | 8
ARANCA DISCLAIMER
This report is published by Aranca, Inc. Aranca is a customized research and analytics services provider to global clients.
The information contained in this document is confidential and is solely for use of those persons to whom it is addressed and may not
be reproduced, further distributed to any other person or published, in whole or in part, for any purpose.
This document is based on data sources that are publicly available and are thought to be reliable. Aranca may not have verified all of
this information with third parties. Neither Aranca nor its advisors, directors or employees can guarantee the accuracy, reasonableness
or completeness of the information received from any sources consulted for this publication, and neither Aranca nor its advisors,
directors or employees accepts any liability whatsoever (in negligence or otherwise) for any loss howsoever arising from any use of this
document or its contents or otherwise arising in connection with this document.
Further, this document is not an offer to buy or sell any security, commodity or currency. This document does not provide individually
tailored investment advice. It has been prepared without regard to the individual financial circumstances and objectives of persons who
receive it. The appropriateness of a particular investment or currency will depend on an investor’s individual circumstances and
objectives. The investments referred to in this document may not be suitable for all investors. This document is not to be relied upon
and should not be used in substitution for the exercise of independent judgment.
This document may contain certain statements, estimates, and projections with respect to the anticipated future performance of
securities, commodities or currencies suggested. Such statements, estimates, and projections are based on information that we
consider reliable and may reflect various assumptions made concerning anticipated economic developments, which have not been
independently verified and may or may not prove correct. No representation or warranty is made as to the accuracy of such statements,
estimates, and projections or as to its fitness for the purpose intended and it should not be relied upon as such. Opinions expressed are
our current opinions as of the date appearing on this material only and may change without notice.
© 2015, Aranca. All rights reserved.

More Related Content

What's hot

Lobel corporate presentation
Lobel corporate presentationLobel corporate presentation
Lobel corporate presentation
L'Obel Solar Power System
 
Integrating wind and solar energy in India for a Smart Grid platform
Integrating wind and solar energy in India for a Smart Grid platformIntegrating wind and solar energy in India for a Smart Grid platform
Integrating wind and solar energy in India for a Smart Grid platform
Farhan Beg
 

What's hot (20)

Solar Power Technology in India by S Kumar
Solar Power Technology in India by S Kumar Solar Power Technology in India by S Kumar
Solar Power Technology in India by S Kumar
 
Indiasolaropportunity
Indiasolaropportunity Indiasolaropportunity
Indiasolaropportunity
 
EERE’s FY2017 Renewable Power Budget Webinar
EERE’s FY2017 Renewable Power Budget WebinarEERE’s FY2017 Renewable Power Budget Webinar
EERE’s FY2017 Renewable Power Budget Webinar
 
National Solar Mission Status (July'17)
National Solar Mission Status (July'17)National Solar Mission Status (July'17)
National Solar Mission Status (July'17)
 
Solar for-students
Solar for-studentsSolar for-students
Solar for-students
 
Global Solar PV Market Outlook for 2017
Global Solar PV Market Outlook for 2017Global Solar PV Market Outlook for 2017
Global Solar PV Market Outlook for 2017
 
Overview of solar power generation in india
Overview of solar power generation in indiaOverview of solar power generation in india
Overview of solar power generation in india
 
Indian Solar Rooftop PV - A Bright Investment (21.08.18)
Indian Solar Rooftop PV - A Bright Investment (21.08.18)Indian Solar Rooftop PV - A Bright Investment (21.08.18)
Indian Solar Rooftop PV - A Bright Investment (21.08.18)
 
Photovoltaic market and industry trends 2020 IEA PVPS
Photovoltaic market and industry trends 2020 IEA PVPSPhotovoltaic market and industry trends 2020 IEA PVPS
Photovoltaic market and industry trends 2020 IEA PVPS
 
How China become Solar PV manufacturing hub ?
How China become Solar PV manufacturing hub ?How China become Solar PV manufacturing hub ?
How China become Solar PV manufacturing hub ?
 
Solar note icra-2014
Solar note icra-2014Solar note icra-2014
Solar note icra-2014
 
Sustainable energy in India and future trends
Sustainable energy in India and future trendsSustainable energy in India and future trends
Sustainable energy in India and future trends
 
Past and future trends in PV Industry developments
Past and future trends in PV Industry developmentsPast and future trends in PV Industry developments
Past and future trends in PV Industry developments
 
Lobel corporate presentation
Lobel corporate presentationLobel corporate presentation
Lobel corporate presentation
 
JNNSM Solar Power in India
JNNSM Solar Power in IndiaJNNSM Solar Power in India
JNNSM Solar Power in India
 
Solar power in India - A financial analysis
Solar power in India - A financial analysisSolar power in India - A financial analysis
Solar power in India - A financial analysis
 
Integrating wind and solar energy in India for a Smart Grid platform
Integrating wind and solar energy in India for a Smart Grid platformIntegrating wind and solar energy in India for a Smart Grid platform
Integrating wind and solar energy in India for a Smart Grid platform
 
Module Price Trend Analysis
Module Price Trend AnalysisModule Price Trend Analysis
Module Price Trend Analysis
 
States Policies and SERCs Regulatory/ Tariff Order for rooftop solar power pr...
States Policies and SERCs Regulatory/ Tariff Order for rooftop solar power pr...States Policies and SERCs Regulatory/ Tariff Order for rooftop solar power pr...
States Policies and SERCs Regulatory/ Tariff Order for rooftop solar power pr...
 
Franklin Energy $ense Seminar
Franklin Energy $ense SeminarFranklin Energy $ense Seminar
Franklin Energy $ense Seminar
 

Similar to Solar Energy Installation Outlook US | Power Sector | Aranca Articles and Publications

Why Policy Matters - Renewable Energy Market Momentum at Risk - June 2015
Why Policy Matters - Renewable Energy Market Momentum at Risk - June 2015Why Policy Matters - Renewable Energy Market Momentum at Risk - June 2015
Why Policy Matters - Renewable Energy Market Momentum at Risk - June 2015
Scott Clausen
 
Photovoltaic Trends Report from Selected IEA Countries (2016)
Photovoltaic Trends Report from Selected IEA Countries (2016)Photovoltaic Trends Report from Selected IEA Countries (2016)
Photovoltaic Trends Report from Selected IEA Countries (2016)
Turlough Guerin GAICD FGIA
 
McKinsey - Solar power-darkest before dawn
McKinsey - Solar power-darkest before dawnMcKinsey - Solar power-darkest before dawn
McKinsey - Solar power-darkest before dawn
Robert Mertz
 
Report dl
Report dlReport dl
Report dl
PVaccel
 
A Review on Grid-Connected PV System
A Review on Grid-Connected PV SystemA Review on Grid-Connected PV System
A Review on Grid-Connected PV System
ijtsrd
 

Similar to Solar Energy Installation Outlook US | Power Sector | Aranca Articles and Publications (20)

Why Policy Matters - Renewable Energy Market Momentum at Risk - June 2015
Why Policy Matters - Renewable Energy Market Momentum at Risk - June 2015Why Policy Matters - Renewable Energy Market Momentum at Risk - June 2015
Why Policy Matters - Renewable Energy Market Momentum at Risk - June 2015
 
Photovoltaic industry witnessing a paradigm shift
Photovoltaic industry witnessing a paradigm shift Photovoltaic industry witnessing a paradigm shift
Photovoltaic industry witnessing a paradigm shift
 
Solar power Darkest Before Dawn - McKinsey on Sustainability & Resource Pro...
Solar power   Darkest Before Dawn - McKinsey on Sustainability & Resource Pro...Solar power   Darkest Before Dawn - McKinsey on Sustainability & Resource Pro...
Solar power Darkest Before Dawn - McKinsey on Sustainability & Resource Pro...
 
Photovoltaic Trends Report from Selected IEA Countries (2016)
Photovoltaic Trends Report from Selected IEA Countries (2016)Photovoltaic Trends Report from Selected IEA Countries (2016)
Photovoltaic Trends Report from Selected IEA Countries (2016)
 
The disruptive potential of solar power
The disruptive potential of solar powerThe disruptive potential of solar power
The disruptive potential of solar power
 
Solar rooftop opportunities and challenges
Solar rooftop opportunities and challengesSolar rooftop opportunities and challenges
Solar rooftop opportunities and challenges
 
IRJET- Solar Rooftop PV Systems- Markets, Policies and Future Potential
IRJET- Solar Rooftop PV Systems- Markets, Policies and Future PotentialIRJET- Solar Rooftop PV Systems- Markets, Policies and Future Potential
IRJET- Solar Rooftop PV Systems- Markets, Policies and Future Potential
 
Softer Solar Landings: Options to Avoid the Investment Tax Credit Cliff
Softer Solar Landings: Options to Avoid the Investment Tax Credit CliffSofter Solar Landings: Options to Avoid the Investment Tax Credit Cliff
Softer Solar Landings: Options to Avoid the Investment Tax Credit Cliff
 
IEA Technology roadmap solar photovoltaic energy 2014
IEA Technology roadmap solar photovoltaic energy 2014 IEA Technology roadmap solar photovoltaic energy 2014
IEA Technology roadmap solar photovoltaic energy 2014
 
McKinsey - Solar power-darkest before dawn
McKinsey - Solar power-darkest before dawnMcKinsey - Solar power-darkest before dawn
McKinsey - Solar power-darkest before dawn
 
Session 13 national policy & regulatory framework & available incentives
Session 13   national policy & regulatory framework & available incentivesSession 13   national policy & regulatory framework & available incentives
Session 13 national policy & regulatory framework & available incentives
 
Field Essay
Field EssayField Essay
Field Essay
 
Feed In Tariffs
Feed In TariffsFeed In Tariffs
Feed In Tariffs
 
PV Blog
PV BlogPV Blog
PV Blog
 
Report dl
Report dlReport dl
Report dl
 
AUROVILLE RENEWABLE ENERGY SOURCING PLAN
AUROVILLE RENEWABLE ENERGY SOURCING PLANAUROVILLE RENEWABLE ENERGY SOURCING PLAN
AUROVILLE RENEWABLE ENERGY SOURCING PLAN
 
Lushetsky - Solar Vision Forum
Lushetsky - Solar Vision ForumLushetsky - Solar Vision Forum
Lushetsky - Solar Vision Forum
 
Design a Highly Efficient Push-Pull converter for Photovoltaic Applications
Design a Highly Efficient Push-Pull converter for Photovoltaic ApplicationsDesign a Highly Efficient Push-Pull converter for Photovoltaic Applications
Design a Highly Efficient Push-Pull converter for Photovoltaic Applications
 
A Review on Grid-Connected PV System
A Review on Grid-Connected PV SystemA Review on Grid-Connected PV System
A Review on Grid-Connected PV System
 
Solar power - A developer prespective
Solar power - A developer prespectiveSolar power - A developer prespective
Solar power - A developer prespective
 

More from Aranca

More from Aranca (20)

French Animal Healthcare Market
French Animal Healthcare MarketFrench Animal Healthcare Market
French Animal Healthcare Market
 
Global wearable devices market2017
Global wearable devices market2017Global wearable devices market2017
Global wearable devices market2017
 
Commercial drones-future-prospects 2017
Commercial drones-future-prospects 2017Commercial drones-future-prospects 2017
Commercial drones-future-prospects 2017
 
The GCC Facilities Management Market - Aranca
The GCC Facilities Management Market - ArancaThe GCC Facilities Management Market - Aranca
The GCC Facilities Management Market - Aranca
 
Brazilian pesticide market - Aranca
Brazilian pesticide market - ArancaBrazilian pesticide market - Aranca
Brazilian pesticide market - Aranca
 
Global Cryogenic Equipment Industry
Global Cryogenic Equipment IndustryGlobal Cryogenic Equipment Industry
Global Cryogenic Equipment Industry
 
China's Elevator and Escalator Market
China's Elevator and Escalator MarketChina's Elevator and Escalator Market
China's Elevator and Escalator Market
 
Global Aluminium Automotive Sheets Market
Global Aluminium Automotive Sheets MarketGlobal Aluminium Automotive Sheets Market
Global Aluminium Automotive Sheets Market
 
Indian Agro Chemical Sector
Indian Agro Chemical SectorIndian Agro Chemical Sector
Indian Agro Chemical Sector
 
Chinas Luxury Market - Losing Sheen
Chinas Luxury Market - Losing SheenChinas Luxury Market - Losing Sheen
Chinas Luxury Market - Losing Sheen
 
Saudi Aramco IPO - A Reality of Mythical Proportions
Saudi Aramco IPO - A Reality of Mythical ProportionsSaudi Aramco IPO - A Reality of Mythical Proportions
Saudi Aramco IPO - A Reality of Mythical Proportions
 
Fatca high cost initiative to curb tax evasion
Fatca high cost initiative to curb tax evasionFatca high cost initiative to curb tax evasion
Fatca high cost initiative to curb tax evasion
 
Winning shelf space private labels or fmcg brands
Winning shelf space private labels or fmcg brandsWinning shelf space private labels or fmcg brands
Winning shelf space private labels or fmcg brands
 
The disruptive power of virtual currency
The disruptive power of virtual currencyThe disruptive power of virtual currency
The disruptive power of virtual currency
 
Obamacare - Sectoral Winners and Losers
Obamacare - Sectoral Winners and LosersObamacare - Sectoral Winners and Losers
Obamacare - Sectoral Winners and Losers
 
Therapeutic Vaccines for Alzheimer’s — Are We Close Enough?
Therapeutic Vaccines for Alzheimer’s — Are We Close Enough?Therapeutic Vaccines for Alzheimer’s — Are We Close Enough?
Therapeutic Vaccines for Alzheimer’s — Are We Close Enough?
 
Indian Telecom Tower Industry - Aranca Research
Indian Telecom Tower Industry - Aranca ResearchIndian Telecom Tower Industry - Aranca Research
Indian Telecom Tower Industry - Aranca Research
 
Rise of Virtual Reality (VR)
Rise of Virtual Reality (VR)Rise of Virtual Reality (VR)
Rise of Virtual Reality (VR)
 
Insurance Industry is Going to Soar in the GCC
Insurance Industry is Going to Soar in the GCCInsurance Industry is Going to Soar in the GCC
Insurance Industry is Going to Soar in the GCC
 
Evolution of Powered Exoskeletons
Evolution of Powered ExoskeletonsEvolution of Powered Exoskeletons
Evolution of Powered Exoskeletons
 

Recently uploaded

Chandigarh Escorts Service 📞8868886958📞 Just📲 Call Nihal Chandigarh Call Girl...
Chandigarh Escorts Service 📞8868886958📞 Just📲 Call Nihal Chandigarh Call Girl...Chandigarh Escorts Service 📞8868886958📞 Just📲 Call Nihal Chandigarh Call Girl...
Chandigarh Escorts Service 📞8868886958📞 Just📲 Call Nihal Chandigarh Call Girl...
Sheetaleventcompany
 
Call Girls Electronic City Just Call 👗 7737669865 👗 Top Class Call Girl Servi...
Call Girls Electronic City Just Call 👗 7737669865 👗 Top Class Call Girl Servi...Call Girls Electronic City Just Call 👗 7737669865 👗 Top Class Call Girl Servi...
Call Girls Electronic City Just Call 👗 7737669865 👗 Top Class Call Girl Servi...
amitlee9823
 
Call Girls in Delhi, Escort Service Available 24x7 in Delhi 959961-/-3876
Call Girls in Delhi, Escort Service Available 24x7 in Delhi 959961-/-3876Call Girls in Delhi, Escort Service Available 24x7 in Delhi 959961-/-3876
Call Girls in Delhi, Escort Service Available 24x7 in Delhi 959961-/-3876
dlhescort
 
FULL ENJOY Call Girls In Majnu Ka Tilla, Delhi Contact Us 8377877756
FULL ENJOY Call Girls In Majnu Ka Tilla, Delhi Contact Us 8377877756FULL ENJOY Call Girls In Majnu Ka Tilla, Delhi Contact Us 8377877756
FULL ENJOY Call Girls In Majnu Ka Tilla, Delhi Contact Us 8377877756
dollysharma2066
 
unwanted pregnancy Kit [+918133066128] Abortion Pills IN Dubai UAE Abudhabi
unwanted pregnancy Kit [+918133066128] Abortion Pills IN Dubai UAE Abudhabiunwanted pregnancy Kit [+918133066128] Abortion Pills IN Dubai UAE Abudhabi
unwanted pregnancy Kit [+918133066128] Abortion Pills IN Dubai UAE Abudhabi
Abortion pills in Kuwait Cytotec pills in Kuwait
 
Quick Doctor In Kuwait +2773`7758`557 Kuwait Doha Qatar Dubai Abu Dhabi Sharj...
Quick Doctor In Kuwait +2773`7758`557 Kuwait Doha Qatar Dubai Abu Dhabi Sharj...Quick Doctor In Kuwait +2773`7758`557 Kuwait Doha Qatar Dubai Abu Dhabi Sharj...
Quick Doctor In Kuwait +2773`7758`557 Kuwait Doha Qatar Dubai Abu Dhabi Sharj...
daisycvs
 

Recently uploaded (20)

Chandigarh Escorts Service 📞8868886958📞 Just📲 Call Nihal Chandigarh Call Girl...
Chandigarh Escorts Service 📞8868886958📞 Just📲 Call Nihal Chandigarh Call Girl...Chandigarh Escorts Service 📞8868886958📞 Just📲 Call Nihal Chandigarh Call Girl...
Chandigarh Escorts Service 📞8868886958📞 Just📲 Call Nihal Chandigarh Call Girl...
 
Call Girls Ludhiana Just Call 98765-12871 Top Class Call Girl Service Available
Call Girls Ludhiana Just Call 98765-12871 Top Class Call Girl Service AvailableCall Girls Ludhiana Just Call 98765-12871 Top Class Call Girl Service Available
Call Girls Ludhiana Just Call 98765-12871 Top Class Call Girl Service Available
 
Call Girls Electronic City Just Call 👗 7737669865 👗 Top Class Call Girl Servi...
Call Girls Electronic City Just Call 👗 7737669865 👗 Top Class Call Girl Servi...Call Girls Electronic City Just Call 👗 7737669865 👗 Top Class Call Girl Servi...
Call Girls Electronic City Just Call 👗 7737669865 👗 Top Class Call Girl Servi...
 
Call Girls in Delhi, Escort Service Available 24x7 in Delhi 959961-/-3876
Call Girls in Delhi, Escort Service Available 24x7 in Delhi 959961-/-3876Call Girls in Delhi, Escort Service Available 24x7 in Delhi 959961-/-3876
Call Girls in Delhi, Escort Service Available 24x7 in Delhi 959961-/-3876
 
FULL ENJOY Call Girls In Majnu Ka Tilla, Delhi Contact Us 8377877756
FULL ENJOY Call Girls In Majnu Ka Tilla, Delhi Contact Us 8377877756FULL ENJOY Call Girls In Majnu Ka Tilla, Delhi Contact Us 8377877756
FULL ENJOY Call Girls In Majnu Ka Tilla, Delhi Contact Us 8377877756
 
Famous Olympic Siblings from the 21st Century
Famous Olympic Siblings from the 21st CenturyFamous Olympic Siblings from the 21st Century
Famous Olympic Siblings from the 21st Century
 
unwanted pregnancy Kit [+918133066128] Abortion Pills IN Dubai UAE Abudhabi
unwanted pregnancy Kit [+918133066128] Abortion Pills IN Dubai UAE Abudhabiunwanted pregnancy Kit [+918133066128] Abortion Pills IN Dubai UAE Abudhabi
unwanted pregnancy Kit [+918133066128] Abortion Pills IN Dubai UAE Abudhabi
 
Malegaon Call Girls Service ☎ ️82500–77686 ☎️ Enjoy 24/7 Escort Service
Malegaon Call Girls Service ☎ ️82500–77686 ☎️ Enjoy 24/7 Escort ServiceMalegaon Call Girls Service ☎ ️82500–77686 ☎️ Enjoy 24/7 Escort Service
Malegaon Call Girls Service ☎ ️82500–77686 ☎️ Enjoy 24/7 Escort Service
 
Falcon Invoice Discounting: The best investment platform in india for investors
Falcon Invoice Discounting: The best investment platform in india for investorsFalcon Invoice Discounting: The best investment platform in india for investors
Falcon Invoice Discounting: The best investment platform in india for investors
 
(Anamika) VIP Call Girls Napur Call Now 8617697112 Napur Escorts 24x7
(Anamika) VIP Call Girls Napur Call Now 8617697112 Napur Escorts 24x7(Anamika) VIP Call Girls Napur Call Now 8617697112 Napur Escorts 24x7
(Anamika) VIP Call Girls Napur Call Now 8617697112 Napur Escorts 24x7
 
Call Girls Zirakpur👧 Book Now📱7837612180 📞👉Call Girl Service In Zirakpur No A...
Call Girls Zirakpur👧 Book Now📱7837612180 📞👉Call Girl Service In Zirakpur No A...Call Girls Zirakpur👧 Book Now📱7837612180 📞👉Call Girl Service In Zirakpur No A...
Call Girls Zirakpur👧 Book Now📱7837612180 📞👉Call Girl Service In Zirakpur No A...
 
Value Proposition canvas- Customer needs and pains
Value Proposition canvas- Customer needs and painsValue Proposition canvas- Customer needs and pains
Value Proposition canvas- Customer needs and pains
 
👉Chandigarh Call Girls 👉9878799926👉Just Call👉Chandigarh Call Girl In Chandiga...
👉Chandigarh Call Girls 👉9878799926👉Just Call👉Chandigarh Call Girl In Chandiga...👉Chandigarh Call Girls 👉9878799926👉Just Call👉Chandigarh Call Girl In Chandiga...
👉Chandigarh Call Girls 👉9878799926👉Just Call👉Chandigarh Call Girl In Chandiga...
 
Eluru Call Girls Service ☎ ️93326-06886 ❤️‍🔥 Enjoy 24/7 Escort Service
Eluru Call Girls Service ☎ ️93326-06886 ❤️‍🔥 Enjoy 24/7 Escort ServiceEluru Call Girls Service ☎ ️93326-06886 ❤️‍🔥 Enjoy 24/7 Escort Service
Eluru Call Girls Service ☎ ️93326-06886 ❤️‍🔥 Enjoy 24/7 Escort Service
 
Call Girls Service In Old Town Dubai ((0551707352)) Old Town Dubai Call Girl ...
Call Girls Service In Old Town Dubai ((0551707352)) Old Town Dubai Call Girl ...Call Girls Service In Old Town Dubai ((0551707352)) Old Town Dubai Call Girl ...
Call Girls Service In Old Town Dubai ((0551707352)) Old Town Dubai Call Girl ...
 
JAYNAGAR CALL GIRL IN 98274*61493 ❤CALL GIRLS IN ESCORT SERVICE❤CALL GIRL
JAYNAGAR CALL GIRL IN 98274*61493 ❤CALL GIRLS IN ESCORT SERVICE❤CALL GIRLJAYNAGAR CALL GIRL IN 98274*61493 ❤CALL GIRLS IN ESCORT SERVICE❤CALL GIRL
JAYNAGAR CALL GIRL IN 98274*61493 ❤CALL GIRLS IN ESCORT SERVICE❤CALL GIRL
 
How to Get Started in Social Media for Art League City
How to Get Started in Social Media for Art League CityHow to Get Started in Social Media for Art League City
How to Get Started in Social Media for Art League City
 
Uneak White's Personal Brand Exploration Presentation
Uneak White's Personal Brand Exploration PresentationUneak White's Personal Brand Exploration Presentation
Uneak White's Personal Brand Exploration Presentation
 
SEO Case Study: How I Increased SEO Traffic & Ranking by 50-60% in 6 Months
SEO Case Study: How I Increased SEO Traffic & Ranking by 50-60%  in 6 MonthsSEO Case Study: How I Increased SEO Traffic & Ranking by 50-60%  in 6 Months
SEO Case Study: How I Increased SEO Traffic & Ranking by 50-60% in 6 Months
 
Quick Doctor In Kuwait +2773`7758`557 Kuwait Doha Qatar Dubai Abu Dhabi Sharj...
Quick Doctor In Kuwait +2773`7758`557 Kuwait Doha Qatar Dubai Abu Dhabi Sharj...Quick Doctor In Kuwait +2773`7758`557 Kuwait Doha Qatar Dubai Abu Dhabi Sharj...
Quick Doctor In Kuwait +2773`7758`557 Kuwait Doha Qatar Dubai Abu Dhabi Sharj...
 

Solar Energy Installation Outlook US | Power Sector | Aranca Articles and Publications

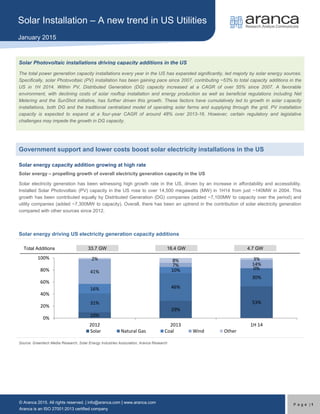
  • 1. EMsSolar Installation – A new trend in US Utilities January 2015 © Aranca 2015. All rights reserved. | info@aranca.com | www.aranca.com Aranca is an ISO 27001:2013 certified company P a g e | 1 Solar Photovoltaic installations driving capacity additions in the US The total power generation capacity installations every year in the US has expanded significantly, led majorly by solar energy sources. Specifically, solar Photovoltaic (PV) installation has been gaining pace since 2007, contributing ~53% to total capacity additions in the US in 1H 2014. Within PV, Distributed Generation (DG) capacity increased at a CAGR of over 55% since 2007. A favorable environment, with declining costs of solar rooftop installation and energy production as well as beneficial regulations including Net Metering and the SunShot initiative, has further driven this growth. These factors have cumulatively led to growth in solar capacity installations, both DG and the traditional centralized model of operating solar farms and supplying through the grid. PV installation capacity is expected to expand at a four-year CAGR of around 48% over 2013-16. However, certain regulatory and legislative challenges may impede the growth in DG capacity. Government support and lower costs boost solar electricity installations in the US Solar energy capacity addition growing at high rate Solar energy – propelling growth of overall electricity generation capacity in the US Solar electricity generation has been witnessing high growth rate in the US, driven by an increase in affordability and accessibility. Installed Solar Photovoltaic (PV) capacity in the US rose to over 14,500 megawatts (MW) in 1H14 from just ~140MW in 2004. This growth has been contributed equally by Distributed Generation (DG) companies (added ~7,100MW to capacity over the period) and utility companies (added ~7,300MW to capacity). Overall, there has been an uptrend in the contribution of solar electricity generation compared with other sources since 2012. Solar energy driving US electricity generation capacity additions Source: Greentech Media Research, Solar Energy Industries Association, Aranca Research 10% 29% 53%31% 46% 30% 16% 10% 0% 41% 7% 14% 2% 8% 3% 0% 20% 40% 60% 80% 100% 2012 2013 1H 14 Solar Natural Gas Coal Wind Other Total Additions 33.7 GW 16.4 GW 4.7 GW
  • 2. EMsSolar Installation – A new trend in US Utilities January 2015 © Aranca 2015. All rights reserved. | info@aranca.com | www.aranca.com Aranca is an ISO 27001:2013 certified company P a g e | 2 Growth in PV capacity installation resulting in 10-yr CAGR of over 65% Decline in solar energy system installation costs and an increase in retail utility electricity prices have made distributed generation of solar energy a viable option for the middle class. As per Lawrence Berkeley National Laboratory, the cost of a DG solar energy systems has been declining at a CAGR of about 10–11% ($4.7—3.9 per watt over varying capacity ranges) over 2007-2013 due to an increase in global production of solar panels (creating economies of scale), government incentives and declining raw material costs. On the other hand, according to EIA, retail utility electricity prices in the US expanded at a CAGR of 3.2% over 2004–13. Installations of DG solar energy systems have grown at an annual rate of 56% over 2003–13 (Source: Solar Energy Industries Association). Separately, the government’s SunShot Initiative aimed at reducing the cost of solar-powered electricity generation across the US, along with increasing competitive threat from DG, has resulted in utilities adding large, centralized PV systems to their existing generation portfolios. Overall, PV installation capacity of utilities increased at a CAGR of 93% over 2003–13. On a cumulative basis, total PV installations have improved by over 65% CAGR over the 10-year period between 2003-2013. This growth has been better than the world average of ~49% CAGR, while in-line with the growth in Europe (~63% CAGR) and less than that of China (~80% CAGR) Total PV installations grew 59.4% Y-o-Y (2,478 MW) in 1H14 (36% Y-o-Y for 2Q14), mainly driven by the Utility PV market, which accounted for 60% of the capacity installed in 1H14 (55% for 2Q14). Utility PV installation surged 94.5% in 1H14 (38%), while DG installations grew 24.8% (34%). PV installations are expected to remain the largest additions to energy generation capacity, driven by traditional utilities and DG companies. According to GTM research, PV installation capacity is expected to increase at a CAGR of around 48% (approximately 9,000MW addition per annum) to around 40,000GW over 2013–16. Solar PV capacity installations growing at high rate Source: Greentech Media Research, Solar Energy Industries Association, Aranca Research Competitive pricing and cost efficiencies driving the DG business model DG solar utility companies such as SolarCity Corp and Vivint Solar Inc provide electricity through solar energy systems installed at customers’ rooftops, as against the traditional model of supplying electricity through the grid from solar farms (traditional utility model). Customers sign long-term contracts for solar electricity wherein they can pay DG companies recurring monthly payments for the PV energy systems, thus avoiding an upfront installation cost. Alternatively, customers may also purchase the systems on loan basis. Furthermore, customers also benefit from lower monthly bills owing to a phenomenon called Net Metering which reduces tariff by providing credit to the customers for unused electricity generated. 0 9,000 18,000 27,000 36,000 45,000 2007 2008 2009 2010 2011 2012 2013 2014E 2015E 2016E InstalledCapacity(MW) DG PV Utility PV 55% CAGR over 2013-2016 41% CAGR over 2013-2016
  • 3. EMsSolar Installation – A new trend in US Utilities January 2015 © Aranca 2015. All rights reserved. | info@aranca.com | www.aranca.com Aranca is an ISO 27001:2013 certified company P a g e | 3 Hence, with low upfront installation payments and running costs, the DG solar energy model helps customers save 15–30% in utility bills over traditional electricity sources. In addition, the business model does not require grids to transmit power to customers, thereby eliminating grid (transmission & distributions) losses of at least 6–7% percent, which would have been passed on to the customer in case of traditional utilities. In recent times, DG utilities have also started offering battery storage systems that provide power backup in case the utility grid goes down. The size of a battery unit is similar to that of a solar power inverter, and can be mounted on the wall or near an electrical panel. DG Utilities also benefit from this business model in the form of long-term contracts (typically for about 20 years) providing revenue visibility and stable recurring cash flows. In addition, the federal government offers a 30% Investment Tax Credit (ITC) to such companies under Section 48(a) of the Internal Revenue Code for installation of solar power facilities. However, this tax credit would reduce to 10% from January 1, 2017. Decline in generation cost and threat from DG pushing utility companies toward PV installations The Utility PV segment has emerged from a greenhorn in the solar market to fastest growing sector in the industry. Utilities build large, centralized PV systems that feed power directly to the grid. Utilities providing electricity to the US have started considering residential solar systems as a threat. According to a study by Lawrence Berkeley National Laboratory, if rooftop solar gains 10% of the market share in the next decade, utility earnings could decline by about 41%. Utilities have also started considering solar energy as a means to reduce costs. Government initiatives have helped lower solar power generation cost from $0.21 per kilowatt-hour in 2010 to $0.11 per kilowatt-hour in 2013. The falling price of utility PV projects since SunShot’s inception has driven major expansions in the segment, with utilities quadrupling their capacities to 7,308MW since 1H2012. Increasing Average Retail Electricity Prices Utility PV – Installed Capacity quadrupled since 1H 12 Source: EIA – Electric Power Monthly October 2014, Aranca Research Source: Greentech Media Research, Solar Energy Industries Association, Aranca Research 6.5 7.0 7.5 8.0 8.5 9.0 9.5 10.0 10.5 11.0 2004 2005 2006 2007 2008 2009 2010 2011 2012 2013 c/kwh 0 2,000 4,000 6,000 8,000 Residential Non Residential Utility InstalledCapacity(MW) 1H 12 1H 14
  • 4. EMsSolar Installation – A new trend in US Utilities January 2015 © Aranca 2015. All rights reserved. | info@aranca.com | www.aranca.com Aranca is an ISO 27001:2013 certified company P a g e | 4 Regulations and Policies: All you need to know SunShot Initiative to help lower cost of utility PV generation In 2011, the Energy Department of the US launched the SunShot Initiative to reduce solar energy cost and make it cost competitive compared with other traditional energy sources in the US. Through affiliations with the industry, universities, local communities and the Department’s national laboratories, the initiative is aimed at reducing the cost of solar energy from about $0.21 per kilowatt-hour in 2010 to $0.06 per kilowatt-hour by 2020. The initiative has been successful in reducing the solar energy cost to $0.11 per kilowatt-hour at the end of 2013 which is below the average US electricity price of about $0.12 per kilowatt-hour (Source: Energy Information Administration). Decline in cost of Utility PV Projects Source: National Renewable Energy Lab, Aranca Research Net Metering continues to be accepted by most states Net Metering, also called Net Energy Metering (NEM), allows residential and commercial customers who generate their own electricity from solar systems to feed excess electricity back into the grid and earn credits in return. NEM is a billing mechanism that allows solar energy systems that generate more electricity than required to feed it back into the grid. Since the output from a PV system may not exactly match the on-site demand for electricity, a home or business with a PV system could export the excess power to the electric grid and import power from the grid when required. For example, if a residential customer has a PV installation on his/her rooftop and it produces excess electricity than what is needed during daytime, it may return the excess units back to the grid; during this time, the electric meter runs backward, providing credit to the customer. The customer can use these credits in times of shortage in electricity production or when the home’s electricity use exceeds the system’s capacity. Customers are only billed for their “net” energy consumption. Currently, 43 states and Washington D.C. have passed Net Metering laws. In other states, utilities may offer net metering programs voluntarily or as a result of regulatory decisions. 0 6 12 18 24 2010 2011 2012 2013 CostofElectricity(c/kwh) Module Inverter Other Hardware Soft Costs 2020 Target
  • 5. EMsSolar Installation – A new trend in US Utilities January 2015 © Aranca 2015. All rights reserved. | info@aranca.com | www.aranca.com Aranca is an ISO 27001:2013 certified company P a g e | 5 Net Metering Policies’ effectiveness varies among states Source: www.freeingthegrid.org Grades in the above map represent various levels of effectiveness of the Net Metering Policies in each state depending on the fee, additional charges, and other obstacles in installation of the Net Metering Systems, with “A” being the most effective and “E” the least. States with grade equivalent to “N/A” do not have any statewide net metering policy. Some utilities perceive this net metering as lost revenue opportunities. On the other hand, proponents of this methodology claim that net metering policies create a smoother demand curve for electricity and allow utilities to better manage their peak electricity loads, thereby increasing reliability of the system. Property-assessed Clean Energy (PACE) program supporting DG installations Property-assessed Clean Energy (PACE) program is aimed at helping homes and business owners finance energy efficiency and renewable energy projects for their properties. It is a voluntary program under which a home or business owner is entitled to receive financing from the local government to cover the up-front cost for qualified energy improvements. Owners have to repay the amount in the form of special assessment on their property tax over a period of years or decades. This financing is secured with a lien on the property, i.e., in case of a foreclosure, financing must be repaid before other claims against the property. Energy efficiency improvements covered include insulation, weather sealing and high-efficiency water heaters as well as solar and other on-site renewable energy systems.
  • 6. EMsSolar Installation – A new trend in US Utilities January 2015 © Aranca 2015. All rights reserved. | info@aranca.com | www.aranca.com Aranca is an ISO 27001:2013 certified company P a g e | 6 Some best practices favoring DG Interconnection Standards need to be pro-DG These are the rules for connecting solar and other electrical systems to the grid and apply to both electricity customers and utilities: State Interconnection Standards: States have jurisdiction over interconnection of customer-owned solar generation to the distribution grid, including projects that are net metered. Federal Interconnection Standards: The Federal Government holds jurisdiction over the interconnection of distributed generation solar projects involving sale of electricity to a utility through the Federal Energy Regulatory Commission (FERC). The FERC issued standards in 2005 facilitating interconnection procedures for small generators that generate 20 megawatts (MW) or less. 15-percent rule/screen: Under the rules governing solar generators interconnections, solar projects under 2 MW may enter into a “fast-track” process of interconnection as long as the total distributed generation is less than 15% of the circuit peak load. Stringent local solar permitting procedures to affect DG adversely In order to install a solar system on a property, the property owner needs to obtain the requisite permissions. Legislations under consideration: According to a report released by SunRun, a streamlined and cost-effective process for permitting solar system installations could reduce the costs for residential systems equivalent to $1 billion in 5 years. Legislation S. 1108 (10 Million Solar Roofs Act of 2011) would provide local communities with a grant and the methods to make solar permitting more feasible. Solar Access Rights to protect property-owners' rights to unobstructed sunlight Local ordinances and Homeowner’s Association (HOA) rules may affect the installation of solar energy systems in homes and businesses. In lieu of outright prohibition, some rules allow third parties to require that solar customers make modifications to their system design; this could unreasonably increase costs, decrease efficiency, or both. Lawmakers are trying to protect property-owners’ solar access rights.  Solar Easements: allow a property owner to negotiate for the rights to unobstructed sunlight on their property  Solar Access Laws: provide more protection to solar customers by prohibiting or limiting private restrictions on solar energy installations Legislations under consideration: The Solar Opportunity & Local Access Rights (SOLAR) Act establishes the right of every American citizen to:  operate a solar energy system on their property;  restrict excessive local solar permitting fees; and  establishes national net metering and interconnection standards, solar access rights, and 30-year government power contracting authority.
  • 7. EMsSolar Installation – A new trend in US Utilities January 2015 © Aranca 2015. All rights reserved. | info@aranca.com | www.aranca.com Aranca is an ISO 27001:2013 certified company P a g e | 7 Solar electricity generation – a long way to go... Constitutes just a small proportion of the US electricity generation capacity Considering the prevalence of natural gas and coal as major sources of fuel in the US (constituting about 68% of the country’s total generation capacity), solar at 1% accounts for a very small portion of this huge generation base. Therefore, the impact of growth in solar has not been as phenomenal in terms of generation as one would have expected. Nevertheless, the trend is positive and solar as a base fuel can be considered a viable option with more government support programs (like the SunShot initiative) that promote distributed generation. Solar electricity – accounting for small % of overall generation capacity Source: EIA – Electric Power Monthly October 2014, Greentech Media Research, Solar Energy Industries Association, Aranca Research Reduced electricity usage from grid to adversely impact prices due to fixed grid maintenance charges Electricity demand from utilities has declined following the increase in DG’s reach. However, utilities would still be required to incur fixed costs associated with maintaining grids, as customers with installed solar rooftops would still be connected to the grid. This would result in higher electricity rates for existing utility customers; this would encourage more people to install solar rooftop panels for cheaper electricity. Traditional utilities trying to limit solar rooftop installation growth, sighting DG companies as threat Consumers with rooftop solar installations have already reduced their electricity usage from the traditional grid. Not only is the solar rooftop energy model cost efficient but also the net metering system provides end users with electricity credit for the excess energy generated and exported to the grid. Traditional utilities are protesting against the net metering laws and battery backups wired to solar panels, stating that the power flowing back to the grid may not be “clean energy”. The net metering policy requires utilities to purchase electricity from consumers with solar installations (obligatory by state legislation or voluntarily by some utilities) at the price that customers pay for the grid. This results in loss of revenues for utilities. Furthermore, utilities are demanding a maintenance or connection charge from rooftop solar owners. Alternatively, utilities in a few states have proposed lower prices to be paid for exported excess solar electricity. The Arizona Public Service Company (an electric utility engaged in retail and wholesale electric distribution in the State of Arizona), for instance, demanded a $50 per month charge from its rooftop solar owners. The regulator approved a charge of $5 for the same. Currently, there are pending proposals to scale back net metering laws in 20 states. While new regulatory laws are expected to be issued at some point in future, how much would those favor solar rooftop installations or hamper their growth is anybody’s guess. Research Note by: Kartik Sabharwal and Jay Thakker Natural Gas 40% Coal 28% Other renewable Sources 15% Nuclear 9% Petroleum Liquids 4% Solar energy 1% Other Sources 3%
  • 8. EMsSolar Installation – A new trend in US Utilities January 2015 © Aranca 2015. All rights reserved. | info@aranca.com | www.aranca.com Aranca is an ISO 27001:2013 certified company P a g e | 8 ARANCA DISCLAIMER This report is published by Aranca, Inc. Aranca is a customized research and analytics services provider to global clients. The information contained in this document is confidential and is solely for use of those persons to whom it is addressed and may not be reproduced, further distributed to any other person or published, in whole or in part, for any purpose. This document is based on data sources that are publicly available and are thought to be reliable. Aranca may not have verified all of this information with third parties. Neither Aranca nor its advisors, directors or employees can guarantee the accuracy, reasonableness or completeness of the information received from any sources consulted for this publication, and neither Aranca nor its advisors, directors or employees accepts any liability whatsoever (in negligence or otherwise) for any loss howsoever arising from any use of this document or its contents or otherwise arising in connection with this document. Further, this document is not an offer to buy or sell any security, commodity or currency. This document does not provide individually tailored investment advice. It has been prepared without regard to the individual financial circumstances and objectives of persons who receive it. The appropriateness of a particular investment or currency will depend on an investor’s individual circumstances and objectives. The investments referred to in this document may not be suitable for all investors. This document is not to be relied upon and should not be used in substitution for the exercise of independent judgment. This document may contain certain statements, estimates, and projections with respect to the anticipated future performance of securities, commodities or currencies suggested. Such statements, estimates, and projections are based on information that we consider reliable and may reflect various assumptions made concerning anticipated economic developments, which have not been independently verified and may or may not prove correct. No representation or warranty is made as to the accuracy of such statements, estimates, and projections or as to its fitness for the purpose intended and it should not be relied upon as such. Opinions expressed are our current opinions as of the date appearing on this material only and may change without notice. © 2015, Aranca. All rights reserved.