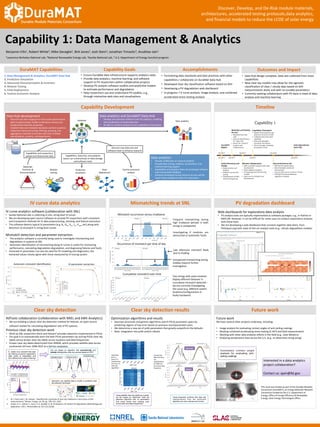
DuraMat Data Management and Analytics
•
0 gefällt mir•190 views

Poster given at the DuraMat Fall workshop, Aug 28, 2018
Empfohlen

Empfohlen
Weitere ähnliche Inhalte
Was ist angesagt?
Was ist angesagt? (20)
Ähnlich wie DuraMat Data Management and Analytics
Ähnlich wie DuraMat Data Management and Analytics (20)
Mehr von Anubhav Jain
Mehr von Anubhav Jain (20)
Kürzlich hochgeladen
Kürzlich hochgeladen (20)
DuraMat Data Management and Analytics
- 1. Discover, Develop, and De-Risk module materials, architectures, accelerated testing protocols,data analytics, and financial models to reduce the LCOE of solar energy Unexpected mismatching during midday requires further investigation RdTools collaboration (collaboration with NREL and kWh Analytics) • We are building a robust clear sky detection method for Rdtools, an open-source software toolset for calculating degradation rate of PV systems. Previous clear sky detection work • Work by SNL researchers Reno and Hansen1 provides detection implemented in PVLib • Our goal is to automatically learn the best PVLib parameters by scoring PVLib clear sky labels versus known clear sky labels across locations and data frequencies • Known clear sky labels determined from NSRDB, which provides satellite data across continental US from 1998-2015 at a 4x4 km resolution Capability 1: Data Management & Analytics Benjamin Ellis1, Robert White2, Mike Deceglie2, Birk Jones3, Josh Stein3, Jonathan Trinastic4, Anubhav Jain1 1Lawrence Berkeley National Lab, 2National Renewable Energy Lab, 3Sandia National Lab, 4 U.S. Department of Energy Sunshot program • Ensure DuraMat data infrastructure supports analytics tasks • Provide data analytics, machine learning, and software support to PV researchers within collaborative projects • Develop PV analysis software toolkits and predictive models to estimate performance and degradation • Help researchers use and understand PV toolkits, e.g., through interactive web sites and visualizations • Formalizing data standards and best practices with other capabilities / collaborate on DuraMat Data Hub • Developed clear sky classification software based on GHI • Developing a PV degradation web dashboard • In progress: I-V curve analysis, image analysis, and combined accelerated stress testing analysis • Data Hub design complete, data sets collected from most capabilities • New clear sky models may allow for site-agnostic classification of clear / cloudy days based on GHI measurements alone and with no tunable parameters • Currently seeking collaborators with PV data in need of data analysis and machine learning Capability Goals Accomplishments Outcomes and Impact DuraMAT Capabilities 1. Data Management & Analytics, DuraMAT Data Hub 2. Predictive Simulation 3. Advanced Characterization & Forensics 4. Module Testing 5. Field Deployment 6. Techno-Economic Analysis Capability Development IV curve data analytics Mismatching trends at SNL Clear sky detection Clear sky detection results Timeline PV degradation dashboard Future work Field deployment DataHub Data analytics Materials Forensics & Characterization Predictive simulation Module testing Techno-economic analysis Data analytics and DuraMAT Data Hub • Develop and advertise software tools for analytics, modeling and visualization of stored data sets • Be able to combine analyses across capabilities and projects Capabilities and researchers upload and disseminate data Discover new data sets and software tools to enhance research Capabilities, Data Hub, and analytics teams can communicate on data storage and software tools Data analytics • Directly collaborate on research projects • Provide data mining, analytics, visualization, and machine learning support • Capabilities and analytics team can prototype software tools and provide feedback • Software developed during research process will be made freely available to other PV researchers IV curve analytics software (collaboration with SNL) • Sandia National Labs is collecting in-situ, string level IV curves • We are developing open-source software to provide PV researchers with consistent and transparent methods for IV data preprocessing, cleaning, and feature extraction • The software detects typical IV parameters (e.g. Rs, Rsh, Voc, Isc, Pmax, etc) along with detection of mismatch in string-level curves Mismatch detection and parameter extraction • This analytics software is currently being used to investigate mismatching and degradation in systems at SNL • Automatic identification of mismatching along IV curves is useful for monitoring performance, calculating degradation degradation, and diagnosing failures and faults • Extracted IV parameters can also be used for PV modeling and diagnostics; the extracted values closely agree with those measured by IV tracing system Data Hub development • Hub will host data ranging from time-series performance data to spectroscopic studies to literature surveys and fundamental materials properties • Establish data and metadata standards and best practices • Implement advanced sorting, filtering, querying, and aggregation methods to link data sets from multiple specializations, projects, and experiments 1. M. J. Reno and C. W. Hansen, “Identification of periods of clear sky irradiance in time series of GHI measurements,” Renew. Energy, vol. 90, pp. 520–531, 2016. 2. Jordan, D. C., Deline, C., Kurtz, S. R., Kimball, G. M. & Anderson, M. Robust PV Degradation Methodology and Application. IEEE J. Photovoltaics 8, 525–531 (2018) Automatic mismatch identification IV parameter extraction Mismatch occurrence versus irradiance Occurrence of mismatch per time of day Late afternoon mismatch likely due to shading Cumulative mismatch over time Future work We have several other projects underway, including: • Image analysis for evaluating contact angles of anti-soiling coatings • Relating combined accelerating stress testing (C-AST) and field measurements • Working with other data analytics efforts in the field (e.g., Case Western) • Analyzing temperature data across the U.S. (e.g., to determine string sizing) Frequent mismatching during high irradiance periods in both strings is unexpected Investigating if modules are obstructed or systematic faults Two strings with same modules display different behavior in cumulative mismatch detected – we are currently investigating the cause (e.g. different system locations/configurations or faulty hardware) Optimization algorithms and resutls • Gaussian processes and genetic algorithms search PVLib parameter space by predicting regions of low error based on previous score/parameter pairs • We determine a new set of pvlib parameters that greatly outperform the defaults • Next: integration into pvlib and/or rdtools Web dashboards for exploratory data analysis • PV analysis tools are typically implemented as software packages, e.g., in Python or MATLAB. However, it can be difficult for some users to conduct exploratory analyses with these tools. • We are developing a web dashboard that connects together data (here, from PVOutput.org) with state-of-the-art analysis tools (e.g., rdtools degradation models) D. Jordan et al. showed2 that clear sky filtering produces degradation rates closer to expectation and 20% different than without filtering! Generally clear Scattered cloudsPersistent clouds Can we design an algorithm that automatically and reliably distinguishes clear sky periods based on GHI? Approach: use satellite data to modify a published clear sky detection technique1 Using satellite clear sky labels as a guide, we can design an “optimized” clear sky detection algorithm with no parameters that works better than existing pvlib across sites and data frequencies! Heatmaps plot F0.5 scores, or classification accuracy, of clear sky algorithms Visual inspection confirms that clear sky classifications from the optimized algorithm are more relevant and correct. default optimized Sample GHI data and clear sky classifications for BMS site, 30 minute data frequency Automated contact angle analysis for evaluating anti- soiling coatings Interested in a data analytics project collaboration? Contact us: ajain@lbl.gov This work was funded as part of the Durable Modules Consortium (DuraMAT), an Energy Materials Network Consortium funded by the U.S. Department of Energy, Office of Energy Efficiency & Renewable Energy, Solar Energy Technologies Office.