SlideShare a Scribd company logo
1 of 20
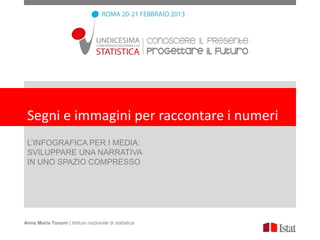
Segni e immagini per raccontare i numeri
 L’INFOGRAFICA PER I MEDIA:
 SVILUPPARE UNA NARRATIVA
 IN UNO SPAZIO COMPRESSO


Anna Maria Tononi | Istituto nazionale di statistica
Sviluppare una narrativa in uno spazio compresso
   Infografica
   la narrazione ‘’a colpo d’occhio’’


               ROMA 20-21 FEBBRAIO 2013
Infografica, come e perché

L’infografica è un mix di

• elementi grafici, rappresentano dati o
informazioni (o entrambe le cose)

• elementi testuali brevi, spesso con
funzione didascalica

Il messaggio è coinciso ma completo,
sfrutta oltre alle parole i segni di
metacomunicazione.

     ROMA 20-21 FEBBRAIO 2013
Infografica, come e perché

           Perché è scoppiata
           l’infografica mania
           (fra i media e non solo)
           • Sotto il diluvio dei dati la parola d’ordine è
           umanizzare i numeri per farli capire a una vasta audience.
           La popolarità del Data Journalism.

           • E’ diminuito il tempo dedicato alla lettura. I giornali
           tradizionali puntano sulla visualizzazione. Il primato
           del testo è in crisi.

           • Su Internet non si legge, si fa zapping (Jacob Nielsen)

           • Strumento di social media marketing.


                  ROMA 20-21 FEBBRAIO 2013
I dati Istat raccontati dalle infografiche/1
lic per modificare titolo


                            ROMA 20-21 FEBBRAIO 2013
I dati Istat raccontati dalle infografiche/2
lic per modificare titolo


                            ROMA 20-21 FEBBRAIO 2013
I dati Istat raccontati dalle infografiche/3
lic per modificare titolo


                            ROMA 20-21 FEBBRAIO 2013
I dati Istat raccontati attraverso infografiche/4
are clic per modificare titolo


                                 ROMA 20-21 FEBBRAIO 2013
I dati Istat raccontati attraverso infografiche/5
Fare clic per modificare titolo


                                  ROMA 20-21 FEBBRAIO 2013
I dati Istat raccontati attraverso infografiche


                  ROMA 20-21 FEBBRAIO 2013
I dati Istat raccontati attraverso infografiche/6


                  ROMA 20-21 FEBBRAIO 2013
I dati Istat raccontati attraverso infografiche/7


                  ROMA 20-21 FEBBRAIO 2013
I dati Istat raccontati attraverso infografiche/8
Fare clic per modificare titolo


                                  ROMA 20-21 FEBBRAIO 2013
I dati Istat raccontati attraverso infografiche/9
Fare clic per modificare titolo


                                  ROMA 20-21 FEBBRAIO 2013
Nuovi strumenti per la statistica ufficiale
Fare clic per modificare titolo


                                  I dati resi più comprensibili per la
                                  gente comune. La statistica ufficiale
                                  si apre a nuovi strumenti di
                                  comunicazione:
                                  • lo storytelling: costruire una storia
                                  con i dati. Il comunicato stampa
                                  sempre più un semilavorato per i
                                  giornalisti.
                                  • entrano nel comunicato stampa
                                  elementi di visualizzazione.

                                        ROMA 20-21 FEBBRAIO 2013
Nuovi strumenti per la statistica ufficiale
Fare clic per modificare titolo


                                  ROMA 20-21 FEBBRAIO 2013
Nuovi strumenti per la statistica ufficiale
Fare clic per modificare titolo


                                  ROMA 20-21 FEBBRAIO 2013
Nuovi strumenti per la statistica ufficiale
Fare clic per modificare titolo


                                  ROMA 20-21 FEBBRAIO 2013
Nuovi strumenti per la statistica ufficiale
Fare clic per modificare titolo


                                  ROMA 20-21 FEBBRAIO 2013
Nuovi strumenti per la statistica ufficiale
Fare clic per modificare titolo


                                  ROMA 20-21 FEBBRAIO 2013

More Related Content

Featured

Social Media Marketing Trends 2024 // The Global Indie Insights
Social Media Marketing Trends 2024 // The Global Indie InsightsSocial Media Marketing Trends 2024 // The Global Indie Insights
Social Media Marketing Trends 2024 // The Global Indie Insights
Kurio // The Social Media Age(ncy)
 

Featured (20)

Skeleton Culture Code
Skeleton Culture CodeSkeleton Culture Code
Skeleton Culture Code
 
PEPSICO Presentation to CAGNY Conference Feb 2024
PEPSICO Presentation to CAGNY Conference Feb 2024PEPSICO Presentation to CAGNY Conference Feb 2024
PEPSICO Presentation to CAGNY Conference Feb 2024
 
Content Methodology: A Best Practices Report (Webinar)
Content Methodology: A Best Practices Report (Webinar)Content Methodology: A Best Practices Report (Webinar)
Content Methodology: A Best Practices Report (Webinar)
 
How to Prepare For a Successful Job Search for 2024
How to Prepare For a Successful Job Search for 2024How to Prepare For a Successful Job Search for 2024
How to Prepare For a Successful Job Search for 2024
 
Social Media Marketing Trends 2024 // The Global Indie Insights
Social Media Marketing Trends 2024 // The Global Indie InsightsSocial Media Marketing Trends 2024 // The Global Indie Insights
Social Media Marketing Trends 2024 // The Global Indie Insights
 
Trends In Paid Search: Navigating The Digital Landscape In 2024
Trends In Paid Search: Navigating The Digital Landscape In 2024Trends In Paid Search: Navigating The Digital Landscape In 2024
Trends In Paid Search: Navigating The Digital Landscape In 2024
 
5 Public speaking tips from TED - Visualized summary
5 Public speaking tips from TED - Visualized summary5 Public speaking tips from TED - Visualized summary
5 Public speaking tips from TED - Visualized summary
 
ChatGPT and the Future of Work - Clark Boyd
ChatGPT and the Future of Work - Clark Boyd ChatGPT and the Future of Work - Clark Boyd
ChatGPT and the Future of Work - Clark Boyd
 
Getting into the tech field. what next
Getting into the tech field. what next Getting into the tech field. what next
Getting into the tech field. what next
 
Google's Just Not That Into You: Understanding Core Updates & Search Intent
Google's Just Not That Into You: Understanding Core Updates & Search IntentGoogle's Just Not That Into You: Understanding Core Updates & Search Intent
Google's Just Not That Into You: Understanding Core Updates & Search Intent
 
How to have difficult conversations
How to have difficult conversations How to have difficult conversations
How to have difficult conversations
 
Introduction to Data Science
Introduction to Data ScienceIntroduction to Data Science
Introduction to Data Science
 
Time Management & Productivity - Best Practices
Time Management & Productivity -  Best PracticesTime Management & Productivity -  Best Practices
Time Management & Productivity - Best Practices
 
The six step guide to practical project management
The six step guide to practical project managementThe six step guide to practical project management
The six step guide to practical project management
 
Beginners Guide to TikTok for Search - Rachel Pearson - We are Tilt __ Bright...
Beginners Guide to TikTok for Search - Rachel Pearson - We are Tilt __ Bright...Beginners Guide to TikTok for Search - Rachel Pearson - We are Tilt __ Bright...
Beginners Guide to TikTok for Search - Rachel Pearson - We are Tilt __ Bright...
 
Unlocking the Power of ChatGPT and AI in Testing - A Real-World Look, present...
Unlocking the Power of ChatGPT and AI in Testing - A Real-World Look, present...Unlocking the Power of ChatGPT and AI in Testing - A Real-World Look, present...
Unlocking the Power of ChatGPT and AI in Testing - A Real-World Look, present...
 
12 Ways to Increase Your Influence at Work
12 Ways to Increase Your Influence at Work12 Ways to Increase Your Influence at Work
12 Ways to Increase Your Influence at Work
 
ChatGPT webinar slides
ChatGPT webinar slidesChatGPT webinar slides
ChatGPT webinar slides
 
More than Just Lines on a Map: Best Practices for U.S Bike Routes
More than Just Lines on a Map: Best Practices for U.S Bike RoutesMore than Just Lines on a Map: Best Practices for U.S Bike Routes
More than Just Lines on a Map: Best Practices for U.S Bike Routes
 
Ride the Storm: Navigating Through Unstable Periods / Katerina Rudko (Belka G...
Ride the Storm: Navigating Through Unstable Periods / Katerina Rudko (Belka G...Ride the Storm: Navigating Through Unstable Periods / Katerina Rudko (Belka G...
Ride the Storm: Navigating Through Unstable Periods / Katerina Rudko (Belka G...
 

Ppt infografiche tononi

  • 1. Segni e immagini per raccontare i numeri L’INFOGRAFICA PER I MEDIA: SVILUPPARE UNA NARRATIVA IN UNO SPAZIO COMPRESSO Anna Maria Tononi | Istituto nazionale di statistica
  • 2. Sviluppare una narrativa in uno spazio compresso Infografica la narrazione ‘’a colpo d’occhio’’ ROMA 20-21 FEBBRAIO 2013
  • 3. Infografica, come e perché L’infografica è un mix di • elementi grafici, rappresentano dati o informazioni (o entrambe le cose) • elementi testuali brevi, spesso con funzione didascalica Il messaggio è coinciso ma completo, sfrutta oltre alle parole i segni di metacomunicazione. ROMA 20-21 FEBBRAIO 2013
  • 4. Infografica, come e perché Perché è scoppiata l’infografica mania (fra i media e non solo) • Sotto il diluvio dei dati la parola d’ordine è umanizzare i numeri per farli capire a una vasta audience. La popolarità del Data Journalism. • E’ diminuito il tempo dedicato alla lettura. I giornali tradizionali puntano sulla visualizzazione. Il primato del testo è in crisi. • Su Internet non si legge, si fa zapping (Jacob Nielsen) • Strumento di social media marketing. ROMA 20-21 FEBBRAIO 2013
  • 5. I dati Istat raccontati dalle infografiche/1 lic per modificare titolo ROMA 20-21 FEBBRAIO 2013
  • 6. I dati Istat raccontati dalle infografiche/2 lic per modificare titolo ROMA 20-21 FEBBRAIO 2013
  • 7. I dati Istat raccontati dalle infografiche/3 lic per modificare titolo ROMA 20-21 FEBBRAIO 2013
  • 8. I dati Istat raccontati attraverso infografiche/4 are clic per modificare titolo ROMA 20-21 FEBBRAIO 2013
  • 9. I dati Istat raccontati attraverso infografiche/5 Fare clic per modificare titolo ROMA 20-21 FEBBRAIO 2013
  • 10. I dati Istat raccontati attraverso infografiche ROMA 20-21 FEBBRAIO 2013
  • 11. I dati Istat raccontati attraverso infografiche/6 ROMA 20-21 FEBBRAIO 2013
  • 12. I dati Istat raccontati attraverso infografiche/7 ROMA 20-21 FEBBRAIO 2013
  • 13. I dati Istat raccontati attraverso infografiche/8 Fare clic per modificare titolo ROMA 20-21 FEBBRAIO 2013
  • 14. I dati Istat raccontati attraverso infografiche/9 Fare clic per modificare titolo ROMA 20-21 FEBBRAIO 2013
  • 15. Nuovi strumenti per la statistica ufficiale Fare clic per modificare titolo I dati resi più comprensibili per la gente comune. La statistica ufficiale si apre a nuovi strumenti di comunicazione: • lo storytelling: costruire una storia con i dati. Il comunicato stampa sempre più un semilavorato per i giornalisti. • entrano nel comunicato stampa elementi di visualizzazione. ROMA 20-21 FEBBRAIO 2013
  • 16. Nuovi strumenti per la statistica ufficiale Fare clic per modificare titolo ROMA 20-21 FEBBRAIO 2013
  • 17. Nuovi strumenti per la statistica ufficiale Fare clic per modificare titolo ROMA 20-21 FEBBRAIO 2013
  • 18. Nuovi strumenti per la statistica ufficiale Fare clic per modificare titolo ROMA 20-21 FEBBRAIO 2013
  • 19. Nuovi strumenti per la statistica ufficiale Fare clic per modificare titolo ROMA 20-21 FEBBRAIO 2013
  • 20. Nuovi strumenti per la statistica ufficiale Fare clic per modificare titolo ROMA 20-21 FEBBRAIO 2013