SlideShare ist ein Scribd-Unternehmen logo
1 von 47
Entorno Cycles


                    We are passionate about kids & environment


25th July, 2012


                            1
Executive Summary

Indian Bicycle Industry is very large with India producing almost 10% of total Bicycle
production of the world and exporting around $200 million of it. Out of the complete sales of
bicycle, around 13% is constituted by the kids segment with CAGR (Compounded Annual
Growth Rate) of around 20%. With many brands present in the bicycle industry, a new
approach towards marketing is needed and also to penetrate competitive market cost
competitiveness is required. The kids segment of bicycle is mostly unorganized with very few
companies focussing on this quickly growing and lucrative section. Most of the parents who
have higher purchasing power and less time to spend with their kids are mostly looking
towards buying things online. This provides a good opportunity to provide various designs of
hi quality kids bicycles online for the parents to buy and free them off of going to the market
themselves as free home delivery is provided by the company. Also since many of the kids
are very choosy and would like to customize the cycle with various models, designs and also
different accessories, the online portal will provide a platform for the various people to come
and select their unique cycle in terms of colour and accessories.

Currently in the marketplace, a prospective customer usually goes out on their own to hunt
for a bicycle either for themselves or for the kids. This usually involves dedicating some time
and energy along with the money spent in transportation to and from the market and home
respectively. Also transportation of the cycle to home is also a major problem. But with home
delivery of the cycle along with customization of accessories and an option of Cash On
Delivery with almost the same price as that with the retailer, this service provides an
additional value that customer can drive out of the company.

Although the online e-portal is a good way to enter the marketplace, the bulk sales in the
beginning will have to be made by the retailer’s dealer network where both a discount and a
credit period will have to be provided to the retailer to promote the sales. But in the long run
it not only creates a valuable dealer network but also a loyal direct sales network with benefit
of both the models.


                                               2
Contents
BICYCLE INDUSTRY .................................................................................................................................. 5
   Indian Bicycle Industry ........................................................................................................................ 5
   Global Bicycle Industry........................................................................................................................ 6
   Segments within the Indian Bicycle Industry ...................................................................................... 8
       Kids Segment................................................................................................................................... 9
   Indian Bicycle Industry - Manufacturing .......................................................................................... 10
   Government policies ......................................................................................................................... 11
   PORTER’S ANALYSIS FOR BICYCLE INDUSTRY.................................................................................... 12
COMPANY DETAILS ............................................................................................................................... 14
   Mission .............................................................................................................................................. 14
   Vision................................................................................................................................................. 14
   Keys to Success ................................................................................................................................. 14
   Legal Status ....................................................................................................................................... 14
   About Promoters .............................................................................................................................. 15
MARKET ANALYSIS ................................................................................................................................ 15
   SWOT ANALYSIS ................................................................................................................................ 15
   Competitor Analysis .......................................................................................................................... 19
    Market Share of Major players ........................................................................................................ 20
   Sales over the years .......................................................................................................................... 21
   Survey Analysis.................................................................................................................................. 21
   Purpose of visit to Kid's Bicycle Store ............................................................................................... 22
   USPs Determining Purchase Decision ............................................................................................... 22
   Preferred Amount to be spend on Kid’s Bicycle ............................................................................... 23
   Customization in Bicycles.................................................................................................................. 23
   Online Purchase of Bicycles .............................................................................................................. 24
OPERATIONS ......................................................................................................................................... 25
   Technical Requirements.................................................................................................................... 25
       The Fixed costs for manufacturing and operations would include: .............................................. 25
       The Variable costs for manufacturing and operations include:..................................................... 26
   Operations Strategy ........................................................................................................................... 26
       Through retailers ........................................................................................................................... 26
       E-Portal ......................................................................................................................................... 26
       The model describes the process of billing the customer online................................................... 27


                                                                             3
Flow of supply chain:........................................................................................................................ 27
MARKETING STRATEGY ......................................................................................................................... 28
   Our Marketing Strategy: ................................................................................................................... 28
   Branding: ........................................................................................................................................... 29
       Logo ............................................................................................................................................... 29
   Marketing Mix: .................................................................................................................................. 29
       Product:......................................................................................................................................... 29
       Price: ............................................................................................................................................. 30
       Place: ............................................................................................................................................. 30
       Promotion: .................................................................................................................................... 30
FINANCIAL PROJECTIONS ...................................................................................................................... 34
   Assumptions & Facts Used in Financial Projections: ........................................................................ 34
   Analysis of Balance Sheet (Normal Scenario) ................................................................................... 35
       Application of Funds: ................................................................................................................... 35
       Sources of Funds: .......................................................................................................................... 36
   Analysis of Income Statement (Normal Scenario)............................................................................ 37
   Cash Flow Statement ........................................................................................................................ 39
   BREAKEVEN ANALYSIS ....................................................................................................................... 40
   SCENARIO ANALYSIS ......................................................................................................................... 41
       Scenario 1...................................................................................................................................... 41
       Scenario 2...................................................................................................................................... 42
       Scenario 3...................................................................................................................................... 42
   FINANCIAL RATIO ANALYSIS .............................................................................................................. 43
       Liquidity Ratios .............................................................................................................................. 43
       Profitability Ratios ......................................................................................................................... 45
   WORKING CAPITAL FINANCING ........................................................................................................ 46
ANNEXURES .......................................................................................................................................... 47


                                                                             4
BICYCLE INDUSTRY
Indian Bicycle Industry
The size of the Indian bicycle industry stands at US $1.2 billion. The number of units
(finished bicycles including all segments) produced is around 12 million, according to an
industry source. Of this, the number of units exported annually is about two to three million,
which points to a huge demand in the domestic market. According to figures from the
Engineering Exports Promotion Council, in 2007-08 India exported bicycles and components
worth US $185.42 million.


The market for the premium or the lifestyle bikes targeted towards the lifestyle consumer is
just about emerging. The definition of high end bikes itself is changing. Earlier the high-end
bikes were considered as those selling between Rs. 5000 to 8000. However now with global
brands moving into the country this definition is also changing with price-points starting from
Rs.15000 to as high as a few lakhs!


The country today is on the threshold of globalisation and teaming million are looking for
higher level of growth together with equitable distribution of income to improve their lots.
Generally the economic signs appear to be favorable for the country to improve its
performance and in turn improve the lot of its people. Obviously; this improvement is going
to reflect upon the Bicycle Industry in particular and transport segment in general. With
customers of the country aspiring for higher and higher the current Bicycles users will be
graduating to auto two-wheelers, but there will be a new population looking to the bicycle as
means of transport. Similarly a new generation of buyer will look to bicycle as a mean of
leisure recreation and good way to keep fit.

We, therefore, see a healthy sustained growth of cycle industry. Presuming that growth of last
3-4 years is sustained for next 10 years i.e. the time we reach the year 2010, the Indian
bicycle industry would need to produce about 1.75 crore bicycles to plug the demand and
supply gap. However, there will be a change in the demand pattern linked with consumer
changing aspiration and choice giving way to latest technology and newer marketing
concepts. Industry is already witnessing this to some extent.


The new millennium has brought new challenge of opening up of import of Cycles. The


                                               5
manufacturers in India agree to the point that Indian Bicycle Industry does not foresee any
problem as the product offered today by Indian manufacturers in the market are best suited to
Indian conditions and are most economical and value for money products.


On the whole the future for Indian industry including Bicycle will be challenging. The
domestic market will be open to good and services from global companies with low tariffs.
Protection will be a thing of the past. The companies that will survive will be those which
successfully restructure and modernise to achieve global competitiveness in terms of both
quality, cost and distribution system.


Global Bicycle Industry

The bicycle is an important means of transportation in most developing and under-developed
countries like China, India and Vietnam. In the developed world, especially in the European
and North American countries, however, bicycles encompass multiple functions from basic
transportation to sports. Consequently, the bicycle’s utility varies depending on the region,
nationality and level of economic development.

Global economic prosperity and seasonal factors heavily influence the bicycle industry.
Economic downturns affect bicycle demand as well. Moreover, traditionally, spring and
autumn are peak seasons for bicycle sales worldwide. Therefore, manufacturers adjust their
output accordingly in order to avoid excess inventory.

China, with a population of around 1.2 billion, consumes 25-30 million bicycles a year and in
addition, exports around 15 million units. USA and Japan, with an estimated population of
250 million and 125 million respectively, consume around 20 million and 7 million bicycles a
year respectively. In contrast, India, with a population of 1 billion only consumes around 12
million bicycles a year, which indicates its low penetration levels.

Global bicycle production, which is today estimated at approximately 100 million units per
annum, has grown at a CAGR of 0.94% between 1990 and 2000. China, which is known as
the kingdom of bicycles, is the world’s largest producer of bicycles and accounted for 52% of
the world’s bicycle production in 2000, followed by India (11%), Taiwan (7%) and Japan
(5%).


                                               6
China's bicycle industry comprises 1081 plants (including component makers) with a total
capacity of around 70 million units. As a result of the prosperity in the home market in the
late 1980s, production grew rapidly in the 1990s and a multitude of small assembly plants
were set up. For the most part of the 1990s, however, production in China was volatile due to
the changing domestic demand. China witnessed a spurt in production towards the end of the
last decade as over 100 Taiwanese manufacturers shifted base to different Chinese cities
because of the availability of cheap labour.

USA, which was once among the top five global producers, has gradually lost market share
as Chinese and Taiwanese products have flooded the US market. Of the approximately 19
million bicycles sold in the US market in 2001 (compared to 21 million in 2000), imports
accounted for over 90% of the pie. USA, in fact, is the largest importer of bicycles and
imports from China and Taiwan accounted for 75% and 15% of its total imports in 2001. The
unit price of Chinese bicycles was lower at around US$ 41, however, compared to US$ 94
per unit for Taiwanese bicycles since the former are mainly traditional light bikes.

The global trade in bicycles is estimated at around 30 million units, with Europe, North
America and Japan accounting for around 70% of it. These markets are characterized by


                                               7
their large and steady demand and high retail prices. China exports around 25-30% of its
bicycle production to Europe and USA. Chinese bicycle makers have secured a foothold in
the high-end export markets due to their superior products, which use high-tech raw materials
like titanium alloy, chrome-molybdenum alloy and carbon fibre. Europe is the largest
destination for Taiwanese bicycles followed by USA.

Overall, bicycle exports from China amounted to around US$ 1 billion in 2001 compared to
around US$ 0.8 billion of exports by Taiwan and US$ 0.03 billion by India. India’s exports
are mainly to the African and South Asian nations. Also, a major portion of India’s bicycle
exports comprises standards due to the similar consumer demographics. Hero plans to
increase India’s presence in the high-end segment through its recent tie-up with Japan's
National Bicycle Industries whereby it will produce high-end bicycles.


Segments within the Indian Bicycle Industry
The Indian bicycle market comprises two segments: “standards” and “specials”. Standards
are the workhorses of the rural economy. These cheap and rugged bicycles have remained
unchanged for decades. The specials or “fancy” segment comprises new generation bicycles,
which are more expensive. Differentiation is the name of the game here.

Specials Out-pacing Standards: Standards, which accounted for over 90% of the market in
the early1990s today account for only 66% of cycle sales in the country. This is mainly
because:

A new class of bicycles called juveniles, which are categorized in the specials segment, have
over-taken the standards. The juvenile is, in effect, a standard bicycle with a more urban look,
which is targetted at the rural and semi-urban youth. Its popularity can be gauged from the
fact that while standard bicycles registered a compound annual growth rate (CAGR) of 2.7%
between 1996-97 and 2001-02, juveniles raced ahead at 12.6% in the same period.

Manufacturers have also increasingly attempted to wean away consumers to the specials
segment through greater marketing push and by attractively pricing specials. This has, to an
extent, hurt standard sales in semi-urban areas.

Higher disposable income levels of the middle and lower middle class in urban and semi-
urban areas have led to higher specials sales.


                                                 8
To some extent, standards sales have also been affected by the irregular monsoons in recent
years since rural incomes are dependent on the monsoons and standards are predominantly
sold in the semi-urban and rural areas. In the last six years, standards achieved double digit
growth (12%) in just one year, 1999-2000, due to unusually large purchases by the state
governments of Gujarat and Andhra Pradesh for free distribution.


Kids Segment
The kids segment constitutes 6.4% of the total market share of bicycles.As per estimates, the
proportion of those going in for standardised bicycles has come down from 90-95 per cent to
50-55 per cent in the last five-10 years. The consumer segment that is speedily getting bigger
comprises kids. This brings relief to cycle-makers as the affordability range is higher and
there is more scope for innovations.


The available bikes from China are mostly for kids, in sizes up to 18 inches. These bikes
come with attractive designs as well as features. For instance, Indian companies have just
recently launched battery-operated cycles but Chinese companies had offered them much
earlier. Local markets still have battery-operated bikes from China for children.


                                               9
Even as their designs and colourful appearance remain a plus point, a quick survey by The
Tribune revealed that many local manufacturers or dealers import bikes from China and sell
these under their own label.


Since people do not have much faith in Chinese cycles using our Indian labels, we are able to
sell them. They look quite attractive — a factor that attracts kids.The pricing too came in the
way of China capturing this market. Owing to heavy duties, the difference in the pricing of
Indian and Chinese bikes remained small.


Indian Bicycle Industry - Manufacturing

Ludhiana is the hub for bicycle manufacturing in India. “More than 25,000 cycles per day are
manufactured in Ludhiana alone. The city is home to over 1,500 factories making bicycles
and components, providing employment to 0.25 million people and today it is a jewel in the
crown of India’s industrial cities,” according to the All India Cycle Manufacturers’
Association.

At present. there are five major units in organized sector. accounting for 80% of the total
production of bicycles. The total production of bicycles was of the tune of 15.018 million
units in 2000-01 as compared to 37.000 units produced just after Independence Annual
production of bicycles since 1991- small units in the non-organized sector are also accounting
for a limited production of bicycles


                                               10
Government policies
Budget 2012 -13

The Budget has proposed an increase in basic excise duty from 10% to 12% and one to two%
on bicycles. Service tax has also been increased from 10-12%.


It has also raised import duty on bicycle and bicycle parts from 10% to 30% and 10% to 20%
respectively to save the local industry from the "dumping" of cheap bicycle and parts from
China.


                                             11
PORTER’S ANALYSIS FOR BICYCLE INDUSTRY


Rivalry among Existing Competitors

          •   Main competitors include Hero Cycles, Firefox, Atlas Cycles
          •   It has long history and established significant market size
          •   Increasing rivalry expected as more firms enter the attractive market (both
              domestic and foreign import)


Threat of New Entrants

          •   Expectation of long term demand for bicycles for kids segment remain strong
          •   However, increased competition into the market from imports from the China
              makes it less profitable for new entrants


Threat of Substitutes

          •   Kids Bicycles are common and range in prices
          •   Different styles and makes are widely available through many outlets
          •   Alternative recreational equipment widely available

                                             12
Bargaining Power of Buyers

         •   Buyers demand depends on discretionary income for recreational equipment
         •   Variety of distribution channels
         •   Higher income households comprises a major portion of the market
         •   Buyers demand depends on level of real disposable income and health of
             household


Bargaining Power of Suppliers

         •   Primary Assembly unit is located in Ludhiana so the supplies of raw materials
             in assembling the cycles take less time.


                                            13
COMPANY DETAILS


Mission

To provide the eco friendly mode of transport that is based on the needs of customers
Our mission is to build the best service model that is based on the needs of the customers
which aim at providing best services to customers with accountability and achieves maximum
customer satisfaction.


Vision

       •   To be the largest retail service provider in northern India in next 10 years.
       •   To provide holistic solutions to customers needs.
       •   To incorporate a technology to create best services experience for the customers.
       •   To bring consolidation and standardization in the Bicycle industry


Keys to Success

We believe our keys to success will be:
       •   Knowledge, Understanding and Expertise of the sector.

       •   Price Competitiveness, Quick Decision Making and Understanding Customer
           requirements to the last detail.

       •   Educating the customers and being holistic centre for fulfillment of their needs.

       •   Assigning the non-core work to an experienced and qualified third-party
           contractors and sub-contractors.

Legal Status
Eterno Cycle will be registered as separate legal entity by registering as private limited
company.

       •


                                               14
About Promoters


                                 MARKET ANALYSIS
SWOT ANALYSIS

Strengths

The Indian bicycle industry is almost entirely self-sufficient, with more than 95% of bicycle
components supplied from domestic sources. It also obtains most of its raw materials, such as
steel tubes, from within the country.


· It concentrates on producing a simple, cheap, and rather old-fashioned roadster model. The
could be seen as a deliberate attempt to satisfy the basic transportation needs of the less
affluent segment of the population. The industry is capable of producing roadster model at
highly competitive Price.


· It has made minimal use of foreign technology, creating or adapting most of the technology
it employs and emphasizing labour-intensive production techniques.


· Although it procures a substantial volume of its components from a large number of small
producers, final production is strongly concentrated.


· More than 90% of its exports are directed towards other developing countries where the
basic transportation needs of large numbers of less affluent people are far from being
satisfied.


· India has been eminently successful in entering into joint venture and licensing agreements
for the production of bicycles and components in many developing countries. This
breakthrough might be attributed to the fact that India offers a technology appropriate to the
needs of many developing countries.


· The domestic market is far from saturated. The replacement market alone is likely to
generate annual sales of 3 million bicycles in the near future, The leisure market is just

                                               15
beginning to be tapped.


· Highly skilled entrepreneurial community capable of adapting to any environment with
remarkable resilience.


· Low labour cost and reasonable quality/price mix, This becomes crucial as in low end
segment buyer looking for reliable quality at affordable price, cost accounts for 80% to 90%
of competitiveness.


· Concentration of industry in Ludhiana makes it possible to benefit from collective efficiency
arising out of pool of skills availability, specialized suppliers and attracting buyers besides
possibilities of joint action to undertake collective facility like customs clearance.


· Large numbers of supplier at same place have been instrumental in low cost infrastructure
and jus-in time deliveries.


· The small/tiny units in bicycle parts industry have mastered the art of manufacturing a
comprehensive range components which are sturdy, reliable for both OEM and replacement
market.


· Industry has evolved a system of using efficient and simple technologies. The close
integration of manufacturers of degeral parts has ensured that each and every portion of the
basic raw material e.g., steel is used-waste generated in one activity becomes input for some
other part. Besides minimizing the waste, this has resulted in better price utilization.


· Indian bicycle industry has achieved a certain level of product quality standard under
competitive price parameters, which makes imports of comparable Chinese, or other foreign
made products uneconomical at present. An elaborate system of dealers/sub dealers has been
set up over the years. These dealers assemble the bicycles making it possible for companies
to dispatch cycle units in CKD form and save on cost. Such an arrangement is difficult to
duplicate and given the popularity of Indian brands and lack of any well-known international
brand of bicycle in that price category acts as a significant entry barrier for imports from
other low cost countries like China. With the availability of spare parts all over the country at
very reasonable prices, it will be difficult for any foreign player to match that advantage.

                                                16
· Some of the units have developed technological, capabilities and quality reputation to be a
global sourcing center. For instance, Continental AG of Germany will source its tyre
requirements for global market from Metro Tyres in Ludhiana.


· Many of the Cycle entrepreneurs are aware of the emerging global challenges and are in the
process of leveraging and upgrading their units by undertaking value addition, instituting cost
cutting measures and setting up websites.


· The United Cycles & Parts Manufacturing Association (UCPMA) is organizing a virtual
exhibition on Internet as a part of its upgradation mission. The online exhibition will also
feature a virtual buyer-seller meet.


Weaknesses


· The Indian share in the global bicycle business is around one percent, this too is in the low
cost and low quality products. For producing higher end bicycle for global and domestic
market, there is need for overall improvement in vendor base as well as in the basic
infrastructure and resolution of logistic issues.


· The Indian Industry, however, recognizes that the quality of its bicycles has to be improved
in order to increase its competitiveness in foreign markets. Upgradation of technology and
quality has to b3 built in every part, every dimension of bicycle within this context,
opportunities for foreign collaboration exists, although mainly for the production of certain
types of components.


· The basic mechanical skill of entrepreneurs is better suited to copy/adapt rather than
develop new technologies. There is a need to provide technological support in the form of
developing and making available superior technologies through innovative R&D efforts.


· Due to lack of development of new models and use of better and lightweight material such
as Aluminium alloy, India is left behind in developed markets, which are largest importers of
bicycle and components.


                                                17
· There are too many tiny units, most of them nut and bolt shops operating with low-end
obsolete machinery resulting in deterioration of the components.


· Inelegant design and unattractive retailing


· Lack of expert mechanics with dealers to assemble CKD kits following all quality norms.


· Lack of technical, design and financial support from larger units for upgrading vendors
especially at the lower end.


· Shortage of working capital and lack of funds to meet just in time norms of assemblers.


· Except for about 150 units excluding larger units, other small/tiny units do not have
computer facilities and this digital divide can further exclude them from emerging
possibilities of e-commerce


· It is unlikely that SMEs will collaborate in product development since each firm will see
this as a specific competitive advantage. This explains the secretive nature of small units and
lackluster performance of various e-commerce initiatives.


Opportunities


· Enormous potential to operate in a global market, though challenges of quality, cost delivery
are equally large.


· Germany will source its tyre requirements for global market from Metro Tyres in Ludhiana.
Many of the Cycle entrepreneurs are aware or the emerging global challenges and are in the
process of leveraging and upgrading their units by undertaking value addition, instituting cost
cutting measures and setting up websites.


· The United Cycle & Parts Manufacturing Association (UCPMA) is organizing a virtual
exhibition on Internet as a part of its upgradation mission. The online exhibition will also
feather a virtual buyer-seller meet.

                                                18
Threats

Increased competition from foreign producers especially China, which competes on the basis
of lower costs of production.

Fluctuating demands as a result of economical changes.The specials would be majorly
affected , as they are priced higher.


Competitor Analysis

The domestic bicycle industry is oligopolistic in nature, dominated as it is by three organized
players: Hero Cycles Limited (Hero), Tube Investments of India Limited (TI) and Atlas
Cycles (Haryana) Limited (Atlas). These players account for over 90% of the country’s total
bicycle sales. Fringe players include Avon Cycles and Hamilton.

While TI is the clear market leader in the specials segment, Hero, which is also the largest
bicycle producer in the world, is a clear leader in the standards and in the overall domestic
market. As TI has the largest presence in specials, and as this segment has registered the
fastest growth in recent years, TI’s volumes have recorded the highest growth.

Although Hero has a large base of standard bicycles, it has achieved moderate, albeit,
consistent growth through its strong focus on increasing its specials volumes. Of the three
majors, Atlas is the most dependent on standards. Hence, its volumes have faced the greatest
pressure in the current environment. The ongoing dispute in the promoter family over the
division of the company’s assets has further added to Atlas’s woes


                                              19
Market Share of Major players


                                20
Sales over the years


According to industry estimates, the bicycle market in India is 14 million units a year, of
which 5-7% belongs to the premium segment, growing at 25-30% annually. Firefox is one of
them,which has a manufacturing facility in Sri Lanka from where the bicycles are imported.
The Trek products are imported from China and the US. While the Firefox range is priced
between Rs 4,000 and Rs 18,000, the Trek's bicycles are priced at Rs 20,000-85,000. Firefox
Bikes claim that they plan to capture 2.5-5% of the total bicycle market in India by growing
at the rate of 40% per year.

Survey Analysis
A questionnaire was prepared and asked to the parents & students. The objective of the
questionnaire was to understand the consumer’s purchasing behaviour in bicycles. A total of
160 respondents were recorded for initial study. Stratified Random Sampling was used and
the survey was conducted in Delhi- NCR region.


                                               21
Purpose of visit to Kid's Bicycle Store


                               Purpose of visit to Kid's Bicycle Store
              60                                                                55
              50                                               45
              40          32
                                            28
              30
              20
              10
               0
                    Buying a New      Checking out the    Buying Bicycle   For Services
                       Bicycle         latest models       Accessories


55 out of 160 respondents had stated that they visited the Kid’s Bicycle Store for some repair
or service work. 45 respondents had stated that they used to visit the kid’s bicycle Outlet to
purchase accessories. 32 out of respondents had stated that they used to go to the kid’s
bicycle store to buy a new bicycle.

USPs Determining Purchase Decision


                               USPs Determining Purchase Behaviour
                    60          48
                                          35                     32
                    40                               25                    20
                    20
                      0
                           Features      Price     Safety  Colour of After Sales
                                                  Aspects the Bicycle Service


The survey results indicated that 48 out of 160 respondents had considered Bicycle Features
as one of the key factor in determining the Consumer Purchase. These features included the
Rim Size, Chain Wheel, Bike frame, Bike Fork, Crank, Fly wheel etc. 35 out of 160
respondents had considered price as one of the key factors that determines the consumer
purchase behaviour. 32 respondents had also considered colour of the bicycle as one of the
distinguishing factors that aided in their purchase decisions. Although Safety aspects are


                                                   22
important, only 25 respondents had considered it as one of the main factor in determining the
purchase behaviour. The focus of the consumers was mostly on the features of the bicycle.


Preferred Amount to be spend on Kid’s Bicycle


                           Preferred Amount to be spend on Kid's Bicycle
           70                                           63
           60
                                        47
           50
           40             28
           30
           20                                                      12            10
           10
            0
                 Rs 1000-1200 Rs 1200-1500        Rs 1500-1750 Rs 1750-2000 More Than Rs
                                                                               2000


63 respondents had preferred to spend around Rs 1500 to 1750 on a kid’s bicycle. 47 out of
160 respondents had preferred to spend around Rs 1200-1500 on a kid’s bicycle. As it is
evident from the survey, majority of the consumers had preferred to spend in the bracket of
Rs 1200 to Rs 1750.


Customization in Bicycles


                                 Favours Customisation in Bicycles

           Cant Say                          30

                No                                     40

                Yes                                                               90

                      0            20             40          60          80           100


                                                    23
90 out of 160 respondents were in favour of the customization in their bicycles. These
customizations were mostly in the rim size, size of wheel and other basic features of bicycles.
However, the consumers also complained that it was very difficult to get the customization
from the outlets owners.


Online Purchase of Bicycles
                    Online Purchase of Bicycles

  Cant Say                     35

       No                            40

       Yes                                                85

             0       20         40        60         80        100


85 out of 160 respondents surveyed stated that they favour online purchase of bicycles. The
respondents were in favour of the online purchase because they believed that it was easy to
get customization in the bicycles through online purchase.


                                               24
OPERATIONS
Technical Requirements
The business involves the sourcing of bicycle parts from various suppliers and semi
assembling them in a plant location in Ludhiana. The then semi assembled bicycle would be
packed into boxes there and would be sent to Delhi for supply in various locations. Based on
the requirements of the retailers as well as other players, the bicycles will either be sent as a
box or would be assembled fully at the location in Delhi before it is sent. Locations have been
chosen strategically to reap the benefits of being closer to the suppliers in Ludhiana and close
to the customers in Delhi. A facility of 500 sq. yds. In Ludhiana and 200 sq. yds. In Delhi is
needed and will be taken up on lease basis with 3 months of the rent provided as security. In
Ludhiana the rent would be around Rs. 50000/ month and in Delhi it would be around Rs.
30000/ month.

A website will be needed for promoting and selling the bicycles online. The e-portal
construction will cost around Rs. 300000 and its maintenance cost would be Rs. 60000/ year.
The e-portal will list various bicycles along with their technical features and would also
display the MRP price for the bicycle. Also online payment feature would be provided by
tying up with the service providers like CCAvenue for collection of the online payment.
Another option of Cash on Delivery (COD) will also be provided since many of the users are
apprehensive of making payments through debit/credit card.

The division of whole cost will be like:

   1. Fixed Costs
   2. Variable Costs

The Fixed costs for manufacturing and operations would include:
       One time website creation charges.
       Yearly charges for website maintenance.
       Stationary expenses related to invoicing of products to retailers / direct customers.
       Advertising expenses for print ads circulated via local daily newspapers/ comics or
       magazines for kids/ promotion in schools, etc.
       Salary and wages: including the Rs. 108000 paid to the two promoters in a quarter,
       and semi assembling the cycles in Ludhiana plant at a labour cost of Rs. 8000/ month/
       worker.

                                               25
Rent of Rs. 80000/ month for two locations, one in Delhi and other in Ludhiana.
       Operating expenses including Rs. 25000/ month for two persons sales and marketing.

The Variable costs for manufacturing and operations include:
       Cost of the components that would be sourced from the suppliers.
       Cost of the material used for packing at Rs. 30/ cycle.
       Cost of transportation including both from Ludhiana Warehouse to Delhi Warehouse
       and from Delhi Warehouse to the Retailers/ Customers. The amount would beRs. 25
       from Ludhiana to Delhi and Rs. 20 from Delhi to retailer / Rs. 200 in direct selling.
       Cost of assembling the cycle completely at Delhi Warehouse for some of the
       customers and retailers. Its cost will be around Rs. 30/ cycle.

Operations Strategy
The operations of the company would be based on two selling models.

Through retailers
In the first year almost 80-90% of the sales will be done through this model. It involves
finding the perspective clients in terms of retailers in a particular locality and pitching to him
to buy the cycles from us. A salesman will go out in the market and search for retailers who
are selling cycles at their counters and present them with the models and prices of our cycles
and would pitch them to buy it. An order for some cycles will be taken from him and a credit
period for the goods will be provided after the cycles reach him. As soon as the payment is
made fully, the next order if any will be processed. So it will remain on a single bill system
policy. The order taken from the retailer will be sent to the company for processing and next
customer will be searched for.

E-Portal
The second model will constitute about 10-20% sales of the company and will include
placement of the orders online via an e-portal. The customer will visit the website and see
various models which are available. The customer will then choose the model he/ she likes
and click on buy button. Then the details including name, address, mobile no. etc will be
taken from them and various payment options will be given including COD, CC, DC etc. The
details of the order will reach the company and the delivery of the order will be made within
5-7 days. A confirmation of order by telephone in case of COD will be done before the
delivery is made.


                                               26
The model describes the process of billing the customer online


Flow of supply chain:
   1. The supply chain consists of the components provider, who on our need basis will
       provide the components to us and we will get a credit period of 8 days in the
       beginning.
   2. Then inventory of the parts would be of around 10 days and the cycles will assembled
       daily at the plant.
   3. The packed cycles will be booked to a transporter on contractual basis and would be
       shipped to Delhi Warehouse.
   4. Depending on the orders for cycles, a tempo/ three wheeler goods vehicle will be used
       to supply the cycles to either retailers or the customers directly.
   5. The payment is collected from the Retailers within 45days of the supply of the cycles
       and directly from the end consumers.


                                               27
MARKETING STRATEGY

Our Marketing Strategy:


  1. Understand our Customer

     As Peter Drucker has said, Marketing is all about knowing your customer. Therefore,
     understanding their requirements and making them understand the benefits of our
     product is the heart and soul of our marketing strategy. In order to develop a clear
     picture of our target customer we will use market research and analysis tools. In our
     case the consumers are the kids and the customers are the parents.

  2. Analyse the Market

     Some basic market research should allow us to find market data such as total available
     market, market growth (historical numbers and projections), market trends, etc.

  3. Analyse the Competition

     While designing a marketing strategy we have to ask ourselves what other choices our
     target customers have to gratify their needs. Researching and assessing the strengths
     and weaknesses of each is, therefore, must. We face competition from some well
     established brands like Hero, Atlas and Firefox and thus designing a unique and
     attention grabbing marketing strategy becomes a vital part for the sustenance of the
     company.

  4. Research Distribution Channels


                                           28
What is the best way to deliver our product or service to our target customers? This
        will impact our sales strategy and our financials, as well as our marketing mix.In
        addition to exploiting the existing distribution channels, we are looking into the
        feasibility of an e-portal for direct distribution.

    5. Define Your Marketing Mix

        Product, Price, Place and Promotion, the 4Ps of marketing are the keys to defining a
        proper marketing mix. By pricing our cycles to give us a competitive edge and
        promoting not only in traditional manner but using internet and other mass media
        techniques, we are aiming at an optimum marketing mix of these 4Ps.

    6. Analyse the Financials

        Finance is the base of any organisation. Without proper financial analysis, feasibility
        checks etc. a company cannot run. Thus, putting together our marketing budget and
        evaluating projected marketing ROI, customer acquisition costs, etc. is important.

    7. Review and Revise

        Continuously evaluating the effectiveness of our marketing strategy, and revision is
        necessary to maintain optimum efficiency.

Branding:
Logo

Logo is a graphic mark or emblem commonly to aid and promote instant public recognition.
In our case, as our tag line says “We are passionate about kids & environment”, our logo
represents a cycle and green colour has been used the signify the importance of environment.


Marketing Mix:
Product:
In the first year of operation we would be launching cycles for kids up to the age of 9 years. We will
have special bicycle ranges for boys (superhero series) and girls (bubbles series). Superhero series


                                                  29
will have Batman Black, Spiderman Red, Hulk green etc and bubbles series will have bubble red,
bubble blue and bubble green etc.


                                                                                       Customization
options in terms of colors, seats etc. would be made available.

By the third year we plan to extend our offerings to adults as well through our ranges – Outdoor fun
(Adventure Series), For racers (Pace series) and for city riding (Joy series).


Price:
Our strategy is to be cost leaders in the bicycle business but we won’t be compromising on quality
and our prices would be the best prices available in the market.

Place:
Initially our target market would be concentrated in northern India especially Ludhiana and Delhi.
We would be selling our bicycles through retailers and through our online portal. Amongst the
retailers our main targets would be exclusive multi brand cycle stores, sports good stores etc.

Promotion:
Since our budget is limited we will go for cost effective promotion strategy.

Advertise for free by word of mouth

Word of mouth is the best way to advertise for free. Word of mouth advertising depends on
reliability of the brand and for that quality is must. There are two ways to promote your business by
word of mouth:

                                                  30
Get others to talk about - The best way to do this is to surpass customers’ expectations. This
        may include free gifts with each product, taking feedback from customers using our product
        etc. Another way to get people talking is to provide extra information like information about
        the history of our business. Other methods include:
             o Sending thank-you, birthday and seasonal cards
             o Offering special sales for loyal customers.
             o Handling customer complaints quickly and to their satisfaction
             o Being professional and respectful to all customers
             o Offer discount coupons in fliers
             o Offer free evaluations or consultations.
             o Giving free T-Shirts having company’s logo and name with our products.
        Talk about yourself. (explained in detail)

Press Release

A well written press release is an excellent way to make the public aware of our product or
company. We can submit a press release to local and national newspapers, radio, television,
magazines and trade publications both online and off. Making our press release attention grabbing,
truthful and newsworthy to get an editor’s attention is necessary. For best results focus of the
articles should be on a targeted audience instead of a wide readership.

Print Media

        Advertising in local free shopper magazines.
        Distribution of fliers through newspapers etc.

Sponsor contests

Another way to receive free advertising is to offer to sponsor a contest for a community event or
large publicationCommunity Involvement can be done in many ways:

        Having a "happening" -- contests, parties or picnics for our customers.
        Givingcycles or service donations to a charity auction.
        Givingfree talks to community groups on the health benefits of cycling.
        Running booths at local fairs.
        Attend local businessgroups' meetings and business card exchanges.

Radio Advertising

Radio Advertising has many advantages:

        Radio is a universal medium enjoyed by people at one time or another during the day, at
        home, at work, and even in the car.
        The vast array of radio program formats offers to efficiently target our advertising money to
        narrowly defined segments of consumers most likely to respond to our offer.
        Gives our business personality through the creation of campaigns using sounds and voices
        Free creative help is often available
        Rates can generally be negotiated
        During the past ten years, radio rates have seen less inflation than those for other media


                                                  31
Fig. Pricing of radio advertisements

Radio marketing would be used intensively in the initial phase to provide momentum for word of
mouth marketing. We would normally go for Super Prime time slot and would aim at advertising
continuously for the first week and then monthly.

Local Television:

Advantages of Television advertising:

           Television permits us to reach large numbers of people on a national or regional level in a
           short period of time
           Independent stations and cable offer new opportunities to pinpoint local audiences
           Television being an image-building and visual medium, it offers the ability to convey our
           message with sight, sound and motion

Pricing:

                         Day                                                  Price
                Monday to Saturday                                 Rs 1000-1500 per 10 sec
                     Sunday                                        Rs 2000-2500 per 10 sec


We would go for local television marketing from 2nd year onwards as budget constraints do not allow
us to use it in the first year. We would distribute advertisements in the ratio of 2:1 for weekdays and
Sunday respectively.

Mailing Lists

The internet has hundreds of thousands of mailing list that we can subscribe to and sell your product
or service. Even if the list group does not allow you to sell your product, it is common practice to
have a 6-8 line "signature line" that is automatically put at the bottom of all outgoing messages, e-
mail responses and forwarding e-mails. It is easy to find specific mailing lists like biking groups etc.

Mobile Marketing:

                                                     32
We would send SMS to retailers to advertise our products and various schemes.

Social Media:

Social media sites are great for building customer relationship and offer an incredible reach and the
opportunity to connect with customers in an entirely new way. They also offer a wide reach, with its
potential for viral marketing and traffic generated can be extremely targeted. Moreover, Social
media tools are relatively inexpensive.

        Facebook: With millions of members with most being young and thus our potential
        customers, Facebook is must to advertise about our products. Easiest way is to create a
        Facebook page of the company and constantly update it with all the events and new
        products.
        Twitter: Twitter is yet another social media tool which can be used for protmotion of our
        products. Our company can make an account and people can follow it to know about the
        latest happenings in the company.

Website:

        E-portal - Our website will host an e-portal for dealing directly with customers and to cater
        to people who want to buy bicycles online. It will provide customization options and 360
        degree view of final selection. Users will have the option to pay online or opt for Cash on
        Delivery.
        Blog – Another section of the website will incorporate a blog which will provide bicycle
        enthusiasts to communicate with each other, share their experiences and offer help to
        newbies.


.


                                                  33
FINANCIAL PROJECTIONS

Assumptions & Facts Used in Financial Projections:


We have taken few assumptions & facts for the Financial Projections. These assumptions &
facts are based on the current market scenario.

   1) The selling price for retailers will be Rs 1200 in the first year increasing to Rs.1600,
       Rs. 1900 & Rs. 1900 in the next three years respectively. This is because of the
       increase in the component cost.
   2) But the selling price through online portal will be bit higher. The reasons for this are
       the different customized services provided by us. This will be cheaper as compared
       with the retailer price to the customers.
   3) The Component cost forms around 77% of the total cost whereas the remaining 23%
       is composed of packing & transportation.
   4) The total cost to us in the first year will be Rs. 1000 (925 + 30 +25 + 20).In the
       second year the cost to us is expected to increase due to surge in the component
       prices.
   5) The other expenses include Advertisements & Stationary which is around 1% of the
       cost to retailer.
   6) The total annual rent expenses at both the places (Ludhiana + Delhi) are summed up
       to Rs. 9,60,000.
   7) The fixed assets are depreciated at the rate of 10% per year.
   8) Our online portal needs maintenance which costs us Rs. 60,000 per year.
   9) The Interest rate on working capital Loan & Loan from relatives is 15% p.a.
   10) The tax is calculated on the rate 38.5%.


               Table 1: Assumptions & Facts Used for Financial Projections

       Unit price for retailers                     1200    1600    1900     1900
       Unit price through online                    1500    2000    2300     2300
       Component cost/ cycle                        925     1200    1475     1475
       Packing/ cycle                               30      30      30       30
       Transportation from Ludhiana to
       Delhi                                        25      25      25       25
       Transportation from Delhi to retailer        20      20      20       20
       Direct Selling                               200     200     200      200
       Final Assembly @ Delhi/ cycle                30      30      30       30
       Website Maintenance Charges                  60000   60000   60000    60000
       Stationary Expenses/ cycle                   2       2       2        2
       Advertising Overheads/ cycle                 8       8       8        8
       Salary

                                               34
Operation Expenses                           25000    25000    25000      25000
        Rent Expenses at Ludhiana                    600000   600000   600000     600000
        Rent Expenses at Delhi                       360000   360000   360000     360000
        Depreciation (% of gross Block)              10       10       10         10
        Interest (%)                                 15       15       15         15
        Tax (%)                                      38.5     38.5     38.5       38.5


Financial Statements:

   1) Balance Sheet
   2) Income Statement
   3) Cash Flow Statement


Analysis of Balance Sheet (Normal Scenario)
(Refer: annexure)
The balance sheet includes Application of Funds & Sources of Funds.

Application of Funds:
  1) Fixed Assets
  2) Current Assets

Fixed Assets

       The fixed Assets comprises of:
              Sales Tax Security Deposit
              Website Creation
              Plant and Machinery
              Car & Bikes
              Mobiles
              Office furniture

The fixed assets values Rs. 20, 50, 000 initially. It is 53% of total assets at the inception of
the business.

But its value remained only 36% at the end of 1st year and 19% in the 2nd year.

The reason for the decrease in the fixed assets is the increase in the current assets.

Our business is basically dependent more on the working capital as we rely on outsourcing &
assembling components. Our credit policy is such that increases our working capital to a
large extent.

Current Assets

       The Current Assets includes:
                                                35
1) Component
        2) Cash in Hand
        3) Sundry Debtors

Components:

The components are outsourced from Ludhiana local suppliers. Initially the inventory in hand
is 10 days in the first year. But second year onwards we started to optimize our resources by
JIT approach. The inventory days are 8 days & 5 days respectively in the second & third year
respectively.

Cash in Hand:

The cash / bank balances initially are around 9 lakhs. But at the end of first year cash
balances will be around Rs. 1 lakh. But it increases after that as we receive the account
receivables in the 2nd year onwards.

Sundry Debtors:

The credit policy for the retailers is 45 days. Because of it the accounts receivable increases
by huge amount. It sums up to around Rs. 19 lakhs at the end of 1st year.

Total Assets

At the inception of the business total assets is Rs. 39 lakhs. It is projected that it will grow up
to Rs. 51 lakhs at the end of first year & Rs. 82 lakhs at the end of 2nd year.

Sources of Funds:
The sources of Fund include:

   1)   Current Liability
   2)   Working Capital Loan
   3)   Loan from relatives
   4)   Equity

Current Liabilities:

The Current Liability includes Sundry Creditors.

Initially the credit policy for suppliers is 8 days. But due increase in trust & credit worthiness
the credit policy will increase to 20 days. This will help us to decrease the cash conversion
cycle.

Working Capital Loan:

The WC will play the most important role in the carrying out the business.

The working capital requirement in the initial two years is very crucial.

The working capital margin for each year calculated as:

                                                36
Working Capital Margin = 60% of Components & Sundry Debtors.

We expect from bankers about 60% of components & Sundry Debtors.

In the year 1, WC loan required will be around Rs. 14 lakhs which is just less than the
Working Capital Margin.

In the year 2, WC loan will increase to Rs. 20 lakhs in the 3rd quarter of the 2nd year. But our
cash in hand increases and loan repayment is expected from the 4th quarter of 2nd year.

At the end of 2nd year it will be around Rs. 14 lakhs and at the end of 3rd year all the WC
Loan will be repaid.

Loan From relatives:

In the first year due to cash crunch and more working capital requirement short term loan
from relatives will be required.

The interest rate on the loan will be 15% p.a.

The loan requirement for the first year of operation is expected to rise up to Rs. 6.5 lakhs.

The loan will be repaid by the end of the 2nd quarter of the 2nd year of operation.

Equity:

There are 6 promoters of the business and they will raise Rs. 6.5 lakhs each. The total equity
raised amounts to Rs. 39 lakhs.

The promoters will benefit from year 3 quarterly. The dividend in the 3rd quarter of 3rd year is
expected to rise up to Rs. 5 lakhs. In the 4th year it is expected to pay Rs. 9 lakhs per quarter
to the promoters.

Analysis of Income Statement (Normal Scenario)
(Refer: annexure)

Sales Revenues:

There are two modes of sales. They are

   1) Selling via Retailers
   2) E-commerce

Initially in the first year the contribution expected from the former mode is 90% of total sales
revenue whereas the remaining sales revenue is from E-commerce mode.

Here is the Figure 1 showing the projected sales every year. The sales are increasing year by
year. Our number of cycles produced per day increases from 25 initially to 50 at the end of
first year. The Figure 2 shows the projected number of cycles produced every day on
quarterly basis.


                                                 37
Expected Sales Year Wise
                                                      25000000
                                                      20000000
                                                      15000000
                                                      10000000
                                   sales in Rs.


                                                                                                      No. of Cycles/Day
                                                       5000000
                                                                                                      Sales*
                                                             0   Quarter 1
                                                                 Quarter 3

                                                                             Quarter 2
                                                                             Quarter 4
                                                                             Quarter 1
                                                                             Quarter 3

                                                                                          Quarter 2
                                                                                          Quarter 4
                                             Figure 1: Expected Sales year wise in INR (Normal Scenario)

                                                                      No. of Cycles/Day Assembled
                                       120
           No. of Cycles per day


                                       100
                                             80
                                             60
                                                                                                          No. of Cycles/Day
                                             40
                                             20
                                                  0
                                                           Q2 Q4 Q5 Q7            Q10 Q12 Q13 Q15


                                                      Figure 2 : No. of cycles assembled per day every quarter
Variable Cost

The variable cost includes:

   1)   Components Cost
   2)   Packing
   3)   Transportation
   4)   Assembling

   The average component cost per cycle during the first year is expected to be Rs. 925. This
   increases to Rs. 1200 in the 2nd year. This is because we will be coming with other
   models of adults apart from kids segment. This will increase our average cost of
   components.
   The average packing cost is Rs. 30 per cycle.
   Transportation cost: The transportation expenses increases from first year to 2nd year.
   This is because of cost of home delivery as our share of E-commerce will increase.

                                                                                   38
Assembling: It includes final assembling at Delhi. It will cost Rs. 30 per cycle.

Expected Profit

   The profit expected in the first year is negative. The profit will be on increasing trend.
   In the second year the expected profit is around Rs. 17 lakhs. But in the 3rd& 4th year of
   business it is expected to increase to around Rs. 33 lakhs.

                                                                             Expected Profit After Taxes
                                                         6000000
                                                         5000000
                                                         4000000
                                         Profit in Rs.


                                                         3000000
                                                         2000000
                                                         1000000
                                                               0
                                                                    Year 1


                                                                                                             Year 4
                                                                                     Year 2


                                                         -1000000                                   Year 3
                                                         -2000000


                                                          Figure 3: Expected Profit after Taxes on yearly basis


Cash Flow Statement
(Refer: annexure)

Closing Cash Balance:

We as an organization would like to keep an optimum level of cash balances i.e. Rs. 2 lakhs.

                                                                                 Closing Balance

                                        3500000
          Closing Cash Balance in Rs.


                                        3000000
                                        2500000
                                        2000000
                                        1500000
                                        1000000
                                        500000
                                                          0


                                                                                              39
Figure 4 : Closing Cash Balances at each quarter.
Initially due to cash crunch & high working capital, the closing balance is low. The optimum
cash balance for our organization is Rs. 12 lakhs.

Net Operating Cash Flow:

The Cash Flow from operations is expected to be negative in the first year. But second year
onwards it started increasing.

                                                               Net OperatingCash Flow
                                   1000000
         Net operating CF in Rs.


                                    500000

                                         0
                                                                   Q5
                                               Q1
                                                    Q2
                                                         Q3
                                                              Q4


                                                                        Q6
                                                                             Q7
                                                                                  Q8
                                                                                       Q9
                                                                                            Q10
                                                                                                  Q11
                                                                                                        Q12
                                                                                                              Q13
                                                                                                                    Q14
                                                                                                                          Q15
                                                                                                                                Q16
                                    -500000

                                   -1000000

                                   -1500000

                                     Figure 5: Expected Net Operating Cash Flow for each quarters.

BREAKEVEN ANALYSIS
(Refer: annexure)
According to the projections, our businesses will break-even in the fifth quarter of our
 business operation.Our fixed cost keeps on increasing but on other hand our E-commerce
 business is also expected to increase. This will increase the contribution margin in the 2nd&
 3rd year.

 Because of it we will be achieving the break-even in the start of the 2nd year.

 Contribution Margin = Selling Price – Variable price

 In the first year the contribution margin is equal to Rs. 182 which is about 17% of the
  variable cost.

 In the second year the contribution margin is equal to Rs. 361 which is about 26% of the
  variable cost. The margin is almost double the margin of the 1st year but due to increase in
  the average cost of components it is only 26%.

 In the first year, the expected lag in the break even quantity is around 5100 units of
  bicycles. But in the second year the break even quantity mark is lead by around 13000
  units. Our business is expected to grow in the second year of its inception.


                                                                                  40
SCENARIO ANALYSIS
Scenario analysis is a process of analyzing possible future events by considering alternative
possible outcomes. Here we are considering three scenarios based on the market demand.

Scenario 1
(Refer: annexure)
During normal market condition we are assuming that we are able to manufacture and sell
100 bicycles by the end of second operating year (2014-15), by gradually increasing the sales
from 25 bicycles per day during first quarter of first operating year (2013-14). Detailed
Balance Sheet, Profit Loss Statement and Cash Flow statement are given in Annexure.

                                Table 2: Balance Sheet Scenario 1

       Year                             2013-14       2014-15   2015-16     2016-17
       No. of Cycles/Day                   50          100          100       100
       Application of Funds (la)
       Fixed Assets (la)
       Other Fixed Asset                  7.00         7.00         7.00     7.00
       Net Block                          18.45        16.40        14.35    12.30
       Current Assets                     25.74        60.00        69.20    70.45
       Total Assets (la)                  51.19        83.40        90.55    89.75


       Sources of Funds (la)
       Current Liabilities                3.70         24.00        29.50    29.50
       WC Loan                            14.00        14.00
       Loan from Relatives                6.50
       Owners Fund (Equity +P/L)          26.99        45.40        61.05    60.25
       Total Liabilities (la)             51.19        83.40        90.55    89.75


It can be seen from the balance sheet that owners fund has been reduced to close to 27 lakhs
by the end of first year due to cash losses during first year of operations, but it starts
increasing after first year. We will be start paying dividend to the owners from year 3
onwards to increase our profitability on asset and owners equity. We will be paying INR
8,50,000/ quarter as dividend from third quarter of year three onwards.


                                                 41
Scenario 2
(Refer: annexure)
In this scenario we are expecting higher demand from market than the normal. We are
assuming that we are able to manufacture and sell 150 bicycles by the end of second
operating year (2014-15), by gradually increasing the sales from 30 bicycles per day during
first quarter of first operating year (2013-14). Detailed Balance Sheet, Profit Loss Statement
and Cash Flow statement are given in Annexure.

                                Table 3: Balance Sheet Scenario 2

       Year                             2013-14       2014-15   2015-16      2016-17
       No. of Cycles/Day                   100         150           150      150
       Application of Funds (la)
       Fixed Assets (la)
       Other Fixed Assets                 7.00         7.00          7.00     7.00
       Net Block                          18.45        16.40        14.35     12.30
       Current Assets                     51.43        98.98        103.27   104.53
       Total Assets (la)                  76.88       122.38        124.62   123.83


       Sources of Funds (la)
       Current Liabilities                7.40         36.00        44.25     44.25
       WC Loan                            29.00        10.00
       Loan from Relatives                6.50
       Owners Fund (Equity +P/L)          33.98        76.38        80.37     79.58
       Total Liabilities (la)             76.88       122.38        124.62   123.83


In an optimistic scenario we will be reaching 100 bicycles/ day by the end first year and will
be expanding to 150 cycles/ day by the end of second year. We will be start paying dividend
to the owners from year 3 onwards to increase our profitability on asset and owners equity.
We will be paying, INR 10,00,00 in the first quarter of year three and INR 15,00,000/ quarter
as dividend from second quarter of year three onwards.

Scenario 3
(Refer: annexure)


                                                 42
In this scenario we are expecting a lower demand from market than the normal. We are
assuming that we are able to manufacture and sell 75 bicycles by the end of second operating
year (2014-15), by gradually increasing the sales from 20 bicycles per day during first quarter
of first operating year (2013-14). Detailed Balance Sheet, Profit Loss Statement and Cash
Flow statement are given in Annexure.

                                Table 4: Balance Sheet Scenario 3

       Year                                  2013-14     2014-15    2015-16     2016-17
       No. of Cycles/Day                        40          75          75          75
       Application of Funds (la)
       Fixed Assets (la)
       Other Fixed Assets                         7.00       7.00        7.00        7.00
       Net Block                                18.45       16.40       14.35       12.30
       Current Assets                           20.48       47.21       52.72       53.41
       Total Assets (la)                        45.93       70.61       74.07       72.71


       Sources of Funds (la)
       Current Liabilities                        2.96      18.00       22.13       22.13
       WC Loan                                  11.00       15.00
       Loan from Relatives                        6.50
       Owners Fund (Equity +P/L)                25.47       37.61       51.95       50.59
       Total Liabilities (la)                   45.93       70.61       74.07       72.71


In a pessimistic projection we are expecting 75 bicycles /day. We will be paying INR
5,50,000/ quarter as dividend from fourth quarter of year three onwards.


FINANCIAL RATIO ANALYSIS
Financial ratios are useful indicators of a firm's performance and financial situation.

Liquidity Ratios

Liquidity ratios provide information about a firm's ability to meet its short-term financial
obligations. They are of particular interest to those extending short-term credit to the firm.

                                               43
Current ratio is defined as follows:


                                                        Current Assets
              Current Ratio =
                                                    Current Liabilities


The quick ratio (acid test ratio) is defined as follows:


                                               Current Assets - Inventory
               Quick Ratio =
                                                   Current Liabilities


Cash ratio is defined as follows:


                                              Cash + Marketable Securities
                          Cash Ratio =
                                                   Current Liabilities


Liquidity ratios of the company are given below for normal scenario (scenario 1):


                          Table 5: Liquidity ratios (Normal Scenario)

            Year                    2013-14         2014-15       2015-16    2016-17
            No. of
            Cycles/Day                 50               100         100       100
            Current Ratio              6.96             2.50        2.35      2.39
            Quick Ratio                5.40             2.19        2.10      2.14
            Cash Ratio                 0.29             0.09        0.07      0.11


                                                   44
Profitability Ratios

Profitability ratios offer several different measures of the success of the firm at generating
profits.

The gross profit margin is a measure of the gross profit earned on sales. The gross profit
margin considers the firm's cost of goods sold, but does not include other costs. It is defined
as follows:


                                                Sales - Cost of Goods Sold
               Gross Profit Margin =
                                                            Sales


Return on assets is a measure of how effectively the firm's assets are being used to generate
profits. It is defined as:


                                                        Net Income
                             Return on Assets =
                                                        Total Assets


Return on equity is the bottom line measure for the shareholders, measuring the profits
earned for each dollar invested in the firm's stock. Return on equity is defined as follows:


                                                        Net Income
                         Return on Equity =
                                                     Shareholder Equity

Liquidity ratios of the company are given below for normal scenario (scenario 1):

                             Table 6: Profitability Ratios (Scenario 1)

              Year                   2013-14     2014-15       2015-16      2016-17
              No. of Cycles/Day         50           100         100          100
              Gross Profit Margin     14%            18%         17%          17%
              Return on Asset          -5%           9%             9%        9%
              Return on Equity         -9%           19%         16%          16%

                                                45
WORKING CAPITAL FINANCING

We will be giving 45 days credit period for retailers and we will be expecting to receive raw
material from our supplier at a credit period of 8 days during first year and 20 days thereafter.
We will be planning to keep inventory for 10 days of operation during first year and will be
gradually reduced to 5 days by third year. Since the higher credit period to retailers our cash
flow will be limited during first two years of operation. In order to meet our short term
liabilities we will be opting for working capital financing from commercial bank at an interest
rate of 15% (Base rate +5). We are also expecting bank will be sanctioned working capital
loan upto 6o percentage of account receivables and raw materials. By considering this our
first year’s sanctioned working capital limit would be INR 14,79,600 and we will be using
INR 14,00,000 during first year . Since the account receivables are increasing due to increase
in sales for the following year, we are expecting bank will be raising our working capital
financing limit to INR 34.5 lakh in second year and approximately INR 40 lakhs during third
and fourth year. But we will be using working capital financing facilities only for the first
two years of operations. Summary of working capital utilization schedule is given below,
detailed working capital management schedule is given in annexure.


                             Table 7: Working Capital Financing

                                        2013-14     2014-15    2015-16     2016-17
             WC Financing
             Sanctioned                 1479600     3466500 4033500 4033500
             WC Loan Amount             1400000     1400000            0          0


                                               46
ANNEXURES


   47

Weitere ähnliche Inhalte

Was ist angesagt?

Busness plan, bicycle retailing
Busness plan, bicycle retailingBusness plan, bicycle retailing
Busness plan, bicycle retailingMustahid Ali
 
Marketing Project on Hybrid Bicycles in INDIA
Marketing Project on Hybrid Bicycles in INDIAMarketing Project on Hybrid Bicycles in INDIA
Marketing Project on Hybrid Bicycles in INDIASindoor Naik
 
Bajaj Production Planning and Control (PPC)
Bajaj Production Planning and Control (PPC)Bajaj Production Planning and Control (PPC)
Bajaj Production Planning and Control (PPC)SIDDHESH BAGWE
 
Harley Davidson Presentation
Harley Davidson PresentationHarley Davidson Presentation
Harley Davidson PresentationTess Maurici
 
Triangle Bike Share - Pitch Presentation
Triangle Bike Share - Pitch PresentationTriangle Bike Share - Pitch Presentation
Triangle Bike Share - Pitch PresentationJosh Bielick
 
product Branding Of Bajaj Pulsar Dt Si By-Amit Singh
product Branding Of Bajaj Pulsar Dt Si By-Amit Singhproduct Branding Of Bajaj Pulsar Dt Si By-Amit Singh
product Branding Of Bajaj Pulsar Dt Si By-Amit Singhamit_k102
 
Hero motocorp ltd full PPT
Hero motocorp ltd full PPTHero motocorp ltd full PPT
Hero motocorp ltd full PPTSushant N'kkr
 
A retail store study on Bata -by padmapriya IIPMB
 A retail store study on Bata -by padmapriya IIPMB A retail store study on Bata -by padmapriya IIPMB
A retail store study on Bata -by padmapriya IIPMBpadmapriya vedantam
 
Segmentation targeting and positioning of hero moto corp
Segmentation targeting and positioning of hero moto corpSegmentation targeting and positioning of hero moto corp
Segmentation targeting and positioning of hero moto corpPriyambadaKhushboo
 
marketing presentation + electric car
marketing presentation + electric carmarketing presentation + electric car
marketing presentation + electric carNanda Kishore
 
Marketing Strategy of Apollo Tyres
Marketing Strategy of Apollo TyresMarketing Strategy of Apollo Tyres
Marketing Strategy of Apollo TyresPrakhar Jain
 
Hero motocorp project report
Hero motocorp project reportHero motocorp project report
Hero motocorp project reportAbhishek Kumar MJ
 
Customer satisfaction on Hero Motocop Ltd after split with Honda
Customer satisfaction on Hero Motocop Ltd after split with Honda  Customer satisfaction on Hero Motocop Ltd after split with Honda
Customer satisfaction on Hero Motocop Ltd after split with Honda KPMG
 
Marketing plan for metro bikes company (group no.8)
Marketing plan for metro bikes company (group no.8)Marketing plan for metro bikes company (group no.8)
Marketing plan for metro bikes company (group no.8)Rohit Yadav
 
Wood land brand study
Wood land brand studyWood land brand study
Wood land brand studyKrishna Gupta
 
Business Plan on Bicycle
Business Plan on BicycleBusiness Plan on Bicycle
Business Plan on BicycleTAREK MAHMUD
 
PESTLE analysis................................Bajaj auto ltd
PESTLE analysis................................Bajaj auto ltdPESTLE analysis................................Bajaj auto ltd
PESTLE analysis................................Bajaj auto ltdNikita Bhatkar
 

Was ist angesagt? (20)

Hero moto corp
Hero moto corpHero moto corp
Hero moto corp
 
Busness plan, bicycle retailing
Busness plan, bicycle retailingBusness plan, bicycle retailing
Busness plan, bicycle retailing
 
Marketing Project on Hybrid Bicycles in INDIA
Marketing Project on Hybrid Bicycles in INDIAMarketing Project on Hybrid Bicycles in INDIA
Marketing Project on Hybrid Bicycles in INDIA
 
Bajaj Production Planning and Control (PPC)
Bajaj Production Planning and Control (PPC)Bajaj Production Planning and Control (PPC)
Bajaj Production Planning and Control (PPC)
 
Harley Davidson Presentation
Harley Davidson PresentationHarley Davidson Presentation
Harley Davidson Presentation
 
Triangle Bike Share - Pitch Presentation
Triangle Bike Share - Pitch PresentationTriangle Bike Share - Pitch Presentation
Triangle Bike Share - Pitch Presentation
 
product Branding Of Bajaj Pulsar Dt Si By-Amit Singh
product Branding Of Bajaj Pulsar Dt Si By-Amit Singhproduct Branding Of Bajaj Pulsar Dt Si By-Amit Singh
product Branding Of Bajaj Pulsar Dt Si By-Amit Singh
 
Hero motocorp ltd full PPT
Hero motocorp ltd full PPTHero motocorp ltd full PPT
Hero motocorp ltd full PPT
 
Questionnaire
QuestionnaireQuestionnaire
Questionnaire
 
A retail store study on Bata -by padmapriya IIPMB
 A retail store study on Bata -by padmapriya IIPMB A retail store study on Bata -by padmapriya IIPMB
A retail store study on Bata -by padmapriya IIPMB
 
Segmentation targeting and positioning of hero moto corp
Segmentation targeting and positioning of hero moto corpSegmentation targeting and positioning of hero moto corp
Segmentation targeting and positioning of hero moto corp
 
marketing presentation + electric car
marketing presentation + electric carmarketing presentation + electric car
marketing presentation + electric car
 
Marketing Strategy of Apollo Tyres
Marketing Strategy of Apollo TyresMarketing Strategy of Apollo Tyres
Marketing Strategy of Apollo Tyres
 
Hero motocorp project report
Hero motocorp project reportHero motocorp project report
Hero motocorp project report
 
Customer satisfaction on Hero Motocop Ltd after split with Honda
Customer satisfaction on Hero Motocop Ltd after split with Honda  Customer satisfaction on Hero Motocop Ltd after split with Honda
Customer satisfaction on Hero Motocop Ltd after split with Honda
 
PROJECT WORK ON TVS
PROJECT WORK ON TVSPROJECT WORK ON TVS
PROJECT WORK ON TVS
 
Marketing plan for metro bikes company (group no.8)
Marketing plan for metro bikes company (group no.8)Marketing plan for metro bikes company (group no.8)
Marketing plan for metro bikes company (group no.8)
 
Wood land brand study
Wood land brand studyWood land brand study
Wood land brand study
 
Business Plan on Bicycle
Business Plan on BicycleBusiness Plan on Bicycle
Business Plan on Bicycle
 
PESTLE analysis................................Bajaj auto ltd
PESTLE analysis................................Bajaj auto ltdPESTLE analysis................................Bajaj auto ltd
PESTLE analysis................................Bajaj auto ltd
 

Ähnlich wie Bicyle industry

researchreport_0521_dc_360_report_en_uk.pdf
researchreport_0521_dc_360_report_en_uk.pdfresearchreport_0521_dc_360_report_en_uk.pdf
researchreport_0521_dc_360_report_en_uk.pdfKhaled Naanaa
 
Supply Chain in eCommerce (2011-12)
Supply Chain in eCommerce (2011-12)Supply Chain in eCommerce (2011-12)
Supply Chain in eCommerce (2011-12)Akash Singh Thakur
 
2010 State of InBound Marketing
2010 State of InBound Marketing2010 State of InBound Marketing
2010 State of InBound MarketingDan St. Peter
 
State Of Inbound Marketing
State Of Inbound MarketingState Of Inbound Marketing
State Of Inbound MarketingCarla Dias
 
HubSpot: State Of Inbound Marketing
HubSpot: State Of Inbound MarketingHubSpot: State Of Inbound Marketing
HubSpot: State Of Inbound MarketingRyan Urban
 
State of inbound_marketing
State of inbound_marketingState of inbound_marketing
State of inbound_marketingkhibinite
 
Womens fashion vietnam
Womens fashion vietnamWomens fashion vietnam
Womens fashion vietnamalicia_obbi
 
Ovum the-future-of-e-commerce-the-road-to-2026
Ovum the-future-of-e-commerce-the-road-to-2026Ovum the-future-of-e-commerce-the-road-to-2026
Ovum the-future-of-e-commerce-the-road-to-2026Merve Kara
 
Entrepreneur final (1)
Entrepreneur final (1)Entrepreneur final (1)
Entrepreneur final (1)saad ali
 
Womens fashion singapore
Womens fashion singaporeWomens fashion singapore
Womens fashion singaporealicia_obbi
 
Ecommerce websites analysis
Ecommerce websites analysisEcommerce websites analysis
Ecommerce websites analysisMira Sakha
 
Entrepreneur final
Entrepreneur finalEntrepreneur final
Entrepreneur finalsaad ali
 
Bicycle Industry: Bicycle Spare Parts, Bicycle Components, Bicycle Accessorie...
Bicycle Industry: Bicycle Spare Parts, Bicycle Components, Bicycle Accessorie...Bicycle Industry: Bicycle Spare Parts, Bicycle Components, Bicycle Accessorie...
Bicycle Industry: Bicycle Spare Parts, Bicycle Components, Bicycle Accessorie...Ajjay Kumar Gupta
 
The Electric Vehicle Study 2010 by Zpryme Sponsored by Airbiquity [EV Consume...
The Electric Vehicle Study 2010 by Zpryme Sponsored by Airbiquity [EV Consume...The Electric Vehicle Study 2010 by Zpryme Sponsored by Airbiquity [EV Consume...
The Electric Vehicle Study 2010 by Zpryme Sponsored by Airbiquity [EV Consume...Zpryme Research & Consulting, LLC
 
2016 ASEAN Digital Revolution_ATK
2016 ASEAN Digital Revolution_ATK2016 ASEAN Digital Revolution_ATK
2016 ASEAN Digital Revolution_ATKJeffry Anwar Sani
 
Tourism Distribution in a Changed World
Tourism Distribution in a Changed WorldTourism Distribution in a Changed World
Tourism Distribution in a Changed WorldCaucaseastan
 
Beginers Guide To Seo
Beginers Guide To SeoBeginers Guide To Seo
Beginers Guide To SeoW.Peterson
 
Womens fashion indonesia
Womens fashion indonesiaWomens fashion indonesia
Womens fashion indonesiaalicia_obbi
 
10 Trends on Mobile
10 Trends on Mobile10 Trends on Mobile
10 Trends on MobileTable19
 

Ähnlich wie Bicyle industry (20)

researchreport_0521_dc_360_report_en_uk.pdf
researchreport_0521_dc_360_report_en_uk.pdfresearchreport_0521_dc_360_report_en_uk.pdf
researchreport_0521_dc_360_report_en_uk.pdf
 
Supply Chain in eCommerce (2011-12)
Supply Chain in eCommerce (2011-12)Supply Chain in eCommerce (2011-12)
Supply Chain in eCommerce (2011-12)
 
2010 State of InBound Marketing
2010 State of InBound Marketing2010 State of InBound Marketing
2010 State of InBound Marketing
 
State Of Inbound Marketing
State Of Inbound MarketingState Of Inbound Marketing
State Of Inbound Marketing
 
HubSpot: State Of Inbound Marketing
HubSpot: State Of Inbound MarketingHubSpot: State Of Inbound Marketing
HubSpot: State Of Inbound Marketing
 
State of inbound_marketing
State of inbound_marketingState of inbound_marketing
State of inbound_marketing
 
Womens fashion vietnam
Womens fashion vietnamWomens fashion vietnam
Womens fashion vietnam
 
Ovum the-future-of-e-commerce-the-road-to-2026
Ovum the-future-of-e-commerce-the-road-to-2026Ovum the-future-of-e-commerce-the-road-to-2026
Ovum the-future-of-e-commerce-the-road-to-2026
 
Entrepreneur final (1)
Entrepreneur final (1)Entrepreneur final (1)
Entrepreneur final (1)
 
Womens fashion singapore
Womens fashion singaporeWomens fashion singapore
Womens fashion singapore
 
Ecommerce websites analysis
Ecommerce websites analysisEcommerce websites analysis
Ecommerce websites analysis
 
Entrepreneur final
Entrepreneur finalEntrepreneur final
Entrepreneur final
 
Bicycle Industry: Bicycle Spare Parts, Bicycle Components, Bicycle Accessorie...
Bicycle Industry: Bicycle Spare Parts, Bicycle Components, Bicycle Accessorie...Bicycle Industry: Bicycle Spare Parts, Bicycle Components, Bicycle Accessorie...
Bicycle Industry: Bicycle Spare Parts, Bicycle Components, Bicycle Accessorie...
 
The Electric Vehicle Study 2010 by Zpryme Sponsored by Airbiquity [EV Consume...
The Electric Vehicle Study 2010 by Zpryme Sponsored by Airbiquity [EV Consume...The Electric Vehicle Study 2010 by Zpryme Sponsored by Airbiquity [EV Consume...
The Electric Vehicle Study 2010 by Zpryme Sponsored by Airbiquity [EV Consume...
 
2016 ASEAN Digital Revolution_ATK
2016 ASEAN Digital Revolution_ATK2016 ASEAN Digital Revolution_ATK
2016 ASEAN Digital Revolution_ATK
 
Tourism Distribution in a Changed World
Tourism Distribution in a Changed WorldTourism Distribution in a Changed World
Tourism Distribution in a Changed World
 
Beginers Guide To Seo
Beginers Guide To SeoBeginers Guide To Seo
Beginers Guide To Seo
 
Womens fashion indonesia
Womens fashion indonesiaWomens fashion indonesia
Womens fashion indonesia
 
10 Trends on Mobile
10 Trends on Mobile10 Trends on Mobile
10 Trends on Mobile
 
Xuhuong
XuhuongXuhuong
Xuhuong
 

Mehr von Ankit Agarwal

Avoiding callback hell in Node js using promises
Avoiding callback hell in Node js using promisesAvoiding callback hell in Node js using promises
Avoiding callback hell in Node js using promisesAnkit Agarwal
 
Product Innovation: An Effective Strategy To Penetrate Into Small Towns And ...
Product Innovation: An Effective Strategy To  Penetrate Into Small Towns And ...Product Innovation: An Effective Strategy To  Penetrate Into Small Towns And ...
Product Innovation: An Effective Strategy To Penetrate Into Small Towns And ...Ankit Agarwal
 
Private label report
Private label reportPrivate label report
Private label reportAnkit Agarwal
 
14 financial administration
14   financial administration14   financial administration
14 financial administrationAnkit Agarwal
 
10 personnel administration
10   personnel administration10   personnel administration
10 personnel administrationAnkit Agarwal
 
Food Processing Industry of India
Food Processing Industry of IndiaFood Processing Industry of India
Food Processing Industry of IndiaAnkit Agarwal
 
Marketing final version
Marketing final versionMarketing final version
Marketing final versionAnkit Agarwal
 
Food Processing Industry India
Food Processing Industry IndiaFood Processing Industry India
Food Processing Industry IndiaAnkit Agarwal
 
Healthcare industry ppt
Healthcare industry pptHealthcare industry ppt
Healthcare industry pptAnkit Agarwal
 

Mehr von Ankit Agarwal (17)

Avoiding callback hell in Node js using promises
Avoiding callback hell in Node js using promisesAvoiding callback hell in Node js using promises
Avoiding callback hell in Node js using promises
 
Product Innovation: An Effective Strategy To Penetrate Into Small Towns And ...
Product Innovation: An Effective Strategy To  Penetrate Into Small Towns And ...Product Innovation: An Effective Strategy To  Penetrate Into Small Towns And ...
Product Innovation: An Effective Strategy To Penetrate Into Small Towns And ...
 
Private label report
Private label reportPrivate label report
Private label report
 
Amul
AmulAmul
Amul
 
Fdi in retail
Fdi in retailFdi in retail
Fdi in retail
 
Sabtv
SabtvSabtv
Sabtv
 
14 financial administration
14   financial administration14   financial administration
14 financial administration
 
10 personnel administration
10   personnel administration10   personnel administration
10 personnel administration
 
5 public order
5   public order5   public order
5 public order
 
Security (finance)
Security (finance)Security (finance)
Security (finance)
 
Marico IT structure
Marico IT structureMarico IT structure
Marico IT structure
 
Marico IT structure
Marico IT structureMarico IT structure
Marico IT structure
 
Food Processing Industry of India
Food Processing Industry of IndiaFood Processing Industry of India
Food Processing Industry of India
 
Marketing final version
Marketing final versionMarketing final version
Marketing final version
 
Food Processing Industry India
Food Processing Industry IndiaFood Processing Industry India
Food Processing Industry India
 
Korea
KoreaKorea
Korea
 
Healthcare industry ppt
Healthcare industry pptHealthcare industry ppt
Healthcare industry ppt
 

Kürzlich hochgeladen

Call US-88OO1O2216 Call Girls In Mahipalpur Female Escort Service
Call US-88OO1O2216 Call Girls In Mahipalpur Female Escort ServiceCall US-88OO1O2216 Call Girls In Mahipalpur Female Escort Service
Call US-88OO1O2216 Call Girls In Mahipalpur Female Escort Servicecallgirls2057
 
Financial-Statement-Analysis-of-Coca-cola-Company.pptx
Financial-Statement-Analysis-of-Coca-cola-Company.pptxFinancial-Statement-Analysis-of-Coca-cola-Company.pptx
Financial-Statement-Analysis-of-Coca-cola-Company.pptxsaniyaimamuddin
 
Flow Your Strategy at Flight Levels Day 2024
Flow Your Strategy at Flight Levels Day 2024Flow Your Strategy at Flight Levels Day 2024
Flow Your Strategy at Flight Levels Day 2024Kirill Klimov
 
Darshan Hiranandani [News About Next CEO].pdf
Darshan Hiranandani [News About Next CEO].pdfDarshan Hiranandani [News About Next CEO].pdf
Darshan Hiranandani [News About Next CEO].pdfShashank Mehta
 
Unlocking the Future: Explore Web 3.0 Workshop to Start Earning Today!
Unlocking the Future: Explore Web 3.0 Workshop to Start Earning Today!Unlocking the Future: Explore Web 3.0 Workshop to Start Earning Today!
Unlocking the Future: Explore Web 3.0 Workshop to Start Earning Today!Doge Mining Website
 
1911 Gold Corporate Presentation Apr 2024.pdf
1911 Gold Corporate Presentation Apr 2024.pdf1911 Gold Corporate Presentation Apr 2024.pdf
1911 Gold Corporate Presentation Apr 2024.pdfShaun Heinrichs
 
Entrepreneurship lessons in Philippines
Entrepreneurship lessons in  PhilippinesEntrepreneurship lessons in  Philippines
Entrepreneurship lessons in PhilippinesDavidSamuel525586
 
Buy gmail accounts.pdf Buy Old Gmail Accounts
Buy gmail accounts.pdf Buy Old Gmail AccountsBuy gmail accounts.pdf Buy Old Gmail Accounts
Buy gmail accounts.pdf Buy Old Gmail AccountsBuy Verified Accounts
 
TriStar Gold Corporate Presentation - April 2024
TriStar Gold Corporate Presentation - April 2024TriStar Gold Corporate Presentation - April 2024
TriStar Gold Corporate Presentation - April 2024Adnet Communications
 
8447779800, Low rate Call girls in Dwarka mor Delhi NCR
8447779800, Low rate Call girls in Dwarka mor Delhi NCR8447779800, Low rate Call girls in Dwarka mor Delhi NCR
8447779800, Low rate Call girls in Dwarka mor Delhi NCRashishs7044
 
8447779800, Low rate Call girls in Kotla Mubarakpur Delhi NCR
8447779800, Low rate Call girls in Kotla Mubarakpur Delhi NCR8447779800, Low rate Call girls in Kotla Mubarakpur Delhi NCR
8447779800, Low rate Call girls in Kotla Mubarakpur Delhi NCRashishs7044
 
The-Ethical-issues-ghhhhhhhhjof-Byjus.pptx
The-Ethical-issues-ghhhhhhhhjof-Byjus.pptxThe-Ethical-issues-ghhhhhhhhjof-Byjus.pptx
The-Ethical-issues-ghhhhhhhhjof-Byjus.pptxmbikashkanyari
 
8447779800, Low rate Call girls in Saket Delhi NCR
8447779800, Low rate Call girls in Saket Delhi NCR8447779800, Low rate Call girls in Saket Delhi NCR
8447779800, Low rate Call girls in Saket Delhi NCRashishs7044
 
Kenya Coconut Production Presentation by Dr. Lalith Perera
Kenya Coconut Production Presentation by Dr. Lalith PereraKenya Coconut Production Presentation by Dr. Lalith Perera
Kenya Coconut Production Presentation by Dr. Lalith Pereraictsugar
 
APRIL2024_UKRAINE_xml_0000000000000 .pdf
APRIL2024_UKRAINE_xml_0000000000000 .pdfAPRIL2024_UKRAINE_xml_0000000000000 .pdf
APRIL2024_UKRAINE_xml_0000000000000 .pdfRbc Rbcua
 
NewBase 19 April 2024 Energy News issue - 1717 by Khaled Al Awadi.pdf
NewBase  19 April  2024  Energy News issue - 1717 by Khaled Al Awadi.pdfNewBase  19 April  2024  Energy News issue - 1717 by Khaled Al Awadi.pdf
NewBase 19 April 2024 Energy News issue - 1717 by Khaled Al Awadi.pdfKhaled Al Awadi
 
Cybersecurity Awareness Training Presentation v2024.03
Cybersecurity Awareness Training Presentation v2024.03Cybersecurity Awareness Training Presentation v2024.03
Cybersecurity Awareness Training Presentation v2024.03DallasHaselhorst
 

Kürzlich hochgeladen (20)

Call US-88OO1O2216 Call Girls In Mahipalpur Female Escort Service
Call US-88OO1O2216 Call Girls In Mahipalpur Female Escort ServiceCall US-88OO1O2216 Call Girls In Mahipalpur Female Escort Service
Call US-88OO1O2216 Call Girls In Mahipalpur Female Escort Service
 
Financial-Statement-Analysis-of-Coca-cola-Company.pptx
Financial-Statement-Analysis-of-Coca-cola-Company.pptxFinancial-Statement-Analysis-of-Coca-cola-Company.pptx
Financial-Statement-Analysis-of-Coca-cola-Company.pptx
 
Flow Your Strategy at Flight Levels Day 2024
Flow Your Strategy at Flight Levels Day 2024Flow Your Strategy at Flight Levels Day 2024
Flow Your Strategy at Flight Levels Day 2024
 
Japan IT Week 2024 Brochure by 47Billion (English)
Japan IT Week 2024 Brochure by 47Billion (English)Japan IT Week 2024 Brochure by 47Billion (English)
Japan IT Week 2024 Brochure by 47Billion (English)
 
Darshan Hiranandani [News About Next CEO].pdf
Darshan Hiranandani [News About Next CEO].pdfDarshan Hiranandani [News About Next CEO].pdf
Darshan Hiranandani [News About Next CEO].pdf
 
Unlocking the Future: Explore Web 3.0 Workshop to Start Earning Today!
Unlocking the Future: Explore Web 3.0 Workshop to Start Earning Today!Unlocking the Future: Explore Web 3.0 Workshop to Start Earning Today!
Unlocking the Future: Explore Web 3.0 Workshop to Start Earning Today!
 
1911 Gold Corporate Presentation Apr 2024.pdf
1911 Gold Corporate Presentation Apr 2024.pdf1911 Gold Corporate Presentation Apr 2024.pdf
1911 Gold Corporate Presentation Apr 2024.pdf
 
Entrepreneurship lessons in Philippines
Entrepreneurship lessons in  PhilippinesEntrepreneurship lessons in  Philippines
Entrepreneurship lessons in Philippines
 
Buy gmail accounts.pdf Buy Old Gmail Accounts
Buy gmail accounts.pdf Buy Old Gmail AccountsBuy gmail accounts.pdf Buy Old Gmail Accounts
Buy gmail accounts.pdf Buy Old Gmail Accounts
 
TriStar Gold Corporate Presentation - April 2024
TriStar Gold Corporate Presentation - April 2024TriStar Gold Corporate Presentation - April 2024
TriStar Gold Corporate Presentation - April 2024
 
8447779800, Low rate Call girls in Dwarka mor Delhi NCR
8447779800, Low rate Call girls in Dwarka mor Delhi NCR8447779800, Low rate Call girls in Dwarka mor Delhi NCR
8447779800, Low rate Call girls in Dwarka mor Delhi NCR
 
8447779800, Low rate Call girls in Kotla Mubarakpur Delhi NCR
8447779800, Low rate Call girls in Kotla Mubarakpur Delhi NCR8447779800, Low rate Call girls in Kotla Mubarakpur Delhi NCR
8447779800, Low rate Call girls in Kotla Mubarakpur Delhi NCR
 
The-Ethical-issues-ghhhhhhhhjof-Byjus.pptx
The-Ethical-issues-ghhhhhhhhjof-Byjus.pptxThe-Ethical-issues-ghhhhhhhhjof-Byjus.pptx
The-Ethical-issues-ghhhhhhhhjof-Byjus.pptx
 
8447779800, Low rate Call girls in Saket Delhi NCR
8447779800, Low rate Call girls in Saket Delhi NCR8447779800, Low rate Call girls in Saket Delhi NCR
8447779800, Low rate Call girls in Saket Delhi NCR
 
Kenya Coconut Production Presentation by Dr. Lalith Perera
Kenya Coconut Production Presentation by Dr. Lalith PereraKenya Coconut Production Presentation by Dr. Lalith Perera
Kenya Coconut Production Presentation by Dr. Lalith Perera
 
No-1 Call Girls In Goa 93193 VIP 73153 Escort service In North Goa Panaji, Ca...
No-1 Call Girls In Goa 93193 VIP 73153 Escort service In North Goa Panaji, Ca...No-1 Call Girls In Goa 93193 VIP 73153 Escort service In North Goa Panaji, Ca...
No-1 Call Girls In Goa 93193 VIP 73153 Escort service In North Goa Panaji, Ca...
 
APRIL2024_UKRAINE_xml_0000000000000 .pdf
APRIL2024_UKRAINE_xml_0000000000000 .pdfAPRIL2024_UKRAINE_xml_0000000000000 .pdf
APRIL2024_UKRAINE_xml_0000000000000 .pdf
 
NewBase 19 April 2024 Energy News issue - 1717 by Khaled Al Awadi.pdf
NewBase  19 April  2024  Energy News issue - 1717 by Khaled Al Awadi.pdfNewBase  19 April  2024  Energy News issue - 1717 by Khaled Al Awadi.pdf
NewBase 19 April 2024 Energy News issue - 1717 by Khaled Al Awadi.pdf
 
Cybersecurity Awareness Training Presentation v2024.03
Cybersecurity Awareness Training Presentation v2024.03Cybersecurity Awareness Training Presentation v2024.03
Cybersecurity Awareness Training Presentation v2024.03
 
Call Us ➥9319373153▻Call Girls In North Goa
Call Us ➥9319373153▻Call Girls In North GoaCall Us ➥9319373153▻Call Girls In North Goa
Call Us ➥9319373153▻Call Girls In North Goa
 

Bicyle industry

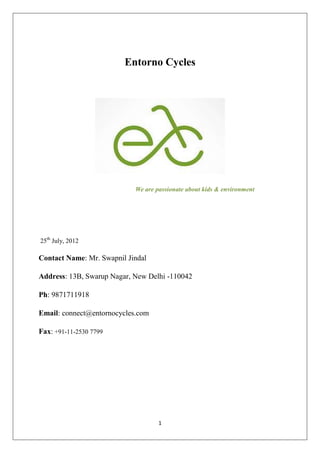
  • 1. Entorno Cycles We are passionate about kids & environment 25th July, 2012 1
  • 2. Executive Summary Indian Bicycle Industry is very large with India producing almost 10% of total Bicycle production of the world and exporting around $200 million of it. Out of the complete sales of bicycle, around 13% is constituted by the kids segment with CAGR (Compounded Annual Growth Rate) of around 20%. With many brands present in the bicycle industry, a new approach towards marketing is needed and also to penetrate competitive market cost competitiveness is required. The kids segment of bicycle is mostly unorganized with very few companies focussing on this quickly growing and lucrative section. Most of the parents who have higher purchasing power and less time to spend with their kids are mostly looking towards buying things online. This provides a good opportunity to provide various designs of hi quality kids bicycles online for the parents to buy and free them off of going to the market themselves as free home delivery is provided by the company. Also since many of the kids are very choosy and would like to customize the cycle with various models, designs and also different accessories, the online portal will provide a platform for the various people to come and select their unique cycle in terms of colour and accessories. Currently in the marketplace, a prospective customer usually goes out on their own to hunt for a bicycle either for themselves or for the kids. This usually involves dedicating some time and energy along with the money spent in transportation to and from the market and home respectively. Also transportation of the cycle to home is also a major problem. But with home delivery of the cycle along with customization of accessories and an option of Cash On Delivery with almost the same price as that with the retailer, this service provides an additional value that customer can drive out of the company. Although the online e-portal is a good way to enter the marketplace, the bulk sales in the beginning will have to be made by the retailer’s dealer network where both a discount and a credit period will have to be provided to the retailer to promote the sales. But in the long run it not only creates a valuable dealer network but also a loyal direct sales network with benefit of both the models. 2
  • 3. Contents BICYCLE INDUSTRY .................................................................................................................................. 5 Indian Bicycle Industry ........................................................................................................................ 5 Global Bicycle Industry........................................................................................................................ 6 Segments within the Indian Bicycle Industry ...................................................................................... 8 Kids Segment................................................................................................................................... 9 Indian Bicycle Industry - Manufacturing .......................................................................................... 10 Government policies ......................................................................................................................... 11 PORTER’S ANALYSIS FOR BICYCLE INDUSTRY.................................................................................... 12 COMPANY DETAILS ............................................................................................................................... 14 Mission .............................................................................................................................................. 14 Vision................................................................................................................................................. 14 Keys to Success ................................................................................................................................. 14 Legal Status ....................................................................................................................................... 14 About Promoters .............................................................................................................................. 15 MARKET ANALYSIS ................................................................................................................................ 15 SWOT ANALYSIS ................................................................................................................................ 15 Competitor Analysis .......................................................................................................................... 19 Market Share of Major players ........................................................................................................ 20 Sales over the years .......................................................................................................................... 21 Survey Analysis.................................................................................................................................. 21 Purpose of visit to Kid's Bicycle Store ............................................................................................... 22 USPs Determining Purchase Decision ............................................................................................... 22 Preferred Amount to be spend on Kid’s Bicycle ............................................................................... 23 Customization in Bicycles.................................................................................................................. 23 Online Purchase of Bicycles .............................................................................................................. 24 OPERATIONS ......................................................................................................................................... 25 Technical Requirements.................................................................................................................... 25 The Fixed costs for manufacturing and operations would include: .............................................. 25 The Variable costs for manufacturing and operations include:..................................................... 26 Operations Strategy ........................................................................................................................... 26 Through retailers ........................................................................................................................... 26 E-Portal ......................................................................................................................................... 26 The model describes the process of billing the customer online................................................... 27 3
  • 4. Flow of supply chain:........................................................................................................................ 27 MARKETING STRATEGY ......................................................................................................................... 28 Our Marketing Strategy: ................................................................................................................... 28 Branding: ........................................................................................................................................... 29 Logo ............................................................................................................................................... 29 Marketing Mix: .................................................................................................................................. 29 Product:......................................................................................................................................... 29 Price: ............................................................................................................................................. 30 Place: ............................................................................................................................................. 30 Promotion: .................................................................................................................................... 30 FINANCIAL PROJECTIONS ...................................................................................................................... 34 Assumptions & Facts Used in Financial Projections: ........................................................................ 34 Analysis of Balance Sheet (Normal Scenario) ................................................................................... 35 Application of Funds: ................................................................................................................... 35 Sources of Funds: .......................................................................................................................... 36 Analysis of Income Statement (Normal Scenario)............................................................................ 37 Cash Flow Statement ........................................................................................................................ 39 BREAKEVEN ANALYSIS ....................................................................................................................... 40 SCENARIO ANALYSIS ......................................................................................................................... 41 Scenario 1...................................................................................................................................... 41 Scenario 2...................................................................................................................................... 42 Scenario 3...................................................................................................................................... 42 FINANCIAL RATIO ANALYSIS .............................................................................................................. 43 Liquidity Ratios .............................................................................................................................. 43 Profitability Ratios ......................................................................................................................... 45 WORKING CAPITAL FINANCING ........................................................................................................ 46 ANNEXURES .......................................................................................................................................... 47 4
  • 5. BICYCLE INDUSTRY Indian Bicycle Industry The size of the Indian bicycle industry stands at US $1.2 billion. The number of units (finished bicycles including all segments) produced is around 12 million, according to an industry source. Of this, the number of units exported annually is about two to three million, which points to a huge demand in the domestic market. According to figures from the Engineering Exports Promotion Council, in 2007-08 India exported bicycles and components worth US $185.42 million. The market for the premium or the lifestyle bikes targeted towards the lifestyle consumer is just about emerging. The definition of high end bikes itself is changing. Earlier the high-end bikes were considered as those selling between Rs. 5000 to 8000. However now with global brands moving into the country this definition is also changing with price-points starting from Rs.15000 to as high as a few lakhs! The country today is on the threshold of globalisation and teaming million are looking for higher level of growth together with equitable distribution of income to improve their lots. Generally the economic signs appear to be favorable for the country to improve its performance and in turn improve the lot of its people. Obviously; this improvement is going to reflect upon the Bicycle Industry in particular and transport segment in general. With customers of the country aspiring for higher and higher the current Bicycles users will be graduating to auto two-wheelers, but there will be a new population looking to the bicycle as means of transport. Similarly a new generation of buyer will look to bicycle as a mean of leisure recreation and good way to keep fit. We, therefore, see a healthy sustained growth of cycle industry. Presuming that growth of last 3-4 years is sustained for next 10 years i.e. the time we reach the year 2010, the Indian bicycle industry would need to produce about 1.75 crore bicycles to plug the demand and supply gap. However, there will be a change in the demand pattern linked with consumer changing aspiration and choice giving way to latest technology and newer marketing concepts. Industry is already witnessing this to some extent. The new millennium has brought new challenge of opening up of import of Cycles. The 5
  • 6. manufacturers in India agree to the point that Indian Bicycle Industry does not foresee any problem as the product offered today by Indian manufacturers in the market are best suited to Indian conditions and are most economical and value for money products. On the whole the future for Indian industry including Bicycle will be challenging. The domestic market will be open to good and services from global companies with low tariffs. Protection will be a thing of the past. The companies that will survive will be those which successfully restructure and modernise to achieve global competitiveness in terms of both quality, cost and distribution system. Global Bicycle Industry The bicycle is an important means of transportation in most developing and under-developed countries like China, India and Vietnam. In the developed world, especially in the European and North American countries, however, bicycles encompass multiple functions from basic transportation to sports. Consequently, the bicycle’s utility varies depending on the region, nationality and level of economic development. Global economic prosperity and seasonal factors heavily influence the bicycle industry. Economic downturns affect bicycle demand as well. Moreover, traditionally, spring and autumn are peak seasons for bicycle sales worldwide. Therefore, manufacturers adjust their output accordingly in order to avoid excess inventory. China, with a population of around 1.2 billion, consumes 25-30 million bicycles a year and in addition, exports around 15 million units. USA and Japan, with an estimated population of 250 million and 125 million respectively, consume around 20 million and 7 million bicycles a year respectively. In contrast, India, with a population of 1 billion only consumes around 12 million bicycles a year, which indicates its low penetration levels. Global bicycle production, which is today estimated at approximately 100 million units per annum, has grown at a CAGR of 0.94% between 1990 and 2000. China, which is known as the kingdom of bicycles, is the world’s largest producer of bicycles and accounted for 52% of the world’s bicycle production in 2000, followed by India (11%), Taiwan (7%) and Japan (5%). 6
  • 7. China's bicycle industry comprises 1081 plants (including component makers) with a total capacity of around 70 million units. As a result of the prosperity in the home market in the late 1980s, production grew rapidly in the 1990s and a multitude of small assembly plants were set up. For the most part of the 1990s, however, production in China was volatile due to the changing domestic demand. China witnessed a spurt in production towards the end of the last decade as over 100 Taiwanese manufacturers shifted base to different Chinese cities because of the availability of cheap labour. USA, which was once among the top five global producers, has gradually lost market share as Chinese and Taiwanese products have flooded the US market. Of the approximately 19 million bicycles sold in the US market in 2001 (compared to 21 million in 2000), imports accounted for over 90% of the pie. USA, in fact, is the largest importer of bicycles and imports from China and Taiwan accounted for 75% and 15% of its total imports in 2001. The unit price of Chinese bicycles was lower at around US$ 41, however, compared to US$ 94 per unit for Taiwanese bicycles since the former are mainly traditional light bikes. The global trade in bicycles is estimated at around 30 million units, with Europe, North America and Japan accounting for around 70% of it. These markets are characterized by 7
  • 8. their large and steady demand and high retail prices. China exports around 25-30% of its bicycle production to Europe and USA. Chinese bicycle makers have secured a foothold in the high-end export markets due to their superior products, which use high-tech raw materials like titanium alloy, chrome-molybdenum alloy and carbon fibre. Europe is the largest destination for Taiwanese bicycles followed by USA. Overall, bicycle exports from China amounted to around US$ 1 billion in 2001 compared to around US$ 0.8 billion of exports by Taiwan and US$ 0.03 billion by India. India’s exports are mainly to the African and South Asian nations. Also, a major portion of India’s bicycle exports comprises standards due to the similar consumer demographics. Hero plans to increase India’s presence in the high-end segment through its recent tie-up with Japan's National Bicycle Industries whereby it will produce high-end bicycles. Segments within the Indian Bicycle Industry The Indian bicycle market comprises two segments: “standards” and “specials”. Standards are the workhorses of the rural economy. These cheap and rugged bicycles have remained unchanged for decades. The specials or “fancy” segment comprises new generation bicycles, which are more expensive. Differentiation is the name of the game here. Specials Out-pacing Standards: Standards, which accounted for over 90% of the market in the early1990s today account for only 66% of cycle sales in the country. This is mainly because: A new class of bicycles called juveniles, which are categorized in the specials segment, have over-taken the standards. The juvenile is, in effect, a standard bicycle with a more urban look, which is targetted at the rural and semi-urban youth. Its popularity can be gauged from the fact that while standard bicycles registered a compound annual growth rate (CAGR) of 2.7% between 1996-97 and 2001-02, juveniles raced ahead at 12.6% in the same period. Manufacturers have also increasingly attempted to wean away consumers to the specials segment through greater marketing push and by attractively pricing specials. This has, to an extent, hurt standard sales in semi-urban areas. Higher disposable income levels of the middle and lower middle class in urban and semi- urban areas have led to higher specials sales. 8
  • 9. To some extent, standards sales have also been affected by the irregular monsoons in recent years since rural incomes are dependent on the monsoons and standards are predominantly sold in the semi-urban and rural areas. In the last six years, standards achieved double digit growth (12%) in just one year, 1999-2000, due to unusually large purchases by the state governments of Gujarat and Andhra Pradesh for free distribution. Kids Segment The kids segment constitutes 6.4% of the total market share of bicycles.As per estimates, the proportion of those going in for standardised bicycles has come down from 90-95 per cent to 50-55 per cent in the last five-10 years. The consumer segment that is speedily getting bigger comprises kids. This brings relief to cycle-makers as the affordability range is higher and there is more scope for innovations. The available bikes from China are mostly for kids, in sizes up to 18 inches. These bikes come with attractive designs as well as features. For instance, Indian companies have just recently launched battery-operated cycles but Chinese companies had offered them much earlier. Local markets still have battery-operated bikes from China for children. 9
  • 10. Even as their designs and colourful appearance remain a plus point, a quick survey by The Tribune revealed that many local manufacturers or dealers import bikes from China and sell these under their own label. Since people do not have much faith in Chinese cycles using our Indian labels, we are able to sell them. They look quite attractive — a factor that attracts kids.The pricing too came in the way of China capturing this market. Owing to heavy duties, the difference in the pricing of Indian and Chinese bikes remained small. Indian Bicycle Industry - Manufacturing Ludhiana is the hub for bicycle manufacturing in India. “More than 25,000 cycles per day are manufactured in Ludhiana alone. The city is home to over 1,500 factories making bicycles and components, providing employment to 0.25 million people and today it is a jewel in the crown of India’s industrial cities,” according to the All India Cycle Manufacturers’ Association. At present. there are five major units in organized sector. accounting for 80% of the total production of bicycles. The total production of bicycles was of the tune of 15.018 million units in 2000-01 as compared to 37.000 units produced just after Independence Annual production of bicycles since 1991- small units in the non-organized sector are also accounting for a limited production of bicycles 10
  • 11. Government policies Budget 2012 -13 The Budget has proposed an increase in basic excise duty from 10% to 12% and one to two% on bicycles. Service tax has also been increased from 10-12%. It has also raised import duty on bicycle and bicycle parts from 10% to 30% and 10% to 20% respectively to save the local industry from the "dumping" of cheap bicycle and parts from China. 11
  • 12. PORTER’S ANALYSIS FOR BICYCLE INDUSTRY Rivalry among Existing Competitors • Main competitors include Hero Cycles, Firefox, Atlas Cycles • It has long history and established significant market size • Increasing rivalry expected as more firms enter the attractive market (both domestic and foreign import) Threat of New Entrants • Expectation of long term demand for bicycles for kids segment remain strong • However, increased competition into the market from imports from the China makes it less profitable for new entrants Threat of Substitutes • Kids Bicycles are common and range in prices • Different styles and makes are widely available through many outlets • Alternative recreational equipment widely available 12
  • 13. Bargaining Power of Buyers • Buyers demand depends on discretionary income for recreational equipment • Variety of distribution channels • Higher income households comprises a major portion of the market • Buyers demand depends on level of real disposable income and health of household Bargaining Power of Suppliers • Primary Assembly unit is located in Ludhiana so the supplies of raw materials in assembling the cycles take less time. 13
  • 14. COMPANY DETAILS Mission To provide the eco friendly mode of transport that is based on the needs of customers Our mission is to build the best service model that is based on the needs of the customers which aim at providing best services to customers with accountability and achieves maximum customer satisfaction. Vision • To be the largest retail service provider in northern India in next 10 years. • To provide holistic solutions to customers needs. • To incorporate a technology to create best services experience for the customers. • To bring consolidation and standardization in the Bicycle industry Keys to Success We believe our keys to success will be: • Knowledge, Understanding and Expertise of the sector. • Price Competitiveness, Quick Decision Making and Understanding Customer requirements to the last detail. • Educating the customers and being holistic centre for fulfillment of their needs. • Assigning the non-core work to an experienced and qualified third-party contractors and sub-contractors. Legal Status Eterno Cycle will be registered as separate legal entity by registering as private limited company. • 14
  • 15. About Promoters MARKET ANALYSIS SWOT ANALYSIS Strengths The Indian bicycle industry is almost entirely self-sufficient, with more than 95% of bicycle components supplied from domestic sources. It also obtains most of its raw materials, such as steel tubes, from within the country. · It concentrates on producing a simple, cheap, and rather old-fashioned roadster model. The could be seen as a deliberate attempt to satisfy the basic transportation needs of the less affluent segment of the population. The industry is capable of producing roadster model at highly competitive Price. · It has made minimal use of foreign technology, creating or adapting most of the technology it employs and emphasizing labour-intensive production techniques. · Although it procures a substantial volume of its components from a large number of small producers, final production is strongly concentrated. · More than 90% of its exports are directed towards other developing countries where the basic transportation needs of large numbers of less affluent people are far from being satisfied. · India has been eminently successful in entering into joint venture and licensing agreements for the production of bicycles and components in many developing countries. This breakthrough might be attributed to the fact that India offers a technology appropriate to the needs of many developing countries. · The domestic market is far from saturated. The replacement market alone is likely to generate annual sales of 3 million bicycles in the near future, The leisure market is just 15
  • 16. beginning to be tapped. · Highly skilled entrepreneurial community capable of adapting to any environment with remarkable resilience. · Low labour cost and reasonable quality/price mix, This becomes crucial as in low end segment buyer looking for reliable quality at affordable price, cost accounts for 80% to 90% of competitiveness. · Concentration of industry in Ludhiana makes it possible to benefit from collective efficiency arising out of pool of skills availability, specialized suppliers and attracting buyers besides possibilities of joint action to undertake collective facility like customs clearance. · Large numbers of supplier at same place have been instrumental in low cost infrastructure and jus-in time deliveries. · The small/tiny units in bicycle parts industry have mastered the art of manufacturing a comprehensive range components which are sturdy, reliable for both OEM and replacement market. · Industry has evolved a system of using efficient and simple technologies. The close integration of manufacturers of degeral parts has ensured that each and every portion of the basic raw material e.g., steel is used-waste generated in one activity becomes input for some other part. Besides minimizing the waste, this has resulted in better price utilization. · Indian bicycle industry has achieved a certain level of product quality standard under competitive price parameters, which makes imports of comparable Chinese, or other foreign made products uneconomical at present. An elaborate system of dealers/sub dealers has been set up over the years. These dealers assemble the bicycles making it possible for companies to dispatch cycle units in CKD form and save on cost. Such an arrangement is difficult to duplicate and given the popularity of Indian brands and lack of any well-known international brand of bicycle in that price category acts as a significant entry barrier for imports from other low cost countries like China. With the availability of spare parts all over the country at very reasonable prices, it will be difficult for any foreign player to match that advantage. 16
  • 17. · Some of the units have developed technological, capabilities and quality reputation to be a global sourcing center. For instance, Continental AG of Germany will source its tyre requirements for global market from Metro Tyres in Ludhiana. · Many of the Cycle entrepreneurs are aware of the emerging global challenges and are in the process of leveraging and upgrading their units by undertaking value addition, instituting cost cutting measures and setting up websites. · The United Cycles & Parts Manufacturing Association (UCPMA) is organizing a virtual exhibition on Internet as a part of its upgradation mission. The online exhibition will also feature a virtual buyer-seller meet. Weaknesses · The Indian share in the global bicycle business is around one percent, this too is in the low cost and low quality products. For producing higher end bicycle for global and domestic market, there is need for overall improvement in vendor base as well as in the basic infrastructure and resolution of logistic issues. · The Indian Industry, however, recognizes that the quality of its bicycles has to be improved in order to increase its competitiveness in foreign markets. Upgradation of technology and quality has to b3 built in every part, every dimension of bicycle within this context, opportunities for foreign collaboration exists, although mainly for the production of certain types of components. · The basic mechanical skill of entrepreneurs is better suited to copy/adapt rather than develop new technologies. There is a need to provide technological support in the form of developing and making available superior technologies through innovative R&D efforts. · Due to lack of development of new models and use of better and lightweight material such as Aluminium alloy, India is left behind in developed markets, which are largest importers of bicycle and components. 17
  • 18. · There are too many tiny units, most of them nut and bolt shops operating with low-end obsolete machinery resulting in deterioration of the components. · Inelegant design and unattractive retailing · Lack of expert mechanics with dealers to assemble CKD kits following all quality norms. · Lack of technical, design and financial support from larger units for upgrading vendors especially at the lower end. · Shortage of working capital and lack of funds to meet just in time norms of assemblers. · Except for about 150 units excluding larger units, other small/tiny units do not have computer facilities and this digital divide can further exclude them from emerging possibilities of e-commerce · It is unlikely that SMEs will collaborate in product development since each firm will see this as a specific competitive advantage. This explains the secretive nature of small units and lackluster performance of various e-commerce initiatives. Opportunities · Enormous potential to operate in a global market, though challenges of quality, cost delivery are equally large. · Germany will source its tyre requirements for global market from Metro Tyres in Ludhiana. Many of the Cycle entrepreneurs are aware or the emerging global challenges and are in the process of leveraging and upgrading their units by undertaking value addition, instituting cost cutting measures and setting up websites. · The United Cycle & Parts Manufacturing Association (UCPMA) is organizing a virtual exhibition on Internet as a part of its upgradation mission. The online exhibition will also feather a virtual buyer-seller meet. 18
  • 19. Threats Increased competition from foreign producers especially China, which competes on the basis of lower costs of production. Fluctuating demands as a result of economical changes.The specials would be majorly affected , as they are priced higher. Competitor Analysis The domestic bicycle industry is oligopolistic in nature, dominated as it is by three organized players: Hero Cycles Limited (Hero), Tube Investments of India Limited (TI) and Atlas Cycles (Haryana) Limited (Atlas). These players account for over 90% of the country’s total bicycle sales. Fringe players include Avon Cycles and Hamilton. While TI is the clear market leader in the specials segment, Hero, which is also the largest bicycle producer in the world, is a clear leader in the standards and in the overall domestic market. As TI has the largest presence in specials, and as this segment has registered the fastest growth in recent years, TI’s volumes have recorded the highest growth. Although Hero has a large base of standard bicycles, it has achieved moderate, albeit, consistent growth through its strong focus on increasing its specials volumes. Of the three majors, Atlas is the most dependent on standards. Hence, its volumes have faced the greatest pressure in the current environment. The ongoing dispute in the promoter family over the division of the company’s assets has further added to Atlas’s woes 19
  • 20. Market Share of Major players 20
  • 21. Sales over the years According to industry estimates, the bicycle market in India is 14 million units a year, of which 5-7% belongs to the premium segment, growing at 25-30% annually. Firefox is one of them,which has a manufacturing facility in Sri Lanka from where the bicycles are imported. The Trek products are imported from China and the US. While the Firefox range is priced between Rs 4,000 and Rs 18,000, the Trek's bicycles are priced at Rs 20,000-85,000. Firefox Bikes claim that they plan to capture 2.5-5% of the total bicycle market in India by growing at the rate of 40% per year. Survey Analysis A questionnaire was prepared and asked to the parents & students. The objective of the questionnaire was to understand the consumer’s purchasing behaviour in bicycles. A total of 160 respondents were recorded for initial study. Stratified Random Sampling was used and the survey was conducted in Delhi- NCR region. 21
  • 22. Purpose of visit to Kid's Bicycle Store Purpose of visit to Kid's Bicycle Store 60 55 50 45 40 32 28 30 20 10 0 Buying a New Checking out the Buying Bicycle For Services Bicycle latest models Accessories 55 out of 160 respondents had stated that they visited the Kid’s Bicycle Store for some repair or service work. 45 respondents had stated that they used to visit the kid’s bicycle Outlet to purchase accessories. 32 out of respondents had stated that they used to go to the kid’s bicycle store to buy a new bicycle. USPs Determining Purchase Decision USPs Determining Purchase Behaviour 60 48 35 32 40 25 20 20 0 Features Price Safety Colour of After Sales Aspects the Bicycle Service The survey results indicated that 48 out of 160 respondents had considered Bicycle Features as one of the key factor in determining the Consumer Purchase. These features included the Rim Size, Chain Wheel, Bike frame, Bike Fork, Crank, Fly wheel etc. 35 out of 160 respondents had considered price as one of the key factors that determines the consumer purchase behaviour. 32 respondents had also considered colour of the bicycle as one of the distinguishing factors that aided in their purchase decisions. Although Safety aspects are 22
  • 23. important, only 25 respondents had considered it as one of the main factor in determining the purchase behaviour. The focus of the consumers was mostly on the features of the bicycle. Preferred Amount to be spend on Kid’s Bicycle Preferred Amount to be spend on Kid's Bicycle 70 63 60 47 50 40 28 30 20 12 10 10 0 Rs 1000-1200 Rs 1200-1500 Rs 1500-1750 Rs 1750-2000 More Than Rs 2000 63 respondents had preferred to spend around Rs 1500 to 1750 on a kid’s bicycle. 47 out of 160 respondents had preferred to spend around Rs 1200-1500 on a kid’s bicycle. As it is evident from the survey, majority of the consumers had preferred to spend in the bracket of Rs 1200 to Rs 1750. Customization in Bicycles Favours Customisation in Bicycles Cant Say 30 No 40 Yes 90 0 20 40 60 80 100 23
  • 24. 90 out of 160 respondents were in favour of the customization in their bicycles. These customizations were mostly in the rim size, size of wheel and other basic features of bicycles. However, the consumers also complained that it was very difficult to get the customization from the outlets owners. Online Purchase of Bicycles Online Purchase of Bicycles Cant Say 35 No 40 Yes 85 0 20 40 60 80 100 85 out of 160 respondents surveyed stated that they favour online purchase of bicycles. The respondents were in favour of the online purchase because they believed that it was easy to get customization in the bicycles through online purchase. 24
  • 25. OPERATIONS Technical Requirements The business involves the sourcing of bicycle parts from various suppliers and semi assembling them in a plant location in Ludhiana. The then semi assembled bicycle would be packed into boxes there and would be sent to Delhi for supply in various locations. Based on the requirements of the retailers as well as other players, the bicycles will either be sent as a box or would be assembled fully at the location in Delhi before it is sent. Locations have been chosen strategically to reap the benefits of being closer to the suppliers in Ludhiana and close to the customers in Delhi. A facility of 500 sq. yds. In Ludhiana and 200 sq. yds. In Delhi is needed and will be taken up on lease basis with 3 months of the rent provided as security. In Ludhiana the rent would be around Rs. 50000/ month and in Delhi it would be around Rs. 30000/ month. A website will be needed for promoting and selling the bicycles online. The e-portal construction will cost around Rs. 300000 and its maintenance cost would be Rs. 60000/ year. The e-portal will list various bicycles along with their technical features and would also display the MRP price for the bicycle. Also online payment feature would be provided by tying up with the service providers like CCAvenue for collection of the online payment. Another option of Cash on Delivery (COD) will also be provided since many of the users are apprehensive of making payments through debit/credit card. The division of whole cost will be like: 1. Fixed Costs 2. Variable Costs The Fixed costs for manufacturing and operations would include: One time website creation charges. Yearly charges for website maintenance. Stationary expenses related to invoicing of products to retailers / direct customers. Advertising expenses for print ads circulated via local daily newspapers/ comics or magazines for kids/ promotion in schools, etc. Salary and wages: including the Rs. 108000 paid to the two promoters in a quarter, and semi assembling the cycles in Ludhiana plant at a labour cost of Rs. 8000/ month/ worker. 25
  • 26. Rent of Rs. 80000/ month for two locations, one in Delhi and other in Ludhiana. Operating expenses including Rs. 25000/ month for two persons sales and marketing. The Variable costs for manufacturing and operations include: Cost of the components that would be sourced from the suppliers. Cost of the material used for packing at Rs. 30/ cycle. Cost of transportation including both from Ludhiana Warehouse to Delhi Warehouse and from Delhi Warehouse to the Retailers/ Customers. The amount would beRs. 25 from Ludhiana to Delhi and Rs. 20 from Delhi to retailer / Rs. 200 in direct selling. Cost of assembling the cycle completely at Delhi Warehouse for some of the customers and retailers. Its cost will be around Rs. 30/ cycle. Operations Strategy The operations of the company would be based on two selling models. Through retailers In the first year almost 80-90% of the sales will be done through this model. It involves finding the perspective clients in terms of retailers in a particular locality and pitching to him to buy the cycles from us. A salesman will go out in the market and search for retailers who are selling cycles at their counters and present them with the models and prices of our cycles and would pitch them to buy it. An order for some cycles will be taken from him and a credit period for the goods will be provided after the cycles reach him. As soon as the payment is made fully, the next order if any will be processed. So it will remain on a single bill system policy. The order taken from the retailer will be sent to the company for processing and next customer will be searched for. E-Portal The second model will constitute about 10-20% sales of the company and will include placement of the orders online via an e-portal. The customer will visit the website and see various models which are available. The customer will then choose the model he/ she likes and click on buy button. Then the details including name, address, mobile no. etc will be taken from them and various payment options will be given including COD, CC, DC etc. The details of the order will reach the company and the delivery of the order will be made within 5-7 days. A confirmation of order by telephone in case of COD will be done before the delivery is made. 26
  • 27. The model describes the process of billing the customer online Flow of supply chain: 1. The supply chain consists of the components provider, who on our need basis will provide the components to us and we will get a credit period of 8 days in the beginning. 2. Then inventory of the parts would be of around 10 days and the cycles will assembled daily at the plant. 3. The packed cycles will be booked to a transporter on contractual basis and would be shipped to Delhi Warehouse. 4. Depending on the orders for cycles, a tempo/ three wheeler goods vehicle will be used to supply the cycles to either retailers or the customers directly. 5. The payment is collected from the Retailers within 45days of the supply of the cycles and directly from the end consumers. 27
  • 28. MARKETING STRATEGY Our Marketing Strategy: 1. Understand our Customer As Peter Drucker has said, Marketing is all about knowing your customer. Therefore, understanding their requirements and making them understand the benefits of our product is the heart and soul of our marketing strategy. In order to develop a clear picture of our target customer we will use market research and analysis tools. In our case the consumers are the kids and the customers are the parents. 2. Analyse the Market Some basic market research should allow us to find market data such as total available market, market growth (historical numbers and projections), market trends, etc. 3. Analyse the Competition While designing a marketing strategy we have to ask ourselves what other choices our target customers have to gratify their needs. Researching and assessing the strengths and weaknesses of each is, therefore, must. We face competition from some well established brands like Hero, Atlas and Firefox and thus designing a unique and attention grabbing marketing strategy becomes a vital part for the sustenance of the company. 4. Research Distribution Channels 28
  • 29. What is the best way to deliver our product or service to our target customers? This will impact our sales strategy and our financials, as well as our marketing mix.In addition to exploiting the existing distribution channels, we are looking into the feasibility of an e-portal for direct distribution. 5. Define Your Marketing Mix Product, Price, Place and Promotion, the 4Ps of marketing are the keys to defining a proper marketing mix. By pricing our cycles to give us a competitive edge and promoting not only in traditional manner but using internet and other mass media techniques, we are aiming at an optimum marketing mix of these 4Ps. 6. Analyse the Financials Finance is the base of any organisation. Without proper financial analysis, feasibility checks etc. a company cannot run. Thus, putting together our marketing budget and evaluating projected marketing ROI, customer acquisition costs, etc. is important. 7. Review and Revise Continuously evaluating the effectiveness of our marketing strategy, and revision is necessary to maintain optimum efficiency. Branding: Logo Logo is a graphic mark or emblem commonly to aid and promote instant public recognition. In our case, as our tag line says “We are passionate about kids & environment”, our logo represents a cycle and green colour has been used the signify the importance of environment. Marketing Mix: Product: In the first year of operation we would be launching cycles for kids up to the age of 9 years. We will have special bicycle ranges for boys (superhero series) and girls (bubbles series). Superhero series 29
  • 30. will have Batman Black, Spiderman Red, Hulk green etc and bubbles series will have bubble red, bubble blue and bubble green etc. Customization options in terms of colors, seats etc. would be made available. By the third year we plan to extend our offerings to adults as well through our ranges – Outdoor fun (Adventure Series), For racers (Pace series) and for city riding (Joy series). Price: Our strategy is to be cost leaders in the bicycle business but we won’t be compromising on quality and our prices would be the best prices available in the market. Place: Initially our target market would be concentrated in northern India especially Ludhiana and Delhi. We would be selling our bicycles through retailers and through our online portal. Amongst the retailers our main targets would be exclusive multi brand cycle stores, sports good stores etc. Promotion: Since our budget is limited we will go for cost effective promotion strategy. Advertise for free by word of mouth Word of mouth is the best way to advertise for free. Word of mouth advertising depends on reliability of the brand and for that quality is must. There are two ways to promote your business by word of mouth: 30
  • 31. Get others to talk about - The best way to do this is to surpass customers’ expectations. This may include free gifts with each product, taking feedback from customers using our product etc. Another way to get people talking is to provide extra information like information about the history of our business. Other methods include: o Sending thank-you, birthday and seasonal cards o Offering special sales for loyal customers. o Handling customer complaints quickly and to their satisfaction o Being professional and respectful to all customers o Offer discount coupons in fliers o Offer free evaluations or consultations. o Giving free T-Shirts having company’s logo and name with our products. Talk about yourself. (explained in detail) Press Release A well written press release is an excellent way to make the public aware of our product or company. We can submit a press release to local and national newspapers, radio, television, magazines and trade publications both online and off. Making our press release attention grabbing, truthful and newsworthy to get an editor’s attention is necessary. For best results focus of the articles should be on a targeted audience instead of a wide readership. Print Media Advertising in local free shopper magazines. Distribution of fliers through newspapers etc. Sponsor contests Another way to receive free advertising is to offer to sponsor a contest for a community event or large publicationCommunity Involvement can be done in many ways: Having a "happening" -- contests, parties or picnics for our customers. Givingcycles or service donations to a charity auction. Givingfree talks to community groups on the health benefits of cycling. Running booths at local fairs. Attend local businessgroups' meetings and business card exchanges. Radio Advertising Radio Advertising has many advantages: Radio is a universal medium enjoyed by people at one time or another during the day, at home, at work, and even in the car. The vast array of radio program formats offers to efficiently target our advertising money to narrowly defined segments of consumers most likely to respond to our offer. Gives our business personality through the creation of campaigns using sounds and voices Free creative help is often available Rates can generally be negotiated During the past ten years, radio rates have seen less inflation than those for other media 31
  • 32. Fig. Pricing of radio advertisements Radio marketing would be used intensively in the initial phase to provide momentum for word of mouth marketing. We would normally go for Super Prime time slot and would aim at advertising continuously for the first week and then monthly. Local Television: Advantages of Television advertising: Television permits us to reach large numbers of people on a national or regional level in a short period of time Independent stations and cable offer new opportunities to pinpoint local audiences Television being an image-building and visual medium, it offers the ability to convey our message with sight, sound and motion Pricing: Day Price Monday to Saturday Rs 1000-1500 per 10 sec Sunday Rs 2000-2500 per 10 sec We would go for local television marketing from 2nd year onwards as budget constraints do not allow us to use it in the first year. We would distribute advertisements in the ratio of 2:1 for weekdays and Sunday respectively. Mailing Lists The internet has hundreds of thousands of mailing list that we can subscribe to and sell your product or service. Even if the list group does not allow you to sell your product, it is common practice to have a 6-8 line "signature line" that is automatically put at the bottom of all outgoing messages, e- mail responses and forwarding e-mails. It is easy to find specific mailing lists like biking groups etc. Mobile Marketing: 32
  • 33. We would send SMS to retailers to advertise our products and various schemes. Social Media: Social media sites are great for building customer relationship and offer an incredible reach and the opportunity to connect with customers in an entirely new way. They also offer a wide reach, with its potential for viral marketing and traffic generated can be extremely targeted. Moreover, Social media tools are relatively inexpensive. Facebook: With millions of members with most being young and thus our potential customers, Facebook is must to advertise about our products. Easiest way is to create a Facebook page of the company and constantly update it with all the events and new products. Twitter: Twitter is yet another social media tool which can be used for protmotion of our products. Our company can make an account and people can follow it to know about the latest happenings in the company. Website: E-portal - Our website will host an e-portal for dealing directly with customers and to cater to people who want to buy bicycles online. It will provide customization options and 360 degree view of final selection. Users will have the option to pay online or opt for Cash on Delivery. Blog – Another section of the website will incorporate a blog which will provide bicycle enthusiasts to communicate with each other, share their experiences and offer help to newbies. . 33
  • 34. FINANCIAL PROJECTIONS Assumptions & Facts Used in Financial Projections: We have taken few assumptions & facts for the Financial Projections. These assumptions & facts are based on the current market scenario. 1) The selling price for retailers will be Rs 1200 in the first year increasing to Rs.1600, Rs. 1900 & Rs. 1900 in the next three years respectively. This is because of the increase in the component cost. 2) But the selling price through online portal will be bit higher. The reasons for this are the different customized services provided by us. This will be cheaper as compared with the retailer price to the customers. 3) The Component cost forms around 77% of the total cost whereas the remaining 23% is composed of packing & transportation. 4) The total cost to us in the first year will be Rs. 1000 (925 + 30 +25 + 20).In the second year the cost to us is expected to increase due to surge in the component prices. 5) The other expenses include Advertisements & Stationary which is around 1% of the cost to retailer. 6) The total annual rent expenses at both the places (Ludhiana + Delhi) are summed up to Rs. 9,60,000. 7) The fixed assets are depreciated at the rate of 10% per year. 8) Our online portal needs maintenance which costs us Rs. 60,000 per year. 9) The Interest rate on working capital Loan & Loan from relatives is 15% p.a. 10) The tax is calculated on the rate 38.5%. Table 1: Assumptions & Facts Used for Financial Projections Unit price for retailers 1200 1600 1900 1900 Unit price through online 1500 2000 2300 2300 Component cost/ cycle 925 1200 1475 1475 Packing/ cycle 30 30 30 30 Transportation from Ludhiana to Delhi 25 25 25 25 Transportation from Delhi to retailer 20 20 20 20 Direct Selling 200 200 200 200 Final Assembly @ Delhi/ cycle 30 30 30 30 Website Maintenance Charges 60000 60000 60000 60000 Stationary Expenses/ cycle 2 2 2 2 Advertising Overheads/ cycle 8 8 8 8 Salary 34
  • 35. Operation Expenses 25000 25000 25000 25000 Rent Expenses at Ludhiana 600000 600000 600000 600000 Rent Expenses at Delhi 360000 360000 360000 360000 Depreciation (% of gross Block) 10 10 10 10 Interest (%) 15 15 15 15 Tax (%) 38.5 38.5 38.5 38.5 Financial Statements: 1) Balance Sheet 2) Income Statement 3) Cash Flow Statement Analysis of Balance Sheet (Normal Scenario) (Refer: annexure) The balance sheet includes Application of Funds & Sources of Funds. Application of Funds: 1) Fixed Assets 2) Current Assets Fixed Assets The fixed Assets comprises of: Sales Tax Security Deposit Website Creation Plant and Machinery Car & Bikes Mobiles Office furniture The fixed assets values Rs. 20, 50, 000 initially. It is 53% of total assets at the inception of the business. But its value remained only 36% at the end of 1st year and 19% in the 2nd year. The reason for the decrease in the fixed assets is the increase in the current assets. Our business is basically dependent more on the working capital as we rely on outsourcing & assembling components. Our credit policy is such that increases our working capital to a large extent. Current Assets The Current Assets includes: 35
  • 36. 1) Component 2) Cash in Hand 3) Sundry Debtors Components: The components are outsourced from Ludhiana local suppliers. Initially the inventory in hand is 10 days in the first year. But second year onwards we started to optimize our resources by JIT approach. The inventory days are 8 days & 5 days respectively in the second & third year respectively. Cash in Hand: The cash / bank balances initially are around 9 lakhs. But at the end of first year cash balances will be around Rs. 1 lakh. But it increases after that as we receive the account receivables in the 2nd year onwards. Sundry Debtors: The credit policy for the retailers is 45 days. Because of it the accounts receivable increases by huge amount. It sums up to around Rs. 19 lakhs at the end of 1st year. Total Assets At the inception of the business total assets is Rs. 39 lakhs. It is projected that it will grow up to Rs. 51 lakhs at the end of first year & Rs. 82 lakhs at the end of 2nd year. Sources of Funds: The sources of Fund include: 1) Current Liability 2) Working Capital Loan 3) Loan from relatives 4) Equity Current Liabilities: The Current Liability includes Sundry Creditors. Initially the credit policy for suppliers is 8 days. But due increase in trust & credit worthiness the credit policy will increase to 20 days. This will help us to decrease the cash conversion cycle. Working Capital Loan: The WC will play the most important role in the carrying out the business. The working capital requirement in the initial two years is very crucial. The working capital margin for each year calculated as: 36
  • 37. Working Capital Margin = 60% of Components & Sundry Debtors. We expect from bankers about 60% of components & Sundry Debtors. In the year 1, WC loan required will be around Rs. 14 lakhs which is just less than the Working Capital Margin. In the year 2, WC loan will increase to Rs. 20 lakhs in the 3rd quarter of the 2nd year. But our cash in hand increases and loan repayment is expected from the 4th quarter of 2nd year. At the end of 2nd year it will be around Rs. 14 lakhs and at the end of 3rd year all the WC Loan will be repaid. Loan From relatives: In the first year due to cash crunch and more working capital requirement short term loan from relatives will be required. The interest rate on the loan will be 15% p.a. The loan requirement for the first year of operation is expected to rise up to Rs. 6.5 lakhs. The loan will be repaid by the end of the 2nd quarter of the 2nd year of operation. Equity: There are 6 promoters of the business and they will raise Rs. 6.5 lakhs each. The total equity raised amounts to Rs. 39 lakhs. The promoters will benefit from year 3 quarterly. The dividend in the 3rd quarter of 3rd year is expected to rise up to Rs. 5 lakhs. In the 4th year it is expected to pay Rs. 9 lakhs per quarter to the promoters. Analysis of Income Statement (Normal Scenario) (Refer: annexure) Sales Revenues: There are two modes of sales. They are 1) Selling via Retailers 2) E-commerce Initially in the first year the contribution expected from the former mode is 90% of total sales revenue whereas the remaining sales revenue is from E-commerce mode. Here is the Figure 1 showing the projected sales every year. The sales are increasing year by year. Our number of cycles produced per day increases from 25 initially to 50 at the end of first year. The Figure 2 shows the projected number of cycles produced every day on quarterly basis. 37
  • 38. Expected Sales Year Wise 25000000 20000000 15000000 10000000 sales in Rs. No. of Cycles/Day 5000000 Sales* 0 Quarter 1 Quarter 3 Quarter 2 Quarter 4 Quarter 1 Quarter 3 Quarter 2 Quarter 4 Figure 1: Expected Sales year wise in INR (Normal Scenario) No. of Cycles/Day Assembled 120 No. of Cycles per day 100 80 60 No. of Cycles/Day 40 20 0 Q2 Q4 Q5 Q7 Q10 Q12 Q13 Q15 Figure 2 : No. of cycles assembled per day every quarter Variable Cost The variable cost includes: 1) Components Cost 2) Packing 3) Transportation 4) Assembling The average component cost per cycle during the first year is expected to be Rs. 925. This increases to Rs. 1200 in the 2nd year. This is because we will be coming with other models of adults apart from kids segment. This will increase our average cost of components. The average packing cost is Rs. 30 per cycle. Transportation cost: The transportation expenses increases from first year to 2nd year. This is because of cost of home delivery as our share of E-commerce will increase. 38
  • 39. Assembling: It includes final assembling at Delhi. It will cost Rs. 30 per cycle. Expected Profit The profit expected in the first year is negative. The profit will be on increasing trend. In the second year the expected profit is around Rs. 17 lakhs. But in the 3rd& 4th year of business it is expected to increase to around Rs. 33 lakhs. Expected Profit After Taxes 6000000 5000000 4000000 Profit in Rs. 3000000 2000000 1000000 0 Year 1 Year 4 Year 2 -1000000 Year 3 -2000000 Figure 3: Expected Profit after Taxes on yearly basis Cash Flow Statement (Refer: annexure) Closing Cash Balance: We as an organization would like to keep an optimum level of cash balances i.e. Rs. 2 lakhs. Closing Balance 3500000 Closing Cash Balance in Rs. 3000000 2500000 2000000 1500000 1000000 500000 0 39
  • 40. Figure 4 : Closing Cash Balances at each quarter. Initially due to cash crunch & high working capital, the closing balance is low. The optimum cash balance for our organization is Rs. 12 lakhs. Net Operating Cash Flow: The Cash Flow from operations is expected to be negative in the first year. But second year onwards it started increasing. Net OperatingCash Flow 1000000 Net operating CF in Rs. 500000 0 Q5 Q1 Q2 Q3 Q4 Q6 Q7 Q8 Q9 Q10 Q11 Q12 Q13 Q14 Q15 Q16 -500000 -1000000 -1500000 Figure 5: Expected Net Operating Cash Flow for each quarters. BREAKEVEN ANALYSIS (Refer: annexure) According to the projections, our businesses will break-even in the fifth quarter of our business operation.Our fixed cost keeps on increasing but on other hand our E-commerce business is also expected to increase. This will increase the contribution margin in the 2nd& 3rd year. Because of it we will be achieving the break-even in the start of the 2nd year. Contribution Margin = Selling Price – Variable price In the first year the contribution margin is equal to Rs. 182 which is about 17% of the variable cost. In the second year the contribution margin is equal to Rs. 361 which is about 26% of the variable cost. The margin is almost double the margin of the 1st year but due to increase in the average cost of components it is only 26%. In the first year, the expected lag in the break even quantity is around 5100 units of bicycles. But in the second year the break even quantity mark is lead by around 13000 units. Our business is expected to grow in the second year of its inception. 40
  • 41. SCENARIO ANALYSIS Scenario analysis is a process of analyzing possible future events by considering alternative possible outcomes. Here we are considering three scenarios based on the market demand. Scenario 1 (Refer: annexure) During normal market condition we are assuming that we are able to manufacture and sell 100 bicycles by the end of second operating year (2014-15), by gradually increasing the sales from 25 bicycles per day during first quarter of first operating year (2013-14). Detailed Balance Sheet, Profit Loss Statement and Cash Flow statement are given in Annexure. Table 2: Balance Sheet Scenario 1 Year 2013-14 2014-15 2015-16 2016-17 No. of Cycles/Day 50 100 100 100 Application of Funds (la) Fixed Assets (la) Other Fixed Asset 7.00 7.00 7.00 7.00 Net Block 18.45 16.40 14.35 12.30 Current Assets 25.74 60.00 69.20 70.45 Total Assets (la) 51.19 83.40 90.55 89.75 Sources of Funds (la) Current Liabilities 3.70 24.00 29.50 29.50 WC Loan 14.00 14.00 Loan from Relatives 6.50 Owners Fund (Equity +P/L) 26.99 45.40 61.05 60.25 Total Liabilities (la) 51.19 83.40 90.55 89.75 It can be seen from the balance sheet that owners fund has been reduced to close to 27 lakhs by the end of first year due to cash losses during first year of operations, but it starts increasing after first year. We will be start paying dividend to the owners from year 3 onwards to increase our profitability on asset and owners equity. We will be paying INR 8,50,000/ quarter as dividend from third quarter of year three onwards. 41
  • 42. Scenario 2 (Refer: annexure) In this scenario we are expecting higher demand from market than the normal. We are assuming that we are able to manufacture and sell 150 bicycles by the end of second operating year (2014-15), by gradually increasing the sales from 30 bicycles per day during first quarter of first operating year (2013-14). Detailed Balance Sheet, Profit Loss Statement and Cash Flow statement are given in Annexure. Table 3: Balance Sheet Scenario 2 Year 2013-14 2014-15 2015-16 2016-17 No. of Cycles/Day 100 150 150 150 Application of Funds (la) Fixed Assets (la) Other Fixed Assets 7.00 7.00 7.00 7.00 Net Block 18.45 16.40 14.35 12.30 Current Assets 51.43 98.98 103.27 104.53 Total Assets (la) 76.88 122.38 124.62 123.83 Sources of Funds (la) Current Liabilities 7.40 36.00 44.25 44.25 WC Loan 29.00 10.00 Loan from Relatives 6.50 Owners Fund (Equity +P/L) 33.98 76.38 80.37 79.58 Total Liabilities (la) 76.88 122.38 124.62 123.83 In an optimistic scenario we will be reaching 100 bicycles/ day by the end first year and will be expanding to 150 cycles/ day by the end of second year. We will be start paying dividend to the owners from year 3 onwards to increase our profitability on asset and owners equity. We will be paying, INR 10,00,00 in the first quarter of year three and INR 15,00,000/ quarter as dividend from second quarter of year three onwards. Scenario 3 (Refer: annexure) 42
  • 43. In this scenario we are expecting a lower demand from market than the normal. We are assuming that we are able to manufacture and sell 75 bicycles by the end of second operating year (2014-15), by gradually increasing the sales from 20 bicycles per day during first quarter of first operating year (2013-14). Detailed Balance Sheet, Profit Loss Statement and Cash Flow statement are given in Annexure. Table 4: Balance Sheet Scenario 3 Year 2013-14 2014-15 2015-16 2016-17 No. of Cycles/Day 40 75 75 75 Application of Funds (la) Fixed Assets (la) Other Fixed Assets 7.00 7.00 7.00 7.00 Net Block 18.45 16.40 14.35 12.30 Current Assets 20.48 47.21 52.72 53.41 Total Assets (la) 45.93 70.61 74.07 72.71 Sources of Funds (la) Current Liabilities 2.96 18.00 22.13 22.13 WC Loan 11.00 15.00 Loan from Relatives 6.50 Owners Fund (Equity +P/L) 25.47 37.61 51.95 50.59 Total Liabilities (la) 45.93 70.61 74.07 72.71 In a pessimistic projection we are expecting 75 bicycles /day. We will be paying INR 5,50,000/ quarter as dividend from fourth quarter of year three onwards. FINANCIAL RATIO ANALYSIS Financial ratios are useful indicators of a firm's performance and financial situation. Liquidity Ratios Liquidity ratios provide information about a firm's ability to meet its short-term financial obligations. They are of particular interest to those extending short-term credit to the firm. 43
  • 44. Current ratio is defined as follows: Current Assets Current Ratio = Current Liabilities The quick ratio (acid test ratio) is defined as follows: Current Assets - Inventory Quick Ratio = Current Liabilities Cash ratio is defined as follows: Cash + Marketable Securities Cash Ratio = Current Liabilities Liquidity ratios of the company are given below for normal scenario (scenario 1): Table 5: Liquidity ratios (Normal Scenario) Year 2013-14 2014-15 2015-16 2016-17 No. of Cycles/Day 50 100 100 100 Current Ratio 6.96 2.50 2.35 2.39 Quick Ratio 5.40 2.19 2.10 2.14 Cash Ratio 0.29 0.09 0.07 0.11 44
  • 45. Profitability Ratios Profitability ratios offer several different measures of the success of the firm at generating profits. The gross profit margin is a measure of the gross profit earned on sales. The gross profit margin considers the firm's cost of goods sold, but does not include other costs. It is defined as follows: Sales - Cost of Goods Sold Gross Profit Margin = Sales Return on assets is a measure of how effectively the firm's assets are being used to generate profits. It is defined as: Net Income Return on Assets = Total Assets Return on equity is the bottom line measure for the shareholders, measuring the profits earned for each dollar invested in the firm's stock. Return on equity is defined as follows: Net Income Return on Equity = Shareholder Equity Liquidity ratios of the company are given below for normal scenario (scenario 1): Table 6: Profitability Ratios (Scenario 1) Year 2013-14 2014-15 2015-16 2016-17 No. of Cycles/Day 50 100 100 100 Gross Profit Margin 14% 18% 17% 17% Return on Asset -5% 9% 9% 9% Return on Equity -9% 19% 16% 16% 45
  • 46. WORKING CAPITAL FINANCING We will be giving 45 days credit period for retailers and we will be expecting to receive raw material from our supplier at a credit period of 8 days during first year and 20 days thereafter. We will be planning to keep inventory for 10 days of operation during first year and will be gradually reduced to 5 days by third year. Since the higher credit period to retailers our cash flow will be limited during first two years of operation. In order to meet our short term liabilities we will be opting for working capital financing from commercial bank at an interest rate of 15% (Base rate +5). We are also expecting bank will be sanctioned working capital loan upto 6o percentage of account receivables and raw materials. By considering this our first year’s sanctioned working capital limit would be INR 14,79,600 and we will be using INR 14,00,000 during first year . Since the account receivables are increasing due to increase in sales for the following year, we are expecting bank will be raising our working capital financing limit to INR 34.5 lakh in second year and approximately INR 40 lakhs during third and fourth year. But we will be using working capital financing facilities only for the first two years of operations. Summary of working capital utilization schedule is given below, detailed working capital management schedule is given in annexure. Table 7: Working Capital Financing 2013-14 2014-15 2015-16 2016-17 WC Financing Sanctioned 1479600 3466500 4033500 4033500 WC Loan Amount 1400000 1400000 0 0 46
  • 47. ANNEXURES 47