Global Energy Picture Today - and key trends to 2050
•Als PPTX, PDF herunterladen•
2 gefällt mir•960 views

Short review of headline data from the BP Statistical Review of World Energy 2014 + some key energy and environmental trends to 2050
![Overview - Global
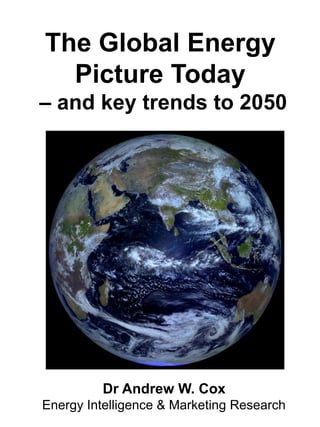
Primary Fuel Sources
Using data from the BP Statistical Review of World
Energy 2014 [www.bp.com] – published 16 June 14
Primary Energy – consumption by fuel sources (Mtoe)
The statistics are for calendar years - and are shown in
millions of tonnes of oil equivalent (Mtoe) - and rounded
to the nearest 0.1%.
Global coal [and natural gas] consumption has
shown strong growth post-2000 in China/non-OECD
1990 2000 2010 2013 2013
(%)
Oil 3162.5 3583.7 4040.2 4185.1 32.9
Coal 2213.6 2342.9 3469.1 3826.7 30.1
Natural Gas 1769.5 2177.0 2868.2 3020.4 23.7
Hydro-
Electric
489.8 602.4 783.9 855.8 6.7
Nuclear
Energy
453.1 584.3 626.2 563.2 4.4
Renewables 28.6 51.8 168.0 279.3 2.2
TOTAL 8118.1 9342.1 11955.6 12730.4 100.0](data:image/gif;base64,R0lGODlhAQABAIAAAAAAAP///yH5BAEAAAAALAAAAAABAAEAAAIBRAA7)
Empfohlen
Empfohlen
Weitere ähnliche Inhalte
Was ist angesagt?
Was ist angesagt? (20)
Ähnlich wie Global Energy Picture Today - and key trends to 2050
Ähnlich wie Global Energy Picture Today - and key trends to 2050 (20)
Kürzlich hochgeladen
Kürzlich hochgeladen (20)
Global Energy Picture Today - and key trends to 2050
- 1. The Global Energy Picture Today – and key trends to 2050 Dr Andrew W. Cox Energy Intelligence & Marketing Research
- 2. Overview - Global Primary Fuel Sources Using data from the BP Statistical Review of World Energy 2014 [www.bp.com] – published 16 June 14 Primary Energy – consumption by fuel sources (Mtoe) The statistics are for calendar years - and are shown in millions of tonnes of oil equivalent (Mtoe) - and rounded to the nearest 0.1%. Global coal [and natural gas] consumption has shown strong growth post-2000 in China/non-OECD 1990 2000 2010 2013 2013 (%) Oil 3162.5 3583.7 4040.2 4185.1 32.9 Coal 2213.6 2342.9 3469.1 3826.7 30.1 Natural Gas 1769.5 2177.0 2868.2 3020.4 23.7 Hydro- Electric 489.8 602.4 783.9 855.8 6.7 Nuclear Energy 453.1 584.3 626.2 563.2 4.4 Renewables 28.6 51.8 168.0 279.3 2.2 TOTAL 8118.1 9342.1 11955.6 12730.4 100.0
- 3. Global Primary Energy – consumption by main fuel sources 1988-2013 (Calendar Years / mtoe) 1 toe (tonne of oil equivalent) equal “approximately”: 42 gigajoules; 40 million btu; 1.5 tonnes of hard coal; 3 tonnes of lignite Source: BP Statistical Review of World Energy 2014, page 43
- 4. The BP data only comprises commercially traded fuels – and excludes many renewable energy sources. Global Fuelwood Consumption – Post-2000 estimates by UN FAO indicate that 1.5-2.0 billion cubic metres of fuelwood are consumed annually (mainly obtained from non-commercial, non- sustainable forests). Over 1 billion people rely to varying degrees on these sources of energy. Deforestation in Africa
- 5. Underlying issues from the [complex] 2014 BP Statistical Review: • Fossil fuels continue to dominate global energy supply [86.7% of traded primary energy sources in 2013] • Coal continues to increase its share of primary energy – as does natural gas. • Renewable energy and other low- carbon primary energy sources [except nuclear power] have continued to grow - but only make up 13.3% of traded global primary fuels. • Economic growth – particularly in Asia and developing countries – continues to drive further expansion in global energy production and consumption.
- 6. During the period to 2050 Demographic forecasts indicate that the global human population will increase to well over 9 billion. [Current population is over 7.2 billion]
- 7. The populations of global cities and urban areas will see further expansion during the period to 2050. By 2030 nearly 1 billion people could be living in China’s cities [approx. 1/8th of the world’s population] Many migrants to cities will use significantly more energy per capita than rural populations [due to changes in employment, lifestyles, etc.].
- 8. However, electrification programmes are continuing throughout the developing countries. Not all city dwellers will live in affluent conditions.
- 9. Increasing populations and economic development will mean more people will be able to achieve a more affluent lifestyle - purchasing consumer goods, cars and more energy-using appliances
- 10. Global energy consumption [as well as water, food and resource consumption] will increase significantly by 2050. If low-carbon energy sources don’t supply a far greater percentage of energy demand - and other key measures aren’t adopted – then atmospheric CO2 levels will rise sharply by 2050 accelerating global warming. Atmospheric CO2 levels reached 400ppm in 2013/14.