the gpa of 15 randomy slected students are shown below on this table.pdf
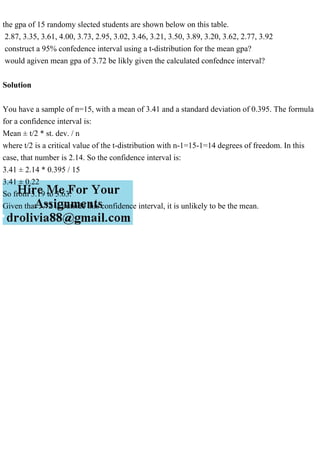
the gpa of 15 randomy slected students are shown below on this table. 2.87, 3.35, 3.61, 4.00, 3.73, 2.95, 3.02, 3.46, 3.21, 3.50, 3.89, 3.20, 3.62, 2.77, 3.92 construct a 95% confedence interval using a t-distribution for the mean gpa? would agiven mean gpa of 3.72 be likly given the calculated confednce interval? Solution You have a sample of n=15, with a mean of 3.41 and a standard deviation of 0.395. The formula for a confidence interval is: Mean ± t/2 * st. dev. / n where t/2 is a critical value of the t-distribution with n-1=15-1=14 degrees of freedom. In this case, that number is 2.14. So the confidence interval is: 3.41 ± 2.14 * 0.395 / 15 3.41 ± 0.22 So from 3.19 to 3.63. Given that 3.72 is outside this confidence interval, it is unlikely to be the mean..
Recommended
Recommended
More Related Content
More from amolmobileshop
More from amolmobileshop (9)

Recently uploaded
Recently uploaded (20)
the gpa of 15 randomy slected students are shown below on this table.pdf
- 1. the gpa of 15 randomy slected students are shown below on this table. 2.87, 3.35, 3.61, 4.00, 3.73, 2.95, 3.02, 3.46, 3.21, 3.50, 3.89, 3.20, 3.62, 2.77, 3.92 construct a 95% confedence interval using a t-distribution for the mean gpa? would agiven mean gpa of 3.72 be likly given the calculated confednce interval? Solution You have a sample of n=15, with a mean of 3.41 and a standard deviation of 0.395. The formula for a confidence interval is: Mean ± t/2 * st. dev. / n where t/2 is a critical value of the t-distribution with n-1=15-1=14 degrees of freedom. In this case, that number is 2.14. So the confidence interval is: 3.41 ± 2.14 * 0.395 / 15 3.41 ± 0.22 So from 3.19 to 3.63. Given that 3.72 is outside this confidence interval, it is unlikely to be the mean.