SlideShare a Scribd company logo
1 of 61
Download to read offline
Data Visualization
Dr. Amitabh Mishra 1
24%
18%
13%
18%
11%
7%
9%
Data Visualization or Presentation
• Data visualization means-
“to convey information through visual representations”
• Visalisation tools produces
“interactive visual representations of data to reinforce
human cognition; enabling the viewer to gain knowledge
about the internal structure of the data and causal
relationships in it”
Dr. Amitabh Mishra 2
Significance of Visualization/
Presentation
• They give a bird’s eye view of entire data
• They are attractive to the eye
• They have great memorizing effect
• They facilitate comparison
• They give visual indications of
– Magnitudes,
– Grouping,
– Trends and patterns
Dr. Amitabh Mishra 3
Functions of Visualization/
Presentation
• Three functions of visualization are:
– Record
i.e. Store information
– Analyze
i.e. Support reasoning about information
– Communicate
i.e. Convey information to others
Dr. Amitabh Mishra 4
Tools for Visualization
(Diagrammatic & Graphic Representation)
Visualization/
Representation
Diagrammatic
Representation
Bar-diagram
Pie-chart
Pictogram
Graphic
Representation
Histogram
Frequency Polygon
Smoothed Frequency
Curve
Cumulative Frequency
Curve (Ogive)
Dr. Amitabh Mishra 5
Tools for Visualization
(Diagrammatic & Graphic Representation)
• Diagrammatic Representation
a) Bar-diagram (One dimensional diagram)
b) Pie-chart (Two dimensional diagram)
c) Pictogram/ Cartograms (Statistical Maps)
• Graphic Representation
a) Histogram
b) Frequency Polygon
c) Smoothed Frequency Curve
d) Cumulative Frequency Curve (Ogive)
Dr. Amitabh Mishra 6
DIAGRAMMATIC REPRESENTATION
Dr. Amitabh Mishra 7
-20%
0%
20%
40%
60%
80%
100%
1986 1987 1988
profit/loss
polishing
other cost
wages
Types of Diagram
Dr. Amitabh Mishra 8
Diagrammatic
Representation
Bar-diagram
(One Dimensional Diagram)
Pie-chart
(Two Dimensional Diagram
Pictogram/Cartograms
(Statistical Maps)
BAR DIAGRAM
One Dimensional Diagram
Dr. Amitabh Mishra 9
0
100
200
300
400
500
600
700
1993-94 1994-95 1995-95
Rs
lakhs
years
Bar Diagram
• “Bar-Diagram are vertical lines where length of the bars
are proportional to their corresponding numerical values”.
• “Bar is a thick line whose width is shown merely for
attention”.
– But, all bars should have the same width so as not to confuse
the reader of diagram.
• It is called one dimensional diagram because it is only
length of bar which matters not the width.
Dr. Amitabh Mishra 10
• Width of bars should be uniform through out the
diagram
• The gap between one diagram and other should be
uniform
• Bars may be either
– Horizontal or
– Vertical
• The vertical bars should be preferred because they give a better look
Dr. Amitabh Mishra 11
C4
1Q
4Q
3Q
2Q
1Q
1.5
1.2
0.9
0.6
0.3
0.0
Figure 1-11:SHIFTINGGEARS
2003 2004
Quartely netincome for General Motors (inbillions)
Types of Bar Diagram
Dr. Amitabh Mishra 12
Bar Diagram
Simple bar diagram
Sub-divided Bar diagram
Multiple-bars diagram
Percentage-bar diagram
Deviation bars diagram
Types of Bar Diagram
1. Simple bar diagram
2. Sub-divided Bar diagram
3. Multiple-bars diagram
4. Percentage-bar diagram
5. Deviation bars.
Dr. Amitabh Mishra 13
Simple Bar diagram
• It is used to represent only one variable
• Ex-
– Figures of sales for various years
– Figures of production for various years
– Figures of population for various years
Dr. Amitabh Mishra 14
• Following table gives
birth rate per thousand
of different countries
over a period of time.
Dr. Amitabh Mishra 15
0
5
10
15
20
25
30
35
40
45
india germany united
kingdom
china new zeland swedan
birth rate per thousand of different countries
Country Birth rate
India 33
Germany 16
U.K 20
China 40
Newzealand 30
Swedan 15
Example 2:
Fund flow for various years may be shown by means of
a simple bar-diagram
Year
Funds Flow
(Rs. crores)
2009-10 85.80
2010-11 109.61
2011-22 204.29
2012-13 126.31
Dr. Amitabh Mishra 16
0
50
100
150
200
250
2009-10
2010-11
2011-12
2012-13
Funds Flow
Funds Flow
Exercise: 1
Prepare a Simple bar diagram for your internal and external marks in previous
semester examination
Subject
Name
External
Marks
Internal
Marks
Total
Marks
Marketing 67 30 97
Organizational
Behavior
55 25 80
Accounting 45 20 65
Computer
Application
60 28 88
Statistics 39 21 60
Production &
Operations
48 25 73
Dr. Amitabh Mishra 17
0 10 20 30 40 50 60 70 80
Marketing
Organizational
Accounting
Computer Application
Statistics
Production & Operations
Marketing
Organizati
onal
Accounting
Computer
Application
Statistics
Production
&
Operations
External Marks 67 55 45 60 39 48
External Marks
Sub-divided Bar Diagram
• “In Sub divided Bar Diagram each bar representing
the magnitude of given phenomenon is further
subdivided in its various components”.
• Each component occupies a part of the bar
proportional to its share in total.
Dr. Amitabh Mishra 18
• The growth of production of fish for
the period 1950-51 to 1986-87 is-
(In lakh tonnes).
Dr. Amitabh Mishra 19
0
5
10
15
20
25
30
35
1950-51
1960-61
1970-71
1980-81
1984-85
1985-86
PRODUCTION
OF
FISH
YEARS
inland
marine
Year Marine Inland total
1950-51 5.34 2.18 7.52
1960-61 8.80 2.80 11.60
1970-71 10.86 6.70 17.56
1980-81 15.55 8.87 24.42
1984-85 16.98 11.03 28.01
1985-86 17.16 11.60 28.76
1986-87 12.47 8.42 20.89
Exercise
Prepare a sub-divided bar diagram for your internal and external marks in
previous semester examination
Subject
Name
External
Marks
Internal
Marks
Total
Marks
Marketing 67 30 97
Organizational
Behavior
55 25 80
Accounting 45 20 65
Computer
Application
60 28 88
Statistics 39 21 60
Production &
Operations
48 25 73
Dr. Amitabh Mishra 20
Marketi
ng
Org
Beha
Accoun
ting
Comp
App
Statistic
s
Pro &
Oper
Internal 30 25 20 28 21 25
External 67 55 45 60 39 48
0
20
40
60
80
100
120
MArks
internal and external marks
Multiple-bars diagram
• In multiple bars “two or more set of
interrelated data are represented”.
• This diagram should be preferred, when ever
comparison between two or more related
variables is to be made.
Dr. Amitabh Mishra 21
0
20
40
60
80
100
120
140
160
1984 1985 1986 1987
sales
gross profit
net profit
Dr. Amitabh Mishra 22
• Draw a suitable diagram
from the following data-
Year Sales Gross
profit
Net
profit
1984 120 40 20
1985 135 45 20
1986 140 55 35
1987 150 60 40
2002-03 2003-04
Gross profits
Profits before tax
Profit after tax
Retained profits
3104
1663
1219
846
3123
1376
982
589
Dr. Amitabh Mishra 23
3104 3123
1663
1376
1219
982
846
589
0
500
1000
1500
2000
2500
3000
3500
2002-03 2003-04
Gross Profits
Profits Before
Tax
Profit After
Tax
Retained
Profits
Percentage-bar diagram
• “Sub-divided bar chart drawn on percentage basis is
known as percentage bar diagram”.
• In Percentage bar diagram, we express each
component as the percentage of its respective total.
• Bars of length equal to 100 for each class are drawn at
first step and sub-divided in the proportion of the
percentage of their component in the second step.
Dr. Amitabh Mishra 24
• Represent the following by sub divided bar diagram on percentage
basis-
Dr. Amitabh Mishra 25
Particulars 1986 1987 1988
Cost/chair
Wages 9 15 21
Other costs 6 10 14
Polishing 3 5 7
Total 18 30 42
Proceeds
/chair
20 30 40
Profit/loss +2 - -2
Particulars 1986 1987 1988
Cost/chair
Wages 45 50 52.5
Other
costs
30 33.3 35
Polishing 15 16.7 17.5
Total cost 90 100 105
Sales price 100 100 100
Profit/loss +10 - -5.0
-20%
0%
20%
40%
60%
80%
100%
1986 1987 1988
profit/loss
polishing
other cost
wages
Dr. Amitabh Mishra 26
Take the sales price/chair as 100 and
express the other figures in
percentages. The percentages so
obtained are given below-
Items Expenses
%
Expense
s
Food
Clothing
House Rent
Education
5550
5100
4800
4950
27.21%
25%
23.53%
24.26%
Total 20400 100%
Dr. Amitabh Mishra 27
27.21
25
24.26
23.53
0%
10%
20%
30%
40%
50%
60%
70%
80%
90%
100%
%Expenses
education
house rent
clothing
food
Deviation Bar-diagram
• Deviation bars are popularly used for representing net quantity-
excess or deficit i.e.
– Net profit,
– Net loss,
– Net exports, or
– Net imports, etc.
• Such bars can have both positive and negative values. Positive
values are shown above the base line and negative values below it.
Dr. Amitabh Mishra 28
Year Sales
Net
profits
2011-12
14%
29%
2012-13 11% 61%
2013-14
17% -21%
-30%
-20%
-10%
0%
10%
20%
30%
40%
50%
60%
70%
sales net profit
2001-02
2002-03
2003-04
Dr. Amitabh Mishra 29
2001-02 2002-03 2003-04
sales 14% 11% 17%
net profit 29% 61% -21%
Two dimensional diagram
or
Surface Diagram/ Area Diagram
1. Pie diagrams.
Dr. Amitabh Mishra 30
Pie Charts
or
Round
1st Qtr
2nd Qtr
3rd Qtr
4th Qtr
Dr. Amitabh Mishra 31
• “A pie chart is a circular chart in which the circle
is divided into sectors. Each sector visually
represents an item in a data set to match the
amount of the item as a percentage or fraction of
the total data set”.
• Pie charts are useful to compare different parts of
a whole amount.
Dr. Amitabh Mishra 32
• A pie chart is not useful for displaying relationships over
time or relationships among several variables.
• A pie chart should not require more than seven sections.
• The steps to draw a pie diagram are:
– Convert the various observations (in percent) in the data set
into corresponding degree in the circle by multiplying each by
3.6 (360 /100)
– Draw the circle and its parts using different degrees
33
Dr. Amitabh Mishra
Example
• Draw a pie chart for the following data of 6th
five year plan public sector outlays:
Dr. Amitabh Mishra 34
Sector Percentage outlay
Agricultural and rural development 12.9%
Irrigation etc. 12.5%
Energy 27.2%
Industry and mineral 15.4%
Transport, communication etc. 15.9%
Social service and other 16.1%
The angle at the centre is given by-
=(Percentage outlay/100)x 360
= Percentage outlay x 3.6
Dr. Amitabh Mishra 35
Sector Percentage
outlay
Angle at the centre
Agricultural and rural development 12.9% 12.9 x 3.6 = 46°
Irrigation etc. 12.5% 12.5 x 3.6 = 45°
Energy 27.2% 27.2 x 3.6 =98°
Industry and mineral 15.4% 15.4 x 3.6 = 56°
Transport, communication etc. 15.9% 15.9 x 3.6 = 57°
Social service and other 16.1% 16.1 x 3.6 = 58°
Total 100% 360°
Dr. Amitabh Mishra 36
13%
13%
15%
16%
16%
27%
Percentage outlay
Agricultural and rural
development
Industry and mineral
Transport,
communication etc.
Social service and other
Energy
U.S. Auto Sales 2003 - 2007
37
Dr. Amitabh Mishra
Pie Chart of 2007 U.S. Auto Sales
24%
18%
13%
18%
11%
7%
9%
GM
Ford
Chrysler
Toyota
Honda
Nissan
Other
38
Dr. Amitabh Mishra
46%
27%
19%
5% 3%
Column2
Pacific
Atlantic
Indian
Antarctic
arctic
Dr. Amitabh Mishra 39
Ocean Area % Area Degree
Pacific
Atlantic
Indian
Antarctic
arctic
70.8
41.2
28.5
7.6
4.8
46.31
26.94
18.64
4.96
3.15
166.70
97.00
67.10
17.89
11.31
Total 152.9 100.00 360.00
Pictographs
• “A pictograph uses small pictures or symbols to display
the data”.
• Pictographs do not depict results precisely. Hence, caution
should be exercised when using them.
• To construct pictograms the following suggestions are
made:
– The symbols must be simple and clear.
– The quantity represented by a symbol should be given.
40
Dr. Amitabh Mishra
Pictograph for 2007 U.S. Auto Sales
*Each Symbol Equals 1,000,000 Units
GM
Chrysler
Toyota
Honda
Nissan
Other
Ford
41
Dr. Amitabh Mishra
Dr. Amitabh Mishra 42
Example of pictogram:
Year Output
1999
2000
2001
2002
2004
2996
4052
5924
Output of cars during the year by a car
manufacturing company:
1999
2000
2001
2002
Scale = 1000 cars
Types of Graphs
graphs
Graphs of time
series or
Line graphs
Graph of
frequency
distribution
Dr. Amitabh Mishra 43
Line graphs
or
graph of time series
• Graph of one variable.
• Graph of two or more variables.
• Graph having two scales.
• Range chart
• Band graph.
• Ratio chart.
Dr. Amitabh Mishra 44
Graph of frequency distribution
• Histogram
• Frequency Polygon.
• Smoothed frequency curve.
• Ogives or cumulative frequency curves.
Dr. Amitabh Mishra 45
 A histogram is a chart made of bars of different
heights.
Widths and locations of bars correspond to widths
and locations of data groupings
Heights of bars correspond to frequencies or
relative frequencies of data groupings
Histogram
46
Dr. Amitabh Mishra
Frequency Histogram
Histogram Example
47
Dr. Amitabh Mishra
Relative Frequency Histogram
Histogram Example
48
Dr. Amitabh Mishra
Figure 23.6
Histogram of 2007 U.S. Auto Sales
0
500,000
1,000,000
1,500,000
2,000,000
2,500,000
3,000,000
3,500,000
4,000,000
4,500,000
GM
Ford
Chrysler
Toyota
Honda
Nissan
other
49
Dr. Amitabh Mishra
 Pie Charts
Categories represented as percentages of total
 Bar Graphs
Heights of rectangles represent group frequencies
 Frequency Polygons
Height of line represents frequency
 Ogives
Height of line represents cumulative frequency
 Time Plots
Represents values over time
1-8 Methods of Displaying Data
50
Dr. Amitabh Mishra
Pie Chart
33.0%
23.0%
19.0%
19.0%
6.0%
Category
Happy with career
Don't like my job but it is on my career path
Job is OK, but it is not on my career path
Enjoy job, but it is not on my career path
My job just pays the bills
Figure 1-10: Twentysomethings split on job satisfication
My job just pays the bills
Happy with career
Enjoy job, but it is not on my career path
Job OK, but it is not on my career path
Do not like my job, but it is on my career path
51
Dr. Amitabh Mishra
Relative Frequency Polygon Ogive
Frequency Polygon and Ogive
50
40
30
20
10
0
0.3
0.2
0.1
0.0
Sales
50
40
30
20
10
0
1.0
0.5
0.0
Sales
(Cumulative frequency or
relative frequency graph)
52
Dr. Amitabh Mishra
O
S
A
J
J
M
A
M
F
J
D
N
O
S
A
J
J
M
A
M
F
J
D
N
O
S
A
J
J
M
A
M
F
J
8.5
7.5
6.5
5.5
Month
M
i
l
l
i
o
n
s
o
f
T
o
n
s
Mo nthly S te e l P ro d uc tio n
Time Plot
53
Dr. Amitabh Mishra
Scatter Plots
• Scatter Plots are used to identify and report
any underlying relationships among pairs of
data sets.
• The plot consists of a scatter of points, each
point representing an observation.
54
Dr. Amitabh Mishra
Scatter Plots
• Scatter plot with
trend line.
• This type of
relationship is
known
as a positive
correlation.
Correlation will be
discussed in later
chapters.
55
Dr. Amitabh Mishra
U.S. Auto Sales 2003 - 2007
56
Dr. Amitabh Mishra
Guidelines for Graphs: Line Charts
• A line chart connects a series of data points using
continuous lines.
• This is an attractive way of illustrating trends and
changes over time.
• Several series can be compared on the same
chart, and forecasts, interpolations, and
extrapolations can be shown.
57
Dr. Amitabh Mishra
Line Chart of Total U.S. Auto Sales
Fig. 23.3
0
500000
1000000
1500000
2000000
2500000
3000000
3500000
4000000
4500000
5000000
2003 2004 2005 2006 2007
Unit
Sales
Year
GM
Ford
Chrysler
Toyota
Honda
Nissan
Other
58
Dr. Amitabh Mishra
Guidelines for Graphs: Line Charts
• A stratum chart is a set of line charts in
which the data are successively
aggregated over the series.
• Areas between the line charts display the
magnitudes of the relevant variables.
59
Dr. Amitabh Mishra
Fig. 23.4
Stratum Chart of Total U.S. Auto Sales
0
2000000
4000000
6000000
8000000
10000000
12000000
14000000
16000000
18000000
20000000
2003 2004 2005 2006 2007
Unit
Sales
Year
Other
Nissan
Honda
Toyota
Chrysler
Ford
GM
60
Dr. Amitabh Mishra
Guidelines for Graphs:
Histograms and Bar Charts
• A bar chart displays data in various bars that
may be positioned horizontally or vertically.
• The histogram is a vertical bar chart in which
the height of the bars represents the relative
or cumulative frequency of occurrence of a
specific variable.
61
Dr. Amitabh Mishra

More Related Content

What's hot

Introduction to Data Visualization
Introduction to Data VisualizationIntroduction to Data Visualization
Introduction to Data VisualizationStephen Tracy
 
Data Visualization in Data Science
Data Visualization in Data ScienceData Visualization in Data Science
Data Visualization in Data ScienceMaloy Manna, PMP®
 
"Introduction to Data Visualization" Workshop for General Assembly by Hunter ...
"Introduction to Data Visualization" Workshop for General Assembly by Hunter ..."Introduction to Data Visualization" Workshop for General Assembly by Hunter ...
"Introduction to Data Visualization" Workshop for General Assembly by Hunter ...Hunter Whitney
 
Business analytics
Business analyticsBusiness analytics
Business analyticsDinakar nk
 
5 Data Visualization Pitfalls
5 Data Visualization Pitfalls5 Data Visualization Pitfalls
5 Data Visualization PitfallsData IQ Argentina
 
Career in Data Science
Career in Data ScienceCareer in Data Science
Career in Data ScienceActonRoy
 
What is Data analytics and it's importance ?
What is Data analytics and it's importance ?What is Data analytics and it's importance ?
What is Data analytics and it's importance ?AbhayDhupar
 
Brief introduction to data visualization
Brief introduction to data visualizationBrief introduction to data visualization
Brief introduction to data visualizationZach Gemignani
 
How to create more impact with People Analytics
How to create more impact with People AnalyticsHow to create more impact with People Analytics
How to create more impact with People AnalyticsDavid Green
 
Data Analytics PowerPoint Presentation Slides
Data Analytics PowerPoint Presentation SlidesData Analytics PowerPoint Presentation Slides
Data Analytics PowerPoint Presentation SlidesSlideTeam
 
Data visualization in a Nutshell
Data visualization in a NutshellData visualization in a Nutshell
Data visualization in a NutshellWingChan46
 
Data Visualization Techniques in Power BI
Data Visualization Techniques in Power BIData Visualization Techniques in Power BI
Data Visualization Techniques in Power BIAngel Abundez
 
Interactive Visualization
Interactive VisualizationInteractive Visualization
Interactive VisualizationUNCResearchHub
 
EDA | Exploratory Data Analysis | Machine Learning | Data Science
EDA | Exploratory Data Analysis | Machine Learning | Data ScienceEDA | Exploratory Data Analysis | Machine Learning | Data Science
EDA | Exploratory Data Analysis | Machine Learning | Data ScienceSumit Pandey
 
The Future Of Data Visualization
The Future Of Data VisualizationThe Future Of Data Visualization
The Future Of Data VisualizationFITC
 

What's hot (20)

Data Visualization.pptx
Data Visualization.pptxData Visualization.pptx
Data Visualization.pptx
 
Introduction to Data Visualization
Introduction to Data VisualizationIntroduction to Data Visualization
Introduction to Data Visualization
 
Data Visualization in Data Science
Data Visualization in Data ScienceData Visualization in Data Science
Data Visualization in Data Science
 
"Introduction to Data Visualization" Workshop for General Assembly by Hunter ...
"Introduction to Data Visualization" Workshop for General Assembly by Hunter ..."Introduction to Data Visualization" Workshop for General Assembly by Hunter ...
"Introduction to Data Visualization" Workshop for General Assembly by Hunter ...
 
Business analytics
Business analyticsBusiness analytics
Business analytics
 
5 Data Visualization Pitfalls
5 Data Visualization Pitfalls5 Data Visualization Pitfalls
5 Data Visualization Pitfalls
 
Data Visualization
Data VisualizationData Visualization
Data Visualization
 
Career in Data Science
Career in Data ScienceCareer in Data Science
Career in Data Science
 
What is Data analytics and it's importance ?
What is Data analytics and it's importance ?What is Data analytics and it's importance ?
What is Data analytics and it's importance ?
 
Brief introduction to data visualization
Brief introduction to data visualizationBrief introduction to data visualization
Brief introduction to data visualization
 
How to create more impact with People Analytics
How to create more impact with People AnalyticsHow to create more impact with People Analytics
How to create more impact with People Analytics
 
Data Analytics PowerPoint Presentation Slides
Data Analytics PowerPoint Presentation SlidesData Analytics PowerPoint Presentation Slides
Data Analytics PowerPoint Presentation Slides
 
Data visualization in a Nutshell
Data visualization in a NutshellData visualization in a Nutshell
Data visualization in a Nutshell
 
Data visualization
Data visualizationData visualization
Data visualization
 
Data Visualization Techniques in Power BI
Data Visualization Techniques in Power BIData Visualization Techniques in Power BI
Data Visualization Techniques in Power BI
 
Interactive Visualization
Interactive VisualizationInteractive Visualization
Interactive Visualization
 
EDA | Exploratory Data Analysis | Machine Learning | Data Science
EDA | Exploratory Data Analysis | Machine Learning | Data ScienceEDA | Exploratory Data Analysis | Machine Learning | Data Science
EDA | Exploratory Data Analysis | Machine Learning | Data Science
 
Data visualization
Data visualizationData visualization
Data visualization
 
The Future Of Data Visualization
The Future Of Data VisualizationThe Future Of Data Visualization
The Future Of Data Visualization
 
Data Visualization
Data VisualizationData Visualization
Data Visualization
 

Similar to Data Visualization Techniques for Analysis and Communication

Types of graphs
Types of graphsTypes of graphs
Types of graphsLALIT BIST
 
Chapter Two (PART ONE).pptx
Chapter Two (PART ONE).pptxChapter Two (PART ONE).pptx
Chapter Two (PART ONE).pptxMohammedYonis2
 
statistics Diagrams
 statistics Diagrams statistics Diagrams
statistics Diagramsanil sharma
 
Diagrammatic and Graphical Representation of Data in Statistics
Diagrammatic and Graphical Representation of Data in StatisticsDiagrammatic and Graphical Representation of Data in Statistics
Diagrammatic and Graphical Representation of Data in StatisticsAsha Dhilip
 
Seven Quality Tools - Presentation Material Sample 1.ppt
Seven Quality Tools - Presentation Material Sample 1.pptSeven Quality Tools - Presentation Material Sample 1.ppt
Seven Quality Tools - Presentation Material Sample 1.pptssusere6db8e
 
Seven quality-tools-1233776598291857-2
Seven quality-tools-1233776598291857-2Seven quality-tools-1233776598291857-2
Seven quality-tools-1233776598291857-2Mahmood Alam
 
Representation of data using bar diagram
Representation of data using bar diagramRepresentation of data using bar diagram
Representation of data using bar diagramsaru3008
 
diagrams-191020083131.pptx
diagrams-191020083131.pptxdiagrams-191020083131.pptx
diagrams-191020083131.pptxPraveen Kumar
 
Business mathematics and statistics by G.Reka
Business mathematics and statistics by G.RekaBusiness mathematics and statistics by G.Reka
Business mathematics and statistics by G.RekaPOLIKAIYOOR REKA
 
trendanalysis for mba management students
trendanalysis for mba management studentstrendanalysis for mba management students
trendanalysis for mba management studentsSoujanyaLk1
 
Quality_Control_Tools.ppt
Quality_Control_Tools.pptQuality_Control_Tools.ppt
Quality_Control_Tools.pptMurali Sama rao
 
trendanalysis-170105165905.pptx
trendanalysis-170105165905.pptxtrendanalysis-170105165905.pptx
trendanalysis-170105165905.pptxssuserd329601
 
trendanalysis-170105165905.pptx
trendanalysis-170105165905.pptxtrendanalysis-170105165905.pptx
trendanalysis-170105165905.pptxssuserd329601
 
Lab file on research methodology
Lab file on research methodologyLab file on research methodology
Lab file on research methodologySukhchain Aggarwal
 

Similar to Data Visualization Techniques for Analysis and Communication (20)

Types of graphs
Types of graphsTypes of graphs
Types of graphs
 
Graphs in Biostatistics
Graphs in Biostatistics Graphs in Biostatistics
Graphs in Biostatistics
 
Chapter Two (PART ONE).pptx
Chapter Two (PART ONE).pptxChapter Two (PART ONE).pptx
Chapter Two (PART ONE).pptx
 
statistics Diagrams
 statistics Diagrams statistics Diagrams
statistics Diagrams
 
Diagrammatic and Graphical Representation of Data in Statistics
Diagrammatic and Graphical Representation of Data in StatisticsDiagrammatic and Graphical Representation of Data in Statistics
Diagrammatic and Graphical Representation of Data in Statistics
 
Seven quality tools
Seven quality toolsSeven quality tools
Seven quality tools
 
Seven Quality Tools - Presentation Material Sample 1.ppt
Seven Quality Tools - Presentation Material Sample 1.pptSeven Quality Tools - Presentation Material Sample 1.ppt
Seven Quality Tools - Presentation Material Sample 1.ppt
 
Seven quality-tools-1233776598291857-2
Seven quality-tools-1233776598291857-2Seven quality-tools-1233776598291857-2
Seven quality-tools-1233776598291857-2
 
Representation of data using bar diagram
Representation of data using bar diagramRepresentation of data using bar diagram
Representation of data using bar diagram
 
diagrams-191020083131.pptx
diagrams-191020083131.pptxdiagrams-191020083131.pptx
diagrams-191020083131.pptx
 
quality tools.ppt
quality tools.pptquality tools.ppt
quality tools.ppt
 
17 visualization
17 visualization17 visualization
17 visualization
 
statistics.pptx
statistics.pptxstatistics.pptx
statistics.pptx
 
Business mathematics and statistics by G.Reka
Business mathematics and statistics by G.RekaBusiness mathematics and statistics by G.Reka
Business mathematics and statistics by G.Reka
 
trendanalysis for mba management students
trendanalysis for mba management studentstrendanalysis for mba management students
trendanalysis for mba management students
 
Training Module
Training ModuleTraining Module
Training Module
 
Quality_Control_Tools.ppt
Quality_Control_Tools.pptQuality_Control_Tools.ppt
Quality_Control_Tools.ppt
 
trendanalysis-170105165905.pptx
trendanalysis-170105165905.pptxtrendanalysis-170105165905.pptx
trendanalysis-170105165905.pptx
 
trendanalysis-170105165905.pptx
trendanalysis-170105165905.pptxtrendanalysis-170105165905.pptx
trendanalysis-170105165905.pptx
 
Lab file on research methodology
Lab file on research methodologyLab file on research methodology
Lab file on research methodology
 

More from Dr. Amitabh Mishra

More from Dr. Amitabh Mishra (20)

Sales Quotas & Sales Territory
Sales Quotas & Sales TerritorySales Quotas & Sales Territory
Sales Quotas & Sales Territory
 
Sales Promotion
Sales PromotionSales Promotion
Sales Promotion
 
Transportation Management
Transportation ManagementTransportation Management
Transportation Management
 
Sales Forecasting
Sales ForecastingSales Forecasting
Sales Forecasting
 
Sales Organisation
Sales OrganisationSales Organisation
Sales Organisation
 
Selling Process
Selling ProcessSelling Process
Selling Process
 
Objectives and Nature of Sales Management
Objectives and Nature of Sales ManagementObjectives and Nature of Sales Management
Objectives and Nature of Sales Management
 
Sales and Sales Management: Meaning and Definition
Sales and Sales Management: Meaning and DefinitionSales and Sales Management: Meaning and Definition
Sales and Sales Management: Meaning and Definition
 
Packaging and Labaling
Packaging and LabalingPackaging and Labaling
Packaging and Labaling
 
Product Life Cycle (PLC)
Product Life Cycle (PLC)Product Life Cycle (PLC)
Product Life Cycle (PLC)
 
Targeting, Differentiation and Positioning
Targeting, Differentiation and PositioningTargeting, Differentiation and Positioning
Targeting, Differentiation and Positioning
 
Marketing Environment by Dr. Amitabh Mishra
Marketing Environment by Dr. Amitabh MishraMarketing Environment by Dr. Amitabh Mishra
Marketing Environment by Dr. Amitabh Mishra
 
Marketing Mix
Marketing MixMarketing Mix
Marketing Mix
 
Marketing Philosophies or Concepts
Marketing Philosophies or ConceptsMarketing Philosophies or Concepts
Marketing Philosophies or Concepts
 
Scope of Marketing
Scope of MarketingScope of Marketing
Scope of Marketing
 
Introduction to Marketing Management
Introduction to Marketing ManagementIntroduction to Marketing Management
Introduction to Marketing Management
 
Service Scape
Service ScapeService Scape
Service Scape
 
Service Product and Service Flower
Service Product and Service FlowerService Product and Service Flower
Service Product and Service Flower
 
Distribution of Services
Distribution of ServicesDistribution of Services
Distribution of Services
 
Service Blueprinting
Service BlueprintingService Blueprinting
Service Blueprinting
 

Recently uploaded

Chapter 9 PPT 4th edition.pdf internal audit
Chapter 9 PPT 4th edition.pdf internal auditChapter 9 PPT 4th edition.pdf internal audit
Chapter 9 PPT 4th edition.pdf internal auditNhtLNguyn9
 
8447779800, Low rate Call girls in Kotla Mubarakpur Delhi NCR
8447779800, Low rate Call girls in Kotla Mubarakpur Delhi NCR8447779800, Low rate Call girls in Kotla Mubarakpur Delhi NCR
8447779800, Low rate Call girls in Kotla Mubarakpur Delhi NCRashishs7044
 
TriStar Gold Corporate Presentation - April 2024
TriStar Gold Corporate Presentation - April 2024TriStar Gold Corporate Presentation - April 2024
TriStar Gold Corporate Presentation - April 2024Adnet Communications
 
Independent Call Girls Andheri Nightlaila 9967584737
Independent Call Girls Andheri Nightlaila 9967584737Independent Call Girls Andheri Nightlaila 9967584737
Independent Call Girls Andheri Nightlaila 9967584737Riya Pathan
 
Entrepreneurship lessons in Philippines
Entrepreneurship lessons in  PhilippinesEntrepreneurship lessons in  Philippines
Entrepreneurship lessons in PhilippinesDavidSamuel525586
 
Call US-88OO1O2216 Call Girls In Mahipalpur Female Escort Service
Call US-88OO1O2216 Call Girls In Mahipalpur Female Escort ServiceCall US-88OO1O2216 Call Girls In Mahipalpur Female Escort Service
Call US-88OO1O2216 Call Girls In Mahipalpur Female Escort Servicecallgirls2057
 
Ten Organizational Design Models to align structure and operations to busines...
Ten Organizational Design Models to align structure and operations to busines...Ten Organizational Design Models to align structure and operations to busines...
Ten Organizational Design Models to align structure and operations to busines...Seta Wicaksana
 
Buy gmail accounts.pdf Buy Old Gmail Accounts
Buy gmail accounts.pdf Buy Old Gmail AccountsBuy gmail accounts.pdf Buy Old Gmail Accounts
Buy gmail accounts.pdf Buy Old Gmail AccountsBuy Verified Accounts
 
NewBase 19 April 2024 Energy News issue - 1717 by Khaled Al Awadi.pdf
NewBase  19 April  2024  Energy News issue - 1717 by Khaled Al Awadi.pdfNewBase  19 April  2024  Energy News issue - 1717 by Khaled Al Awadi.pdf
NewBase 19 April 2024 Energy News issue - 1717 by Khaled Al Awadi.pdfKhaled Al Awadi
 
PSCC - Capability Statement Presentation
PSCC - Capability Statement PresentationPSCC - Capability Statement Presentation
PSCC - Capability Statement PresentationAnamaria Contreras
 
Innovation Conference 5th March 2024.pdf
Innovation Conference 5th March 2024.pdfInnovation Conference 5th March 2024.pdf
Innovation Conference 5th March 2024.pdfrichard876048
 
APRIL2024_UKRAINE_xml_0000000000000 .pdf
APRIL2024_UKRAINE_xml_0000000000000 .pdfAPRIL2024_UKRAINE_xml_0000000000000 .pdf
APRIL2024_UKRAINE_xml_0000000000000 .pdfRbc Rbcua
 
Traction part 2 - EOS Model JAX Bridges.
Traction part 2 - EOS Model JAX Bridges.Traction part 2 - EOS Model JAX Bridges.
Traction part 2 - EOS Model JAX Bridges.Anamaria Contreras
 
8447779800, Low rate Call girls in New Ashok Nagar Delhi NCR
8447779800, Low rate Call girls in New Ashok Nagar Delhi NCR8447779800, Low rate Call girls in New Ashok Nagar Delhi NCR
8447779800, Low rate Call girls in New Ashok Nagar Delhi NCRashishs7044
 
Fordham -How effective decision-making is within the IT department - Analysis...
Fordham -How effective decision-making is within the IT department - Analysis...Fordham -How effective decision-making is within the IT department - Analysis...
Fordham -How effective decision-making is within the IT department - Analysis...Peter Ward
 
Cybersecurity Awareness Training Presentation v2024.03
Cybersecurity Awareness Training Presentation v2024.03Cybersecurity Awareness Training Presentation v2024.03
Cybersecurity Awareness Training Presentation v2024.03DallasHaselhorst
 
8447779800, Low rate Call girls in Saket Delhi NCR
8447779800, Low rate Call girls in Saket Delhi NCR8447779800, Low rate Call girls in Saket Delhi NCR
8447779800, Low rate Call girls in Saket Delhi NCRashishs7044
 
Church Building Grants To Assist With New Construction, Additions, And Restor...
Church Building Grants To Assist With New Construction, Additions, And Restor...Church Building Grants To Assist With New Construction, Additions, And Restor...
Church Building Grants To Assist With New Construction, Additions, And Restor...Americas Got Grants
 
Flow Your Strategy at Flight Levels Day 2024
Flow Your Strategy at Flight Levels Day 2024Flow Your Strategy at Flight Levels Day 2024
Flow Your Strategy at Flight Levels Day 2024Kirill Klimov
 

Recently uploaded (20)

Chapter 9 PPT 4th edition.pdf internal audit
Chapter 9 PPT 4th edition.pdf internal auditChapter 9 PPT 4th edition.pdf internal audit
Chapter 9 PPT 4th edition.pdf internal audit
 
8447779800, Low rate Call girls in Kotla Mubarakpur Delhi NCR
8447779800, Low rate Call girls in Kotla Mubarakpur Delhi NCR8447779800, Low rate Call girls in Kotla Mubarakpur Delhi NCR
8447779800, Low rate Call girls in Kotla Mubarakpur Delhi NCR
 
TriStar Gold Corporate Presentation - April 2024
TriStar Gold Corporate Presentation - April 2024TriStar Gold Corporate Presentation - April 2024
TriStar Gold Corporate Presentation - April 2024
 
Independent Call Girls Andheri Nightlaila 9967584737
Independent Call Girls Andheri Nightlaila 9967584737Independent Call Girls Andheri Nightlaila 9967584737
Independent Call Girls Andheri Nightlaila 9967584737
 
Entrepreneurship lessons in Philippines
Entrepreneurship lessons in  PhilippinesEntrepreneurship lessons in  Philippines
Entrepreneurship lessons in Philippines
 
Call US-88OO1O2216 Call Girls In Mahipalpur Female Escort Service
Call US-88OO1O2216 Call Girls In Mahipalpur Female Escort ServiceCall US-88OO1O2216 Call Girls In Mahipalpur Female Escort Service
Call US-88OO1O2216 Call Girls In Mahipalpur Female Escort Service
 
Ten Organizational Design Models to align structure and operations to busines...
Ten Organizational Design Models to align structure and operations to busines...Ten Organizational Design Models to align structure and operations to busines...
Ten Organizational Design Models to align structure and operations to busines...
 
Enjoy ➥8448380779▻ Call Girls In Sector 18 Noida Escorts Delhi NCR
Enjoy ➥8448380779▻ Call Girls In Sector 18 Noida Escorts Delhi NCREnjoy ➥8448380779▻ Call Girls In Sector 18 Noida Escorts Delhi NCR
Enjoy ➥8448380779▻ Call Girls In Sector 18 Noida Escorts Delhi NCR
 
Buy gmail accounts.pdf Buy Old Gmail Accounts
Buy gmail accounts.pdf Buy Old Gmail AccountsBuy gmail accounts.pdf Buy Old Gmail Accounts
Buy gmail accounts.pdf Buy Old Gmail Accounts
 
NewBase 19 April 2024 Energy News issue - 1717 by Khaled Al Awadi.pdf
NewBase  19 April  2024  Energy News issue - 1717 by Khaled Al Awadi.pdfNewBase  19 April  2024  Energy News issue - 1717 by Khaled Al Awadi.pdf
NewBase 19 April 2024 Energy News issue - 1717 by Khaled Al Awadi.pdf
 
PSCC - Capability Statement Presentation
PSCC - Capability Statement PresentationPSCC - Capability Statement Presentation
PSCC - Capability Statement Presentation
 
Innovation Conference 5th March 2024.pdf
Innovation Conference 5th March 2024.pdfInnovation Conference 5th March 2024.pdf
Innovation Conference 5th March 2024.pdf
 
APRIL2024_UKRAINE_xml_0000000000000 .pdf
APRIL2024_UKRAINE_xml_0000000000000 .pdfAPRIL2024_UKRAINE_xml_0000000000000 .pdf
APRIL2024_UKRAINE_xml_0000000000000 .pdf
 
Traction part 2 - EOS Model JAX Bridges.
Traction part 2 - EOS Model JAX Bridges.Traction part 2 - EOS Model JAX Bridges.
Traction part 2 - EOS Model JAX Bridges.
 
8447779800, Low rate Call girls in New Ashok Nagar Delhi NCR
8447779800, Low rate Call girls in New Ashok Nagar Delhi NCR8447779800, Low rate Call girls in New Ashok Nagar Delhi NCR
8447779800, Low rate Call girls in New Ashok Nagar Delhi NCR
 
Fordham -How effective decision-making is within the IT department - Analysis...
Fordham -How effective decision-making is within the IT department - Analysis...Fordham -How effective decision-making is within the IT department - Analysis...
Fordham -How effective decision-making is within the IT department - Analysis...
 
Cybersecurity Awareness Training Presentation v2024.03
Cybersecurity Awareness Training Presentation v2024.03Cybersecurity Awareness Training Presentation v2024.03
Cybersecurity Awareness Training Presentation v2024.03
 
8447779800, Low rate Call girls in Saket Delhi NCR
8447779800, Low rate Call girls in Saket Delhi NCR8447779800, Low rate Call girls in Saket Delhi NCR
8447779800, Low rate Call girls in Saket Delhi NCR
 
Church Building Grants To Assist With New Construction, Additions, And Restor...
Church Building Grants To Assist With New Construction, Additions, And Restor...Church Building Grants To Assist With New Construction, Additions, And Restor...
Church Building Grants To Assist With New Construction, Additions, And Restor...
 
Flow Your Strategy at Flight Levels Day 2024
Flow Your Strategy at Flight Levels Day 2024Flow Your Strategy at Flight Levels Day 2024
Flow Your Strategy at Flight Levels Day 2024
 

Data Visualization Techniques for Analysis and Communication

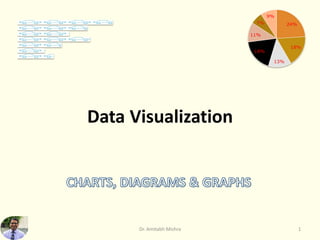
  • 1. Data Visualization Dr. Amitabh Mishra 1 24% 18% 13% 18% 11% 7% 9%
  • 2. Data Visualization or Presentation • Data visualization means- “to convey information through visual representations” • Visalisation tools produces “interactive visual representations of data to reinforce human cognition; enabling the viewer to gain knowledge about the internal structure of the data and causal relationships in it” Dr. Amitabh Mishra 2
  • 3. Significance of Visualization/ Presentation • They give a bird’s eye view of entire data • They are attractive to the eye • They have great memorizing effect • They facilitate comparison • They give visual indications of – Magnitudes, – Grouping, – Trends and patterns Dr. Amitabh Mishra 3
  • 4. Functions of Visualization/ Presentation • Three functions of visualization are: – Record i.e. Store information – Analyze i.e. Support reasoning about information – Communicate i.e. Convey information to others Dr. Amitabh Mishra 4
  • 5. Tools for Visualization (Diagrammatic & Graphic Representation) Visualization/ Representation Diagrammatic Representation Bar-diagram Pie-chart Pictogram Graphic Representation Histogram Frequency Polygon Smoothed Frequency Curve Cumulative Frequency Curve (Ogive) Dr. Amitabh Mishra 5
  • 6. Tools for Visualization (Diagrammatic & Graphic Representation) • Diagrammatic Representation a) Bar-diagram (One dimensional diagram) b) Pie-chart (Two dimensional diagram) c) Pictogram/ Cartograms (Statistical Maps) • Graphic Representation a) Histogram b) Frequency Polygon c) Smoothed Frequency Curve d) Cumulative Frequency Curve (Ogive) Dr. Amitabh Mishra 6
  • 7. DIAGRAMMATIC REPRESENTATION Dr. Amitabh Mishra 7 -20% 0% 20% 40% 60% 80% 100% 1986 1987 1988 profit/loss polishing other cost wages
  • 8. Types of Diagram Dr. Amitabh Mishra 8 Diagrammatic Representation Bar-diagram (One Dimensional Diagram) Pie-chart (Two Dimensional Diagram Pictogram/Cartograms (Statistical Maps)
  • 9. BAR DIAGRAM One Dimensional Diagram Dr. Amitabh Mishra 9 0 100 200 300 400 500 600 700 1993-94 1994-95 1995-95 Rs lakhs years
  • 10. Bar Diagram • “Bar-Diagram are vertical lines where length of the bars are proportional to their corresponding numerical values”. • “Bar is a thick line whose width is shown merely for attention”. – But, all bars should have the same width so as not to confuse the reader of diagram. • It is called one dimensional diagram because it is only length of bar which matters not the width. Dr. Amitabh Mishra 10
  • 11. • Width of bars should be uniform through out the diagram • The gap between one diagram and other should be uniform • Bars may be either – Horizontal or – Vertical • The vertical bars should be preferred because they give a better look Dr. Amitabh Mishra 11 C4 1Q 4Q 3Q 2Q 1Q 1.5 1.2 0.9 0.6 0.3 0.0 Figure 1-11:SHIFTINGGEARS 2003 2004 Quartely netincome for General Motors (inbillions)
  • 12. Types of Bar Diagram Dr. Amitabh Mishra 12 Bar Diagram Simple bar diagram Sub-divided Bar diagram Multiple-bars diagram Percentage-bar diagram Deviation bars diagram
  • 13. Types of Bar Diagram 1. Simple bar diagram 2. Sub-divided Bar diagram 3. Multiple-bars diagram 4. Percentage-bar diagram 5. Deviation bars. Dr. Amitabh Mishra 13
  • 14. Simple Bar diagram • It is used to represent only one variable • Ex- – Figures of sales for various years – Figures of production for various years – Figures of population for various years Dr. Amitabh Mishra 14
  • 15. • Following table gives birth rate per thousand of different countries over a period of time. Dr. Amitabh Mishra 15 0 5 10 15 20 25 30 35 40 45 india germany united kingdom china new zeland swedan birth rate per thousand of different countries Country Birth rate India 33 Germany 16 U.K 20 China 40 Newzealand 30 Swedan 15
  • 16. Example 2: Fund flow for various years may be shown by means of a simple bar-diagram Year Funds Flow (Rs. crores) 2009-10 85.80 2010-11 109.61 2011-22 204.29 2012-13 126.31 Dr. Amitabh Mishra 16 0 50 100 150 200 250 2009-10 2010-11 2011-12 2012-13 Funds Flow Funds Flow
  • 17. Exercise: 1 Prepare a Simple bar diagram for your internal and external marks in previous semester examination Subject Name External Marks Internal Marks Total Marks Marketing 67 30 97 Organizational Behavior 55 25 80 Accounting 45 20 65 Computer Application 60 28 88 Statistics 39 21 60 Production & Operations 48 25 73 Dr. Amitabh Mishra 17 0 10 20 30 40 50 60 70 80 Marketing Organizational Accounting Computer Application Statistics Production & Operations Marketing Organizati onal Accounting Computer Application Statistics Production & Operations External Marks 67 55 45 60 39 48 External Marks
  • 18. Sub-divided Bar Diagram • “In Sub divided Bar Diagram each bar representing the magnitude of given phenomenon is further subdivided in its various components”. • Each component occupies a part of the bar proportional to its share in total. Dr. Amitabh Mishra 18
  • 19. • The growth of production of fish for the period 1950-51 to 1986-87 is- (In lakh tonnes). Dr. Amitabh Mishra 19 0 5 10 15 20 25 30 35 1950-51 1960-61 1970-71 1980-81 1984-85 1985-86 PRODUCTION OF FISH YEARS inland marine Year Marine Inland total 1950-51 5.34 2.18 7.52 1960-61 8.80 2.80 11.60 1970-71 10.86 6.70 17.56 1980-81 15.55 8.87 24.42 1984-85 16.98 11.03 28.01 1985-86 17.16 11.60 28.76 1986-87 12.47 8.42 20.89
  • 20. Exercise Prepare a sub-divided bar diagram for your internal and external marks in previous semester examination Subject Name External Marks Internal Marks Total Marks Marketing 67 30 97 Organizational Behavior 55 25 80 Accounting 45 20 65 Computer Application 60 28 88 Statistics 39 21 60 Production & Operations 48 25 73 Dr. Amitabh Mishra 20 Marketi ng Org Beha Accoun ting Comp App Statistic s Pro & Oper Internal 30 25 20 28 21 25 External 67 55 45 60 39 48 0 20 40 60 80 100 120 MArks internal and external marks
  • 21. Multiple-bars diagram • In multiple bars “two or more set of interrelated data are represented”. • This diagram should be preferred, when ever comparison between two or more related variables is to be made. Dr. Amitabh Mishra 21
  • 22. 0 20 40 60 80 100 120 140 160 1984 1985 1986 1987 sales gross profit net profit Dr. Amitabh Mishra 22 • Draw a suitable diagram from the following data- Year Sales Gross profit Net profit 1984 120 40 20 1985 135 45 20 1986 140 55 35 1987 150 60 40
  • 23. 2002-03 2003-04 Gross profits Profits before tax Profit after tax Retained profits 3104 1663 1219 846 3123 1376 982 589 Dr. Amitabh Mishra 23 3104 3123 1663 1376 1219 982 846 589 0 500 1000 1500 2000 2500 3000 3500 2002-03 2003-04 Gross Profits Profits Before Tax Profit After Tax Retained Profits
  • 24. Percentage-bar diagram • “Sub-divided bar chart drawn on percentage basis is known as percentage bar diagram”. • In Percentage bar diagram, we express each component as the percentage of its respective total. • Bars of length equal to 100 for each class are drawn at first step and sub-divided in the proportion of the percentage of their component in the second step. Dr. Amitabh Mishra 24
  • 25. • Represent the following by sub divided bar diagram on percentage basis- Dr. Amitabh Mishra 25 Particulars 1986 1987 1988 Cost/chair Wages 9 15 21 Other costs 6 10 14 Polishing 3 5 7 Total 18 30 42 Proceeds /chair 20 30 40 Profit/loss +2 - -2
  • 26. Particulars 1986 1987 1988 Cost/chair Wages 45 50 52.5 Other costs 30 33.3 35 Polishing 15 16.7 17.5 Total cost 90 100 105 Sales price 100 100 100 Profit/loss +10 - -5.0 -20% 0% 20% 40% 60% 80% 100% 1986 1987 1988 profit/loss polishing other cost wages Dr. Amitabh Mishra 26 Take the sales price/chair as 100 and express the other figures in percentages. The percentages so obtained are given below-
  • 27. Items Expenses % Expense s Food Clothing House Rent Education 5550 5100 4800 4950 27.21% 25% 23.53% 24.26% Total 20400 100% Dr. Amitabh Mishra 27 27.21 25 24.26 23.53 0% 10% 20% 30% 40% 50% 60% 70% 80% 90% 100% %Expenses education house rent clothing food
  • 28. Deviation Bar-diagram • Deviation bars are popularly used for representing net quantity- excess or deficit i.e. – Net profit, – Net loss, – Net exports, or – Net imports, etc. • Such bars can have both positive and negative values. Positive values are shown above the base line and negative values below it. Dr. Amitabh Mishra 28
  • 29. Year Sales Net profits 2011-12 14% 29% 2012-13 11% 61% 2013-14 17% -21% -30% -20% -10% 0% 10% 20% 30% 40% 50% 60% 70% sales net profit 2001-02 2002-03 2003-04 Dr. Amitabh Mishra 29 2001-02 2002-03 2003-04 sales 14% 11% 17% net profit 29% 61% -21%
  • 30. Two dimensional diagram or Surface Diagram/ Area Diagram 1. Pie diagrams. Dr. Amitabh Mishra 30
  • 31. Pie Charts or Round 1st Qtr 2nd Qtr 3rd Qtr 4th Qtr Dr. Amitabh Mishra 31
  • 32. • “A pie chart is a circular chart in which the circle is divided into sectors. Each sector visually represents an item in a data set to match the amount of the item as a percentage or fraction of the total data set”. • Pie charts are useful to compare different parts of a whole amount. Dr. Amitabh Mishra 32
  • 33. • A pie chart is not useful for displaying relationships over time or relationships among several variables. • A pie chart should not require more than seven sections. • The steps to draw a pie diagram are: – Convert the various observations (in percent) in the data set into corresponding degree in the circle by multiplying each by 3.6 (360 /100) – Draw the circle and its parts using different degrees 33 Dr. Amitabh Mishra
  • 34. Example • Draw a pie chart for the following data of 6th five year plan public sector outlays: Dr. Amitabh Mishra 34 Sector Percentage outlay Agricultural and rural development 12.9% Irrigation etc. 12.5% Energy 27.2% Industry and mineral 15.4% Transport, communication etc. 15.9% Social service and other 16.1%
  • 35. The angle at the centre is given by- =(Percentage outlay/100)x 360 = Percentage outlay x 3.6 Dr. Amitabh Mishra 35 Sector Percentage outlay Angle at the centre Agricultural and rural development 12.9% 12.9 x 3.6 = 46° Irrigation etc. 12.5% 12.5 x 3.6 = 45° Energy 27.2% 27.2 x 3.6 =98° Industry and mineral 15.4% 15.4 x 3.6 = 56° Transport, communication etc. 15.9% 15.9 x 3.6 = 57° Social service and other 16.1% 16.1 x 3.6 = 58° Total 100% 360°
  • 36. Dr. Amitabh Mishra 36 13% 13% 15% 16% 16% 27% Percentage outlay Agricultural and rural development Industry and mineral Transport, communication etc. Social service and other Energy
  • 37. U.S. Auto Sales 2003 - 2007 37 Dr. Amitabh Mishra
  • 38. Pie Chart of 2007 U.S. Auto Sales 24% 18% 13% 18% 11% 7% 9% GM Ford Chrysler Toyota Honda Nissan Other 38 Dr. Amitabh Mishra
  • 39. 46% 27% 19% 5% 3% Column2 Pacific Atlantic Indian Antarctic arctic Dr. Amitabh Mishra 39 Ocean Area % Area Degree Pacific Atlantic Indian Antarctic arctic 70.8 41.2 28.5 7.6 4.8 46.31 26.94 18.64 4.96 3.15 166.70 97.00 67.10 17.89 11.31 Total 152.9 100.00 360.00
  • 40. Pictographs • “A pictograph uses small pictures or symbols to display the data”. • Pictographs do not depict results precisely. Hence, caution should be exercised when using them. • To construct pictograms the following suggestions are made: – The symbols must be simple and clear. – The quantity represented by a symbol should be given. 40 Dr. Amitabh Mishra
  • 41. Pictograph for 2007 U.S. Auto Sales *Each Symbol Equals 1,000,000 Units GM Chrysler Toyota Honda Nissan Other Ford 41 Dr. Amitabh Mishra
  • 42. Dr. Amitabh Mishra 42 Example of pictogram: Year Output 1999 2000 2001 2002 2004 2996 4052 5924 Output of cars during the year by a car manufacturing company: 1999 2000 2001 2002 Scale = 1000 cars
  • 43. Types of Graphs graphs Graphs of time series or Line graphs Graph of frequency distribution Dr. Amitabh Mishra 43
  • 44. Line graphs or graph of time series • Graph of one variable. • Graph of two or more variables. • Graph having two scales. • Range chart • Band graph. • Ratio chart. Dr. Amitabh Mishra 44
  • 45. Graph of frequency distribution • Histogram • Frequency Polygon. • Smoothed frequency curve. • Ogives or cumulative frequency curves. Dr. Amitabh Mishra 45
  • 46.  A histogram is a chart made of bars of different heights. Widths and locations of bars correspond to widths and locations of data groupings Heights of bars correspond to frequencies or relative frequencies of data groupings Histogram 46 Dr. Amitabh Mishra
  • 48. Relative Frequency Histogram Histogram Example 48 Dr. Amitabh Mishra
  • 49. Figure 23.6 Histogram of 2007 U.S. Auto Sales 0 500,000 1,000,000 1,500,000 2,000,000 2,500,000 3,000,000 3,500,000 4,000,000 4,500,000 GM Ford Chrysler Toyota Honda Nissan other 49 Dr. Amitabh Mishra
  • 50.  Pie Charts Categories represented as percentages of total  Bar Graphs Heights of rectangles represent group frequencies  Frequency Polygons Height of line represents frequency  Ogives Height of line represents cumulative frequency  Time Plots Represents values over time 1-8 Methods of Displaying Data 50 Dr. Amitabh Mishra
  • 51. Pie Chart 33.0% 23.0% 19.0% 19.0% 6.0% Category Happy with career Don't like my job but it is on my career path Job is OK, but it is not on my career path Enjoy job, but it is not on my career path My job just pays the bills Figure 1-10: Twentysomethings split on job satisfication My job just pays the bills Happy with career Enjoy job, but it is not on my career path Job OK, but it is not on my career path Do not like my job, but it is on my career path 51 Dr. Amitabh Mishra
  • 52. Relative Frequency Polygon Ogive Frequency Polygon and Ogive 50 40 30 20 10 0 0.3 0.2 0.1 0.0 Sales 50 40 30 20 10 0 1.0 0.5 0.0 Sales (Cumulative frequency or relative frequency graph) 52 Dr. Amitabh Mishra
  • 54. Scatter Plots • Scatter Plots are used to identify and report any underlying relationships among pairs of data sets. • The plot consists of a scatter of points, each point representing an observation. 54 Dr. Amitabh Mishra
  • 55. Scatter Plots • Scatter plot with trend line. • This type of relationship is known as a positive correlation. Correlation will be discussed in later chapters. 55 Dr. Amitabh Mishra
  • 56. U.S. Auto Sales 2003 - 2007 56 Dr. Amitabh Mishra
  • 57. Guidelines for Graphs: Line Charts • A line chart connects a series of data points using continuous lines. • This is an attractive way of illustrating trends and changes over time. • Several series can be compared on the same chart, and forecasts, interpolations, and extrapolations can be shown. 57 Dr. Amitabh Mishra
  • 58. Line Chart of Total U.S. Auto Sales Fig. 23.3 0 500000 1000000 1500000 2000000 2500000 3000000 3500000 4000000 4500000 5000000 2003 2004 2005 2006 2007 Unit Sales Year GM Ford Chrysler Toyota Honda Nissan Other 58 Dr. Amitabh Mishra
  • 59. Guidelines for Graphs: Line Charts • A stratum chart is a set of line charts in which the data are successively aggregated over the series. • Areas between the line charts display the magnitudes of the relevant variables. 59 Dr. Amitabh Mishra
  • 60. Fig. 23.4 Stratum Chart of Total U.S. Auto Sales 0 2000000 4000000 6000000 8000000 10000000 12000000 14000000 16000000 18000000 20000000 2003 2004 2005 2006 2007 Unit Sales Year Other Nissan Honda Toyota Chrysler Ford GM 60 Dr. Amitabh Mishra
  • 61. Guidelines for Graphs: Histograms and Bar Charts • A bar chart displays data in various bars that may be positioned horizontally or vertically. • The histogram is a vertical bar chart in which the height of the bars represents the relative or cumulative frequency of occurrence of a specific variable. 61 Dr. Amitabh Mishra