SlideShare a Scribd company logo
1 of 10
Download to read offline
© 4th ed. 2006 Dr. Rick Yount Tables 
Critical Value Tables 
z-Distribution Table 
Critical Value Table 
for the z-Test 
Chapters 17-19 
0.00 0.01 0.02 0.03 0.04 0.05 0.06 0.07 0.08 0.09 
z 
0.0 0.0000 0.0040 0.0080 0.0120 0.0160 0.0199 0.0239 0.0279 0.0319 0.0359 
0.1 0.0398 0.0438 0.0478 0.0517 0.0557 0.0596 0.0636 0.0675 0.0714 0.0753 
0.2 0.0793 0.0832 0.0871 0.0910 0.0948 0.0987 0.1026 0.1064 0.1103 0.1141 
0.3 0.1179 0.1217 0.1255 0.1293 0.1331 0.1368 0.1406 0.1443 0.1480 0.1517 
0.4 0.1554 0.1591 0.1628 0.1664 0.1700 0.1736 0.1772 0.1808 0.1844 0.1879 
0.5 0.1915 0.1950 0.1985 0.2019 0.2054 0.2088 0.2123 0.2157 0.2190 0.2224 
0.6 0.2257 0.2291 0.2324 0.2357 0.2389 0.2422 0.2454 0.2486 0.2517 0.2549 
0.7 0.2580 0.2611 0.2642 0.2673 0.2704 0.2734 0.2764 0.2794 0.2823 0.2852 
0.8 0.2881 0.2910 0.2939 0.2967 0.2995 0.3023 0.3051 0.3078 0.3106 0.3133 
0.9 0.3159 0.3186 0.3212 0.3238 0.3264 0.3289 0.3315 0.3340 0.3365 0.3389 
1.0 0.3413 0.3438 0.3461 0.3485 0.3508 0.3531 0.3554 0.3577 0.3599 0.3621 
1.1 0.3643 0.3665 0.3686 0.3708 0.3729 0.3749 0.3770 0.3790 0.3810 0.3830 
1.2 0.3849 0.3869 0.3888 0.3907 0.3925 0.3944 0.3962 0.3980 0.3997 0.4015 
1.3 0.4032 0.4049 0.4066 0.4082 0.4099 0.4115 0.4131 0.4147 0.4162 0.4177 
1.4 0.4192 0.4207 0.4222 0.4236 0.4251 0.4265 0.4279 0.4292 0.4306 0.4319 
1.5 0.4332 0.4345 0.4357 0.4370 0.4382 0.4394 0.4406 0.4418 0.4429 0.4441 
1.6 0.4452 0.4463 0.4474 0.4484 0.4495 0.4505 0.4515 0.4525 0.4535 0.4545 
1.7 0.4554 0.4564 0.4573 0.4582 0.4591 0.4599 0.4608 0.4616 0.4625 0.4633 
1.8 0.4641 0.4649 0.4656 0.4664 0.4671 0.4678 0.4686 0.4693 0.4699 0.4706 
1.9 0.4713 0.4719 0.4726 0.4732 0.4738 0.4744 0.4750 0.4756 0.4761 0.4767 
2.0 0.4772 0.4778 0.4783 0.4788 0.4793 0.4798 0.4803 0.4808 0.4812 0.4817 
2.1 0.4821 0.4826 0.4830 0.4834 0.4838 0.4842 0.4846 0.4850 0.4854 0.4857 
2.2 0.4861 0.4864 0.4868 0.4871 0.4875 0.4878 0.4881 0.4884 0.4887 0.4890 
2.3 0.4893 0.4896 0.4898 0.4901 0.4904 0.4906 0.4909 0.4911 0.4913 0.4916 
2.4 0.4918 0.4920 0.4922 0.4925 0.4927 0.4929 0.4931 0.4932 0.4934 0.4936 
2.5 0.4938 0.4940 0.4941 0.4943 0.4945 0.4946 0.4948 0.4949 0.4951 0.4952 
2.6 0.4953 0.4955 0.4956 0.4957 0.4959 0.4960 0.4961 0.4962 0.4963 0.4964 
2.7 0.4965 0.4966 0.4967 0.4968 0.4969 0.4970 0.4971 0.4972 0.4973 0.4974 
2.8 0.4974 0.4975 0.4976 0.4977 0.4977 0.4978 0.4979 0.4979 0.4980 0.4981 
2.9 0.4981 0.4982 0.4982 0.4983 0.4983 0.4984 0.4985 0.4985 0.4986 0.4986 
3.0 0.4987 0.4987 0.4987 0.4988 0.4988 0.4988 0.4989 0.4989 0.4990 0.4990 
3.1 0.49903 
3.2 0.49931 
3.3 0.49952 
3.4 0.49962 
3.5 0.49977 
3.6 0.49984 
3.7 0.49989 
3.8 0.49993 
3.9 0.49995 
4.0 0.50000 
A3-1 
Example 
The horizontal shading above represents z = 1.9 
The vertical shading above represents z = +.06 
Where they meet represents z = 1.96 
The area between the 
mean and z = 1.96 equals 0.4750. 
Adapted from Robert Johnson, Elementary Statistics, 6th ed. (Boston: PWS-KENT Publishing Company, 1992), F-8
Research Design and Statistical Analysis in Christian Ministry © 4th ed. 2006 Dr. Rick Yount 
Critical Value Table 
for the t-Tests 
Chapters 19-20 
A3-2 
t-Distribution Table 
df 0.05 0.025 0.01 0.005 
1 6.314 12.706 31.821 63.657 
2 2.920 4.303 6.965 9.925 
3 2.353 3.182 4.541 5.841 
4 2.132 2.776 3.747 4.604 
5 2.015 2.571 3.365 4.032 
6 1.943 2.447 3.143 3.707 
7 1.895 2.365 2.998 3.499 
8 1.860 2.306 2.896 3.355 
9 1.833 2.262 2.821 3.250 
10 1.812 2.228 2.764 3.169 
11 1.796 2.201 2.718 3.106 
12 1.782 2.179 2.681 3.055 
13 1.771 2.160 2.650 3.012 
14 1.761 2.145 2.624 2.977 
15 1.753 2.131 2.602 2.947 
16 1.746 2.120 2.583 2.921 
17 1.740 2.110 2.567 2.898 
18 1.734 2.101 2.552 2.878 
19 1.729 2.093 2.539 2.861 
20 1.725 2.086 2.528 2.845 
21 1.721 2.080 2.518 2.831 
22 1.717 2.074 2.508 2.819 
23 1.714 2.069 2.500 2.807 
24 1.711 2.064 2.492 2.797 
25 1.708 2.060 2.485 2.787 
26 1.706 2.056 2.479 2.779 
27 1.703 2.052 2.473 2.771 
28 1.701 2.048 2.467 2.763 
29 1.699 2.045 2.462 2.756 
30 1.697 2.042 2.457 2.750 
40 1.684 2.021 2.423 2.704 
50 1.676 2.009 2.403 2.678 
100 1.660 1.984 2.364 2.626 
∞∞∞∞ 1.645 1.960 2.326 2.576 
Adapted from David Howell, Statistical Methods for Psychology (Boston: Duxbury Press, 1982), 521 
one sample t 
df = n-1 
independent samples t 
df = nx + ny - 2 
matched samples t 
df = n-2 pairs
© 4th ed. 2006 Dr. Rick Yount Tables 
χ2 Distribution Table 
df 0.05 0.025 0.01 0.005 
1 3.84 5.02 6.63 7.88 
2 5.99 7.38 9.21 10.60 
3 7.82 9.35 11.35 12.84 
4 9.49 11.14 13.28 14.86 
5 11.07 12.83 15.09 16.75 
6 12.59 14.45 16.81 18.55 
7 14.07 16.01 18.48 20.28 
8 15.51 17.54 20.09 21.96 
9 16.92 19.02 21.66 23.59 
10 18.31 20.48 23.21 25.19 
11 19.68 21.92 24.72 26.75 
12 21.03 23.34 26.21 28.30 
13 22.36 24.74 27.69 29.82 
14 23.69 26.12 29.14 31.31 
15 25.00 27.49 30.58 32.80 
16 26.30 28.85 32.00 34.27 
17 27.59 30.19 33.41 35.72 
18 28.87 31.53 34.81 37.15 
19 30.14 32.85 36.19 38.58 
20 31.41 34.17 37.56 40.00 
21 32.67 35.48 38.93 41.40 
22 33.93 36.78 40.29 42.80 
23 35.17 38.08 41.64 44.18 
24 36.42 39.37 42.98 45.56 
25 37.65 40.65 44.32 46.93 
26 38.89 41.92 45.64 48.29 
27 40.11 43.20 46.96 49.64 
28 41.34 44.46 48.28 50.99 
29 42.56 45.72 49.59 52.34 
30 43.77 46.98 50.89 53.67 
40 55.75 59.34 63.71 66.80 
50 67.50 71.42 76.17 79.52 
100 124.34 129.56 135.82 140.19 
A3-3 
Critical Value Table 
for the Chi-Square Tests 
Chapter 23 
Goodness of Fit 
df = k-1 
Test of Independence 
df = (r-1)(c-1) 
Adapted from David Howell, Statistical Methods for Psychology (Boston: Duxbury Press, 1982), 521
Research Design and Statistical Analysis in Christian Ministry © 4th ed. 2006 Dr. Rick Yount 
Critical Value Table 
for the Analysis of Variance Test 
Chapter 21 
A3-4 
F-Distribution Table 
Degrees of Freedom for the F-Ratio numera-tor 
Degrees of Freedom for the F-Ratio denominator 
αααα = 0.05 
1 2 3 4 5 6 7 8 9 10 
1 161.4 199.5 215.8 224.8 230.0 233.8 236.5 238.6 240.1 242.1 
2 18.51 19.00 19.16 19.25 19.30 19.33 19.35 19.37 19.38 19.40 
3 10.13 9.55 9.28 9.12 9.01 8.94 8.89 8.85 8.81 8.79 
4 7.71 6.94 6.59 6.39 6.26 6.16 6.09 6.04 6.00 5.96 
5 6.61 5.79 5.41 5.19 5.05 4.95 4.88 4.82 4.77 4.74 
6 5.99 5.14 4.76 4.53 4.39 4.28 4.21 4.15 4.10 4.06 
7 5.59 4.74 4.35 4.12 3.97 3.87 3.79 3.73 3.68 3.64 
8 5.32 4.46 4.07 3.84 3.69 3.58 3.50 3.44 3.39 3.35 
9 5.12 4.26 3.86 3.63 3.48 3.37 3.29 3.23 3.18 3.14 
10 4.96 4.10 3.71 3.48 3.33 3.22 3.14 3.07 3.02 2.98 
11 4.84 3.98 3.59 3.36 3.20 3.09 3.01 2.95 2.90 2.85 
12 4.75 3.89 3.49 3.26 3.11 3.00 2.91 2.85 2.80 2.75 
13 4.67 3.81 3.41 3.18 3.03 2.92 2.83 2.77 2.71 2.67 
14 4.60 3.74 3.34 3.11 2.96 2.85 2.76 2.70 2.65 2.60 
15 4.54 3.68 3.29 3.06 2.90 2.79 2.71 2.64 2.59 2.54 
16 4.49 3.63 3.24 3.01 2.85 2.74 2.66 2.59 2.54 2.49 
17 4.45 3.59 3.20 2.96 2.81 2.70 2.61 2.55 2.49 2.45 
18 4.41 3.55 3.16 2.93 2.77 2.66 2.58 2.51 2.46 2.41 
19 4.38 3.52 3.13 2.90 2.74 2.63 2.54 2.48 2.42 2.38 
20 4.35 3.49 3.10 2.87 2.71 2.60 2.51 2.45 2.39 2.35 
22 4.30 3.44 3.05 2.82 2.66 2.55 2.46 2.40 2.34 2.30 
24 4.26 3.40 3.01 2.78 2.62 2.51 2.42 2.36 2.30 2.25 
26 4.23 3.37 2.98 2.74 2.59 2.47 2.39 2.32 2.27 2.22 
28 4.20 3.34 2.95 2.71 2.56 2.45 2.36 2.29 2.24 2.19 
30 4.17 3.32 2.92 2.69 2.53 2.42 2.33 2.27 2.21 2.16 
40 4.08 3.23 2.84 2.61 2.45 2.34 2.25 2.18 2.12 2.08 
50 4.03 3.18 2.79 2.56 2.40 2.29 2.20 2.13 2.07 2.03 
60 4.00 3.15 2.76 2.53 2.37 2.25 2.17 2.10 2.04 1.99 
120 3.92 3.07 2.68 2.45 2.29 2.18 2.09 2.02 1.96 1.91 
200 3.89 3.04 2.65 2.42 2.26 2.14 2.06 1.98 1.93 1.88 
500 3.86 3.01 2.62 2.39 2.23 2.12 2.03 1.96 1.90 1.85 
1000 3.85 3.01 2.61 2.38 2.22 2.11 2.02 1.95 1.89 1.84 
Adapted from David Howell, Statistical Methods for Psychology (Boston: Duxbury Press, 1982), 524
© 4th ed. 2006 Dr. Rick Yount Tables 
F-Distribution Table 
A3-5 
Degrees of Freedom for the F-Ratio numera-tor 
Critical Value Table 
for the Analysis of Variance Test 
Chapter 21 
Degrees of Freedom for the F-Ratio denominator 
αααα = 0.01 
1 2 3 4 5 6 7 8 9 10 
1 4048 4993 5377 5577 5668 5924 5992 6096 6132 6168 
2 98.50 99.01 99.15 99.23 99.30 99.33 99.35 99.39 99.40 99.43 
3 34.12 30.82 29.46 28.71 28.24 27.91 27.67 27.49 27.34 27.23 
4 21.20 18.00 16.69 15.98 15.52 15.21 14.98 14.80 14.66 14.55 
5 16.26 13.27 12.06 11.39 10.97 10.67 10.46 10.29 10.16 10.05 
6 13.75 10.92 9.78 9.15 8.75 8.47 8.26 8.10 7.98 7.87 
7 12.25 9.55 8.45 7.85 7.46 7.19 6.99 6.84 6.72 6.62 
8 11.26 8.65 7.59 7.01 6.63 6.37 6.18 6.03 5.91 5.81 
9 10.56 8.02 6.99 6.42 6.06 5.80 5.61 5.47 5.35 5.26 
10 10.04 7.56 6.55 5.99 5.64 5.39 5.20 5.06 4.94 4.85 
11 9.65 7.21 6.22 5.67 5.32 5.07 4.89 4.74 4.63 4.54 
12 9.33 6.93 5.95 5.41 5.06 4.82 4.64 4.50 4.39 4.30 
13 9.07 6.70 5.74 5.21 4.86 4.62 4.44 4.30 4.19 4.10 
14 8.86 6.51 5.56 5.04 4.69 4.46 4.28 4.14 4.03 3.94 
15 8.68 6.36 5.42 4.89 4.56 4.32 4.14 4.00 3.89 3.80 
16 8.53 6.23 5.29 4.77 4.44 4.20 4.03 3.89 3.78 3.69 
17 8.40 6.11 5.18 4.67 4.34 4.10 3.93 3.79 3.68 3.59 
18 8.29 6.01 5.09 4.58 4.25 4.01 3.84 3.71 3.60 3.51 
19 8.18 5.93 5.01 4.50 4.17 3.94 3.77 3.63 3.52 3.43 
20 8.10 5.85 4.94 4.43 4.10 3.87 3.70 3.56 3.46 3.37 
22 7.95 5.72 4.82 4.31 3.99 3.76 3.59 3.45 3.35 3.26 
24 7.82 5.61 4.72 4.22 3.90 3.67 3.50 3.36 3.26 3.17 
26 7.72 5.53 4.64 4.14 3.82 3.59 3.42 3.29 3.18 3.09 
28 7.64 5.45 4.57 4.07 3.75 3.53 3.36 3.23 3.12 3.03 
30 7.56 5.39 4.51 4.02 3.70 3.47 3.30 3.17 3.07 2.98 
40 7.31 5.18 4.31 3.83 3.51 3.29 3.12 2.99 2.89 2.80 
50 7.17 5.06 4.20 3.72 3.41 3.19 3.02 2.89 2.78 2.70 
60 7.08 4.98 4.13 3.65 3.34 3.12 2.95 2.82 2.72 2.63 
120 6.85 4.79 3.95 3.48 3.17 2.96 2.79 2.66 2.56 2.47 
200 6.76 4.71 3.88 3.41 3.11 2.89 2.73 2.60 2.50 2.41 
500 6.69 4.65 3.82 3.36 3.05 2.84 2.68 2.55 2.44 2.36 
1000 6.67 4.63 3.80 3.34 3.04 2.82 2.66 2.53 2.43 2.34 
Adapted from David Howell, Statistical Methods for Psychology (Boston: Duxbury Press, 1982), 526
Research Design and Statistical Analysis in Christian Ministry © 4th ed. 2006 Dr. Rick Yount 
Critical Value Table 
for the Wilcoxin Rank-Sum Ordinal Test 
Chapter 24 
A3-6 
Wilcoxin Ws Distribution Table 
N1 = 5 N1 = 6 
N2 0.5 1.0 2.5 5.0% 0.5 1.0 2.5 5.0% 
5 15 16 17 19 . . . . 
6 16 17 18 20 23 24 26 28 
7 16 16 18 21 24 25 27 29 
8 17 19 21 23 25 27 29 31 
9 18 20 22 24 26 28 31 33 
10 19 21 23 26 27 29 32 35 
11 20 22 24 27 28 30 34 37 
12 21 23 26 28 30 32 35 38 
13 22 24 27 30 31 33 37 40 
14 22 25 28 31 32 34 38 42 
15 23 26 29 33 33 36 40 44 
16 24 27 30 34 34 37 42 46 
17 25 28 32 35 36 39 43 47 
18 26 29 33 37 37 40 45 49 
19 27 30 34 38 38 41 46 51 
20 28 31 35 40 39 43 48 53 
21 29 32 37 41 40 44 50 55 
22 29 33 38 43 42 45 51 57 
23 30 34 39 44 43 47 53 59 
24 31 35 40 45 44 48 54 60 
25 32 36 42 47 45 50 56 62 
N1 = 7 N1 = 8 
N2 0.5 1.0 2.5 5.0% 0.5 1.0 2.5 5.0% 
7 32 34 36 39 
8 34 35 38 41 43 45 49 51 
9 35 37 40 43 45 47 51 54 
10 37 39 42 45 47 49 53 56 
11 38 40 44 47 49 51 55 59 
12 40 42 46 49 51 53 58 62 
13 41 44 48 52 53 56 60 64 
14 43 45 50 54 54 58 62 67 
15 44 47 52 56 56 60 65 69 
16 46 49 54 58 58 62 67 72 
17 47 51 56 61 60 64 70 75 
18 49 52 58 63 62 66 72 77 
19 50 54 60 65 64 68 74 80 
20 52 56 62 67 66 70 77 83 
21 53 58 64 69 68 72 79 85 
22 55 59 66 72 70 74 81 88 
23 57 61 68 74 71 76 84 90 
24 58 63 70 76 73 78 86 93 
25 60 64 72 78 75 81 89 96 
.....continued in Howell to N1 = 25 
Adapted from David Howell, Statistical Methods for Psychology (Boston: Duxbury Press, 1982), 537-538
© 4th ed. 2006 Dr. Rick Yount Tables 
Wilcoxin T Distribution Table 
A3-7 
Critical Value Table 
for the Wilcoxin Matched Pairs Ordinal Test 
Chapter 24 
.05 .025 .01 .005 
number 
of pairs 
N T αααα T αααα T αααα T αααα 
5 0 .0313 
1 .0625 
6 2 .0469 0 .0156 
3 .0781 1 .0313 
7 3 .0391 2 .0234 0 .0078 
4 .0547 3 .0391 1 .0156 
8 5 .0391 3 .0195 1 .0078 0 .0039 
6 .0547 4 .0273 2 .0117 1 .0078 
9 8 .0488 5 .0195 3 .0098 1 .0039 
9 .0645 6 .0273 4 .0137 2 .0059 
10 10 .0420 8 .0244 5 .0098 3 .0049 
11 .0527 9 .0322 6 .0137 4 .0068 
11 13 .0415 10 .0210 7 .0093 5 .0049 
14 .0508 11 .0269 8 .0122 6 .0068 
12 17 .0461 13 .0212 9 .0081 7 .0046 
18 .0549 14 .0261 10 .0105 8 .0061 
13 21 .0471 17 .0239 12 .0085 9 .0040 
22 .0549 18 .0287 13 .0107 10 .0052 
14 25 .0453 21 .0247 15 .0083 12 .0043 
26 .0520 22 .0290 16 .0101 13 .0054 
15 30 .0473 25 .0240 19 .0090 15 .0042 
31 .0535 26 .0277 20 .0108 16 .0051 
16 35 .0467 29 .0222 23 .0091 19 .0046 
36 .0523 30 .0253 24 .0107 20 .0055 
17 41 .0492 34 .0224 27 .0087 23 .0047 
42 .0544 35 .0253 28 .0101 24 .0055 
18 47 .0494 40 .0241 32 .0091 27 .0045 
48 .0542 41 .0269 33 .0104 28 .0052 
19 53 .0478 46 .0247 37 .0090 32 .0047 
54 .0521 47 .0273 38 .0102 33 .0054 
20 60 .0487 52 .0242 43 .0096 37 .0047 
61 .0527 53 .0266 44 .0107 38 .0053 
.....continued in Howell to N = 50 
Adapted from David Howell, Statistical Methods for Psychology (Boston: Duxbury Press, 1982), 541
Research Design and Statistical Analysis in Christian Ministry © 4th ed. 2006 Dr. Rick Yount 
Critical Value Table 
for the Studentized-Range Statistic - Used with 
Chapter 24 
A3-8 
q-Distribution Table 
r = Number of Steps Between Ordered Means 
2 3 4 5 6 7 8 9 10 
1 17.97 26.98 32.82 37.08 40.41 43.12 45.40 47.36 49.07 
2 6.08 8.33 9.80 10.88 11.74 12.44 13.03 13.54 13.99 
3 4.50 5.91 6.82 7.50 8.04 8.48 8.85 9.18 9.46 
4 3.93 5.04 5.76 6.29 6.71 7.05 7.35 7.60 7.33 
5 3.64 4.60 5.22 5.67 6.03 6.33 6.58 6.80 7.00 
6 3.46 4.34 4.90 5.31 5.63 5.90 6.12 6.32 6.49 
7 3.34 4.16 4.68 5.06 5.36 5.61 5.82 6.00 6.16 
8 3.26 4.04 4.53 4.89 5.17 5.40 5.60 5.77 5.92 
9 3.20 3.95 4.42 4.76 5.02 5.24 5.43 5.60 5.74 
10 3.15 3.88 4.33 4.65 4.91 5.12 5.30 5.46 5.60 
11 3.11 3.82 4.26 4.57 4.82 5.03 5.20 5.35 5.49 
12 3.08 3.77 4.20 4.51 4.75 4.95 5.12 5.26 5.40 
13 3.06 3.74 4.15 4.45 4.69 4.88 5.05 5.19 5.32 
14 3.03 3.70 4.11 4.41 4.64 4.83 4.99 5.13 5.25 
15 3.01 3.67 4.08 4.37 4.60 4.78 4.94 5.08 5.20 
16 3.00 3.65 4.05 4.33 4.56 4.74 4.90 5.03 5.15 
17 2.98 3.63 4.02 4.30 4.52 4.70 4.86 4.99 5.11 
18 2.97 3.61 4.00 4.28 4.50 4.67 4.82 4.96 5.07 
19 2.96 3.59 3.98 4.25 4.47 4.64 4.79 4.92 5.04 
20 2.95 3.58 3.96 4.23 4.44 4.62 4.77 4.90 5.01 
24 2.92 3.53 3.90 4.17 4.37 4.54 4.68 4.81 4.92 
30 2.89 3.49 3.84 4.10 4.30 4.46 4.60 4.72 4.82 
40 2.86 3.44 3.79 4.04 4.23 4.39 4.52 4.64 4.74 
60 2.83 3.40 3.74 3.98 4.16 4.31 4.44 4.55 4.65 
120 2.80 3.36 3.69 3.92 4.10 4.24 4.36 4.47 4.56 
∞ 2.77 3.31 3.63 3.86 4.03 4.17 4.29 4.39 4.47 
.....continued in Howell to r = 15 
Adapted from David Howell, Statistical Methods for Psychology (Boston: Duxbury Press, 1982), 532 
dfw
© 4th ed. 2006 Dr. Rick Yount Tables 
U-Distribution Table 
A3-9 
Critical Value Table 
for the Mann-Whitney U test 
Chapter 24 
N2 
N2 
1-tail test at α = 0.025 or 2-tail test at αααα = 0.05 
1-tail test at αααα = 0.05 or 2-tail test at α = 0.10 
N1 
1 2 3 4 5 6 7 8 9 10 11 12 13 14 15 16 17 18 19 20 
12 
0 0 0 0 1 1 1 1 1 2 2 2 2 
3 0 1 1 2 2 3 3 4 4 5 5 6 6 7 7 8 
4 0 1 2 3 4 4 5 6 7 8 9 10 11 11 12 13 13 
5 0 1 2 3 5 6 7 8 9 11 12 13 14 15 17 18 19 20 
6 1 2 3 5 6 8 10 11 13 14 16 17 19 21 22 24 25 27 
7 1 3 5 6 8 10 12 14 16 18 20 22 24 26 28 30 32 34 
8 0 2 4 6 8 10 13 15 17 19 22 24 26 29 21 34 36 38 41 
9 0 2 4 7 10 12 15 17 20 23 26 28 31 34 37 39 42 45 48 
10 0 3 5 8 11 14 17 20 23 26 29 33 36 39 42 45 48 52 55 
11 0 3 6 9 13 16 19 23 26 30 33 37 40 44 47 51 55 58 62 
12 1 4 7 11 14 18 22 26 29 33 37 41 45 49 53 57 61 65 69 
13 1 4 8 12 16 20 24 28 33 37 41 45 50 54 59 63 67 72 76 
14 1 5 9 13 17 22 26 31 36 40 45 50 55 59 64 67 74 78 83 
15 1 5 10 14 19 24 29 34 39 44 49 54 59 64 70 75 80 85 90 
16 1 6 11 15 21 26 31 37 42 47 53 59 64 70 75 81 86 92 98 
17 2 6 11 17 22 28 34 39 45 51 57 63 67 75 81 87 93 99 105 
18 2 7 12 18 24 30 36 42 48 55 61 67 74 80 86 93 99 106 112 
19 2 7 13 19 25 32 38 45 52 58 65 72 78 95 92 99 106 113 119 
20 2 8 13 20 27 34 41 48 55 62 69 76 83 90 98 105 112 119 127 
N1 
1 2 3 4 5 6 7 8 9 10 11 12 13 14 15 16 17 18 19 20 
12 
0 0 0 1 1 1 1 2 2 2 3 3 3 4 4 4 
3 0 0 1 2 2 3 3 4 5 5 6 7 7 8 9 9 10 11 
4 0 1 2 3 4 5 6 7 8 9 10 11 12 14 15 16 17 18 
5 0 1 2 4 5 6 8 9 11 12 13 15 16 18 19 20 22 23 25 
6 0 2 3 5 7 8 10 12 14 16 17 19 21 23 25 26 28 30 32 
7 0 2 4 6 8 11 13 15 17 19 21 24 26 28 30 33 35 37 39 
8 1 3 5 8 10 13 15 18 20 23 26 28 31 33 36 39 41 44 47 
9 1 3 6 9 12 15 18 21 24 27 30 33 36 39 42 45 48 51 54 
10 1 4 7 11 14 17 20 24 27 31 34 37 41 44 48 51 55 58 62 
11 1 5 8 12 16 19 23 27 31 34 38 42 46 50 54 57 61 65 69 
12 2 5 9 13 17 21 26 30 34 38 42 47 51 55 60 64 68 72 77 
13 2 6 10 15 19 24 28 33 37 42 47 51 56 61 65 70 75 80 84 
14 2 7 11 16 21 26 31 36 41 46 51 56 61 66 71 77 82 87 92 
15 3 7 12 18 23 28 33 39 44 50 55 61 66 72 77 83 88 94 100 
16 3 8 14 19 25 30 36 42 48 54 60 65 71 77 83 89 95 101 107 
17 3 9 15 20 26 33 39 45 51 57 64 70 77 83 89 96 102 109 115 
18 4 9 16 22 28 35 41 48 55 61 68 75 82 88 95 102 109 116 123 
19 0 4 10 17 23 30 37 44 51 58 65 72 80 87 94 101 109 116 123 130 
20 0 4 11 18 25 32 39 47 54 62 69 77 84 92 100 107 115 123 130 138 
N1 < N2 
Adapted from Robert Johnson, Elementary Statistics, 6th ed. (Boston: PWS-Kent Publishing, 1992), Appendix F-20
Research Design and Statistical Analysis in Christian Ministry © 4th ed. 2006 Dr. Rick Yount 
A3-10

More Related Content

What's hot (19)

Z distribution
Z distribution Z distribution
Z distribution
 
Futurevaluetables
FuturevaluetablesFuturevaluetables
Futurevaluetables
 
Ztable
ZtableZtable
Ztable
 
Tablas
TablasTablas
Tablas
 
Tabla t
Tabla tTabla t
Tabla t
 
T table
T tableT table
T table
 
T distribution table
T distribution tableT distribution table
T distribution table
 
Tabel t
Tabel tTabel t
Tabel t
 
Tablas de distribucion normal con la probabilidad definitiva - Con todos los ...
Tablas de distribucion normal con la probabilidad definitiva - Con todos los ...Tablas de distribucion normal con la probabilidad definitiva - Con todos los ...
Tablas de distribucion normal con la probabilidad definitiva - Con todos los ...
 
Copy of z table
Copy of z tableCopy of z table
Copy of z table
 
Tabla t student
Tabla t studentTabla t student
Tabla t student
 
Como se utiliza la tabla t de student (formulas)
Como se utiliza la tabla t de student (formulas)Como se utiliza la tabla t de student (formulas)
Como se utiliza la tabla t de student (formulas)
 
Tabla f05
Tabla f05Tabla f05
Tabla f05
 
Tablas
TablasTablas
Tablas
 
Tabel Nilai Kritis Distribusi Chi-Square
Tabel Nilai Kritis Distribusi Chi-SquareTabel Nilai Kritis Distribusi Chi-Square
Tabel Nilai Kritis Distribusi Chi-Square
 
Z-table
Z-tableZ-table
Z-table
 
Tabel distribusi normal
Tabel distribusi normalTabel distribusi normal
Tabel distribusi normal
 
Tabla Distribución t
Tabla Distribución tTabla Distribución t
Tabla Distribución t
 
Present Value Interest Factor of an Annuity of 1$ Per Period Cumulative for 5...
Present Value Interest Factor of an Annuity of 1$ Per Period Cumulative for 5...Present Value Interest Factor of an Annuity of 1$ Per Period Cumulative for 5...
Present Value Interest Factor of an Annuity of 1$ Per Period Cumulative for 5...
 

Viewers also liked

University of manchester mathematical formula tables
University of manchester mathematical formula tablesUniversity of manchester mathematical formula tables
University of manchester mathematical formula tablesGaurav Vasani
 
Data Mining:Concepts and Techniques, Chapter 8. Classification: Basic Concepts
Data Mining:Concepts and Techniques, Chapter 8. Classification: Basic ConceptsData Mining:Concepts and Techniques, Chapter 8. Classification: Basic Concepts
Data Mining:Concepts and Techniques, Chapter 8. Classification: Basic ConceptsSalah Amean
 
ตารางการแจกแจง F
ตารางการแจกแจง Fตารางการแจกแจง F
ตารางการแจกแจง FJaturapad Pratoom
 
Calculating critical values of t distributions using tables of percentage points
Calculating critical values of t distributions using tables of percentage pointsCalculating critical values of t distributions using tables of percentage points
Calculating critical values of t distributions using tables of percentage pointsmodelos-econometricos
 
บทที่ 4
บทที่ 4บทที่ 4
บทที่ 4Janova Kknd
 
Tabel t, z dan f dan chi kuadrat
Tabel t, z dan f dan chi kuadratTabel t, z dan f dan chi kuadrat
Tabel t, z dan f dan chi kuadratIr. Zakaria, M.M
 

Viewers also liked (7)

University of manchester mathematical formula tables
University of manchester mathematical formula tablesUniversity of manchester mathematical formula tables
University of manchester mathematical formula tables
 
Data Mining:Concepts and Techniques, Chapter 8. Classification: Basic Concepts
Data Mining:Concepts and Techniques, Chapter 8. Classification: Basic ConceptsData Mining:Concepts and Techniques, Chapter 8. Classification: Basic Concepts
Data Mining:Concepts and Techniques, Chapter 8. Classification: Basic Concepts
 
Studentized range distribution
Studentized range distributionStudentized range distribution
Studentized range distribution
 
ตารางการแจกแจง F
ตารางการแจกแจง Fตารางการแจกแจง F
ตารางการแจกแจง F
 
Calculating critical values of t distributions using tables of percentage points
Calculating critical values of t distributions using tables of percentage pointsCalculating critical values of t distributions using tables of percentage points
Calculating critical values of t distributions using tables of percentage points
 
บทที่ 4
บทที่ 4บทที่ 4
บทที่ 4
 
Tabel t, z dan f dan chi kuadrat
Tabel t, z dan f dan chi kuadratTabel t, z dan f dan chi kuadrat
Tabel t, z dan f dan chi kuadrat
 

Similar to 93 crit valuetables_4th

Similar to 93 crit valuetables_4th (20)

Assignment # 1 Health Management
Assignment # 1 Health ManagementAssignment # 1 Health Management
Assignment # 1 Health Management
 
Besavne cevi din_2448
Besavne cevi din_2448Besavne cevi din_2448
Besavne cevi din_2448
 
Tablas de distribución normal.
Tablas de distribución normal.Tablas de distribución normal.
Tablas de distribución normal.
 
Catalogo tubos colmena
Catalogo tubos colmenaCatalogo tubos colmena
Catalogo tubos colmena
 
Boston housing
Boston housingBoston housing
Boston housing
 
Limites de control para gráficos xr xs
Limites de control para gráficos xr xsLimites de control para gráficos xr xs
Limites de control para gráficos xr xs
 
Tabla para determinar los valores de yn y k
Tabla para determinar los valores de yn y kTabla para determinar los valores de yn y k
Tabla para determinar los valores de yn y k
 
Calendario Lunar ecuador 2017
Calendario Lunar ecuador 2017Calendario Lunar ecuador 2017
Calendario Lunar ecuador 2017
 
Tabla pt amonia
Tabla pt amoniaTabla pt amonia
Tabla pt amonia
 
Present value tables
Present value tablesPresent value tables
Present value tables
 
8 fv&amp;pv tables
8 fv&amp;pv tables8 fv&amp;pv tables
8 fv&amp;pv tables
 
Present Value and Future Value Tables
Present Value and Future Value TablesPresent Value and Future Value Tables
Present Value and Future Value Tables
 
Futurevaluetables
FuturevaluetablesFuturevaluetables
Futurevaluetables
 
Trigonotabel
TrigonotabelTrigonotabel
Trigonotabel
 
Tablas estadísticas
Tablas estadísticasTablas estadísticas
Tablas estadísticas
 
D l table
D l tableD l table
D l table
 
Tabla chi cuadrado
Tabla chi cuadradoTabla chi cuadrado
Tabla chi cuadrado
 
Tabla chi cuadrado
Tabla chi cuadradoTabla chi cuadrado
Tabla chi cuadrado
 
Tabla de chi-cuadrado
Tabla de chi-cuadradoTabla de chi-cuadrado
Tabla de chi-cuadrado
 
Tabla chi cuadrado.
Tabla chi cuadrado.Tabla chi cuadrado.
Tabla chi cuadrado.
 

Recently uploaded

HR Software Buyers Guide in 2024 - HRSoftware.com
HR Software Buyers Guide in 2024 - HRSoftware.comHR Software Buyers Guide in 2024 - HRSoftware.com
HR Software Buyers Guide in 2024 - HRSoftware.comFatema Valibhai
 
SyndBuddy AI 2k Review 2024: Revolutionizing Content Syndication with AI
SyndBuddy AI 2k Review 2024: Revolutionizing Content Syndication with AISyndBuddy AI 2k Review 2024: Revolutionizing Content Syndication with AI
SyndBuddy AI 2k Review 2024: Revolutionizing Content Syndication with AIABDERRAOUF MEHENNI
 
How To Use Server-Side Rendering with Nuxt.js
How To Use Server-Side Rendering with Nuxt.jsHow To Use Server-Side Rendering with Nuxt.js
How To Use Server-Side Rendering with Nuxt.jsAndolasoft Inc
 
TECUNIQUE: Success Stories: IT Service provider
TECUNIQUE: Success Stories: IT Service providerTECUNIQUE: Success Stories: IT Service provider
TECUNIQUE: Success Stories: IT Service providermohitmore19
 
Unlocking the Future of AI Agents with Large Language Models
Unlocking the Future of AI Agents with Large Language ModelsUnlocking the Future of AI Agents with Large Language Models
Unlocking the Future of AI Agents with Large Language Modelsaagamshah0812
 
Test Automation Strategy for Frontend and Backend
Test Automation Strategy for Frontend and BackendTest Automation Strategy for Frontend and Backend
Test Automation Strategy for Frontend and BackendArshad QA
 
(Genuine) Escort Service Lucknow | Starting ₹,5K To @25k with A/C 🧑🏽‍❤️‍🧑🏻 89...
(Genuine) Escort Service Lucknow | Starting ₹,5K To @25k with A/C 🧑🏽‍❤️‍🧑🏻 89...(Genuine) Escort Service Lucknow | Starting ₹,5K To @25k with A/C 🧑🏽‍❤️‍🧑🏻 89...
(Genuine) Escort Service Lucknow | Starting ₹,5K To @25k with A/C 🧑🏽‍❤️‍🧑🏻 89...gurkirankumar98700
 
Diamond Application Development Crafting Solutions with Precision
Diamond Application Development Crafting Solutions with PrecisionDiamond Application Development Crafting Solutions with Precision
Diamond Application Development Crafting Solutions with PrecisionSolGuruz
 
CALL ON ➥8923113531 🔝Call Girls Kakori Lucknow best sexual service Online ☂️
CALL ON ➥8923113531 🔝Call Girls Kakori Lucknow best sexual service Online  ☂️CALL ON ➥8923113531 🔝Call Girls Kakori Lucknow best sexual service Online  ☂️
CALL ON ➥8923113531 🔝Call Girls Kakori Lucknow best sexual service Online ☂️anilsa9823
 
DNT_Corporate presentation know about us
DNT_Corporate presentation know about usDNT_Corporate presentation know about us
DNT_Corporate presentation know about usDynamic Netsoft
 
why an Opensea Clone Script might be your perfect match.pdf
why an Opensea Clone Script might be your perfect match.pdfwhy an Opensea Clone Script might be your perfect match.pdf
why an Opensea Clone Script might be your perfect match.pdfjoe51371421
 
Active Directory Penetration Testing, cionsystems.com.pdf
Active Directory Penetration Testing, cionsystems.com.pdfActive Directory Penetration Testing, cionsystems.com.pdf
Active Directory Penetration Testing, cionsystems.com.pdfCionsystems
 
Learn the Fundamentals of XCUITest Framework_ A Beginner's Guide.pdf
Learn the Fundamentals of XCUITest Framework_ A Beginner's Guide.pdfLearn the Fundamentals of XCUITest Framework_ A Beginner's Guide.pdf
Learn the Fundamentals of XCUITest Framework_ A Beginner's Guide.pdfkalichargn70th171
 
Try MyIntelliAccount Cloud Accounting Software As A Service Solution Risk Fre...
Try MyIntelliAccount Cloud Accounting Software As A Service Solution Risk Fre...Try MyIntelliAccount Cloud Accounting Software As A Service Solution Risk Fre...
Try MyIntelliAccount Cloud Accounting Software As A Service Solution Risk Fre...MyIntelliSource, Inc.
 
Software Quality Assurance Interview Questions
Software Quality Assurance Interview QuestionsSoftware Quality Assurance Interview Questions
Software Quality Assurance Interview QuestionsArshad QA
 
Short Story: Unveiling the Reasoning Abilities of Large Language Models by Ke...
Short Story: Unveiling the Reasoning Abilities of Large Language Models by Ke...Short Story: Unveiling the Reasoning Abilities of Large Language Models by Ke...
Short Story: Unveiling the Reasoning Abilities of Large Language Models by Ke...kellynguyen01
 
5 Signs You Need a Fashion PLM Software.pdf
5 Signs You Need a Fashion PLM Software.pdf5 Signs You Need a Fashion PLM Software.pdf
5 Signs You Need a Fashion PLM Software.pdfWave PLM
 

Recently uploaded (20)

HR Software Buyers Guide in 2024 - HRSoftware.com
HR Software Buyers Guide in 2024 - HRSoftware.comHR Software Buyers Guide in 2024 - HRSoftware.com
HR Software Buyers Guide in 2024 - HRSoftware.com
 
SyndBuddy AI 2k Review 2024: Revolutionizing Content Syndication with AI
SyndBuddy AI 2k Review 2024: Revolutionizing Content Syndication with AISyndBuddy AI 2k Review 2024: Revolutionizing Content Syndication with AI
SyndBuddy AI 2k Review 2024: Revolutionizing Content Syndication with AI
 
How To Use Server-Side Rendering with Nuxt.js
How To Use Server-Side Rendering with Nuxt.jsHow To Use Server-Side Rendering with Nuxt.js
How To Use Server-Side Rendering with Nuxt.js
 
TECUNIQUE: Success Stories: IT Service provider
TECUNIQUE: Success Stories: IT Service providerTECUNIQUE: Success Stories: IT Service provider
TECUNIQUE: Success Stories: IT Service provider
 
Unlocking the Future of AI Agents with Large Language Models
Unlocking the Future of AI Agents with Large Language ModelsUnlocking the Future of AI Agents with Large Language Models
Unlocking the Future of AI Agents with Large Language Models
 
Test Automation Strategy for Frontend and Backend
Test Automation Strategy for Frontend and BackendTest Automation Strategy for Frontend and Backend
Test Automation Strategy for Frontend and Backend
 
(Genuine) Escort Service Lucknow | Starting ₹,5K To @25k with A/C 🧑🏽‍❤️‍🧑🏻 89...
(Genuine) Escort Service Lucknow | Starting ₹,5K To @25k with A/C 🧑🏽‍❤️‍🧑🏻 89...(Genuine) Escort Service Lucknow | Starting ₹,5K To @25k with A/C 🧑🏽‍❤️‍🧑🏻 89...
(Genuine) Escort Service Lucknow | Starting ₹,5K To @25k with A/C 🧑🏽‍❤️‍🧑🏻 89...
 
Diamond Application Development Crafting Solutions with Precision
Diamond Application Development Crafting Solutions with PrecisionDiamond Application Development Crafting Solutions with Precision
Diamond Application Development Crafting Solutions with Precision
 
Exploring iOS App Development: Simplifying the Process
Exploring iOS App Development: Simplifying the ProcessExploring iOS App Development: Simplifying the Process
Exploring iOS App Development: Simplifying the Process
 
CALL ON ➥8923113531 🔝Call Girls Kakori Lucknow best sexual service Online ☂️
CALL ON ➥8923113531 🔝Call Girls Kakori Lucknow best sexual service Online  ☂️CALL ON ➥8923113531 🔝Call Girls Kakori Lucknow best sexual service Online  ☂️
CALL ON ➥8923113531 🔝Call Girls Kakori Lucknow best sexual service Online ☂️
 
DNT_Corporate presentation know about us
DNT_Corporate presentation know about usDNT_Corporate presentation know about us
DNT_Corporate presentation know about us
 
why an Opensea Clone Script might be your perfect match.pdf
why an Opensea Clone Script might be your perfect match.pdfwhy an Opensea Clone Script might be your perfect match.pdf
why an Opensea Clone Script might be your perfect match.pdf
 
Active Directory Penetration Testing, cionsystems.com.pdf
Active Directory Penetration Testing, cionsystems.com.pdfActive Directory Penetration Testing, cionsystems.com.pdf
Active Directory Penetration Testing, cionsystems.com.pdf
 
Learn the Fundamentals of XCUITest Framework_ A Beginner's Guide.pdf
Learn the Fundamentals of XCUITest Framework_ A Beginner's Guide.pdfLearn the Fundamentals of XCUITest Framework_ A Beginner's Guide.pdf
Learn the Fundamentals of XCUITest Framework_ A Beginner's Guide.pdf
 
Vip Call Girls Noida ➡️ Delhi ➡️ 9999965857 No Advance 24HRS Live
Vip Call Girls Noida ➡️ Delhi ➡️ 9999965857 No Advance 24HRS LiveVip Call Girls Noida ➡️ Delhi ➡️ 9999965857 No Advance 24HRS Live
Vip Call Girls Noida ➡️ Delhi ➡️ 9999965857 No Advance 24HRS Live
 
Try MyIntelliAccount Cloud Accounting Software As A Service Solution Risk Fre...
Try MyIntelliAccount Cloud Accounting Software As A Service Solution Risk Fre...Try MyIntelliAccount Cloud Accounting Software As A Service Solution Risk Fre...
Try MyIntelliAccount Cloud Accounting Software As A Service Solution Risk Fre...
 
Microsoft AI Transformation Partner Playbook.pdf
Microsoft AI Transformation Partner Playbook.pdfMicrosoft AI Transformation Partner Playbook.pdf
Microsoft AI Transformation Partner Playbook.pdf
 
Software Quality Assurance Interview Questions
Software Quality Assurance Interview QuestionsSoftware Quality Assurance Interview Questions
Software Quality Assurance Interview Questions
 
Short Story: Unveiling the Reasoning Abilities of Large Language Models by Ke...
Short Story: Unveiling the Reasoning Abilities of Large Language Models by Ke...Short Story: Unveiling the Reasoning Abilities of Large Language Models by Ke...
Short Story: Unveiling the Reasoning Abilities of Large Language Models by Ke...
 
5 Signs You Need a Fashion PLM Software.pdf
5 Signs You Need a Fashion PLM Software.pdf5 Signs You Need a Fashion PLM Software.pdf
5 Signs You Need a Fashion PLM Software.pdf
 

93 crit valuetables_4th

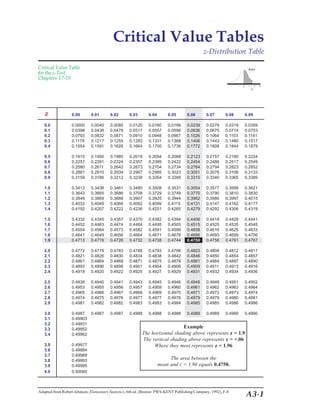
  • 1. © 4th ed. 2006 Dr. Rick Yount Tables Critical Value Tables z-Distribution Table Critical Value Table for the z-Test Chapters 17-19 0.00 0.01 0.02 0.03 0.04 0.05 0.06 0.07 0.08 0.09 z 0.0 0.0000 0.0040 0.0080 0.0120 0.0160 0.0199 0.0239 0.0279 0.0319 0.0359 0.1 0.0398 0.0438 0.0478 0.0517 0.0557 0.0596 0.0636 0.0675 0.0714 0.0753 0.2 0.0793 0.0832 0.0871 0.0910 0.0948 0.0987 0.1026 0.1064 0.1103 0.1141 0.3 0.1179 0.1217 0.1255 0.1293 0.1331 0.1368 0.1406 0.1443 0.1480 0.1517 0.4 0.1554 0.1591 0.1628 0.1664 0.1700 0.1736 0.1772 0.1808 0.1844 0.1879 0.5 0.1915 0.1950 0.1985 0.2019 0.2054 0.2088 0.2123 0.2157 0.2190 0.2224 0.6 0.2257 0.2291 0.2324 0.2357 0.2389 0.2422 0.2454 0.2486 0.2517 0.2549 0.7 0.2580 0.2611 0.2642 0.2673 0.2704 0.2734 0.2764 0.2794 0.2823 0.2852 0.8 0.2881 0.2910 0.2939 0.2967 0.2995 0.3023 0.3051 0.3078 0.3106 0.3133 0.9 0.3159 0.3186 0.3212 0.3238 0.3264 0.3289 0.3315 0.3340 0.3365 0.3389 1.0 0.3413 0.3438 0.3461 0.3485 0.3508 0.3531 0.3554 0.3577 0.3599 0.3621 1.1 0.3643 0.3665 0.3686 0.3708 0.3729 0.3749 0.3770 0.3790 0.3810 0.3830 1.2 0.3849 0.3869 0.3888 0.3907 0.3925 0.3944 0.3962 0.3980 0.3997 0.4015 1.3 0.4032 0.4049 0.4066 0.4082 0.4099 0.4115 0.4131 0.4147 0.4162 0.4177 1.4 0.4192 0.4207 0.4222 0.4236 0.4251 0.4265 0.4279 0.4292 0.4306 0.4319 1.5 0.4332 0.4345 0.4357 0.4370 0.4382 0.4394 0.4406 0.4418 0.4429 0.4441 1.6 0.4452 0.4463 0.4474 0.4484 0.4495 0.4505 0.4515 0.4525 0.4535 0.4545 1.7 0.4554 0.4564 0.4573 0.4582 0.4591 0.4599 0.4608 0.4616 0.4625 0.4633 1.8 0.4641 0.4649 0.4656 0.4664 0.4671 0.4678 0.4686 0.4693 0.4699 0.4706 1.9 0.4713 0.4719 0.4726 0.4732 0.4738 0.4744 0.4750 0.4756 0.4761 0.4767 2.0 0.4772 0.4778 0.4783 0.4788 0.4793 0.4798 0.4803 0.4808 0.4812 0.4817 2.1 0.4821 0.4826 0.4830 0.4834 0.4838 0.4842 0.4846 0.4850 0.4854 0.4857 2.2 0.4861 0.4864 0.4868 0.4871 0.4875 0.4878 0.4881 0.4884 0.4887 0.4890 2.3 0.4893 0.4896 0.4898 0.4901 0.4904 0.4906 0.4909 0.4911 0.4913 0.4916 2.4 0.4918 0.4920 0.4922 0.4925 0.4927 0.4929 0.4931 0.4932 0.4934 0.4936 2.5 0.4938 0.4940 0.4941 0.4943 0.4945 0.4946 0.4948 0.4949 0.4951 0.4952 2.6 0.4953 0.4955 0.4956 0.4957 0.4959 0.4960 0.4961 0.4962 0.4963 0.4964 2.7 0.4965 0.4966 0.4967 0.4968 0.4969 0.4970 0.4971 0.4972 0.4973 0.4974 2.8 0.4974 0.4975 0.4976 0.4977 0.4977 0.4978 0.4979 0.4979 0.4980 0.4981 2.9 0.4981 0.4982 0.4982 0.4983 0.4983 0.4984 0.4985 0.4985 0.4986 0.4986 3.0 0.4987 0.4987 0.4987 0.4988 0.4988 0.4988 0.4989 0.4989 0.4990 0.4990 3.1 0.49903 3.2 0.49931 3.3 0.49952 3.4 0.49962 3.5 0.49977 3.6 0.49984 3.7 0.49989 3.8 0.49993 3.9 0.49995 4.0 0.50000 A3-1 Example The horizontal shading above represents z = 1.9 The vertical shading above represents z = +.06 Where they meet represents z = 1.96 The area between the mean and z = 1.96 equals 0.4750. Adapted from Robert Johnson, Elementary Statistics, 6th ed. (Boston: PWS-KENT Publishing Company, 1992), F-8
  • 2. Research Design and Statistical Analysis in Christian Ministry © 4th ed. 2006 Dr. Rick Yount Critical Value Table for the t-Tests Chapters 19-20 A3-2 t-Distribution Table df 0.05 0.025 0.01 0.005 1 6.314 12.706 31.821 63.657 2 2.920 4.303 6.965 9.925 3 2.353 3.182 4.541 5.841 4 2.132 2.776 3.747 4.604 5 2.015 2.571 3.365 4.032 6 1.943 2.447 3.143 3.707 7 1.895 2.365 2.998 3.499 8 1.860 2.306 2.896 3.355 9 1.833 2.262 2.821 3.250 10 1.812 2.228 2.764 3.169 11 1.796 2.201 2.718 3.106 12 1.782 2.179 2.681 3.055 13 1.771 2.160 2.650 3.012 14 1.761 2.145 2.624 2.977 15 1.753 2.131 2.602 2.947 16 1.746 2.120 2.583 2.921 17 1.740 2.110 2.567 2.898 18 1.734 2.101 2.552 2.878 19 1.729 2.093 2.539 2.861 20 1.725 2.086 2.528 2.845 21 1.721 2.080 2.518 2.831 22 1.717 2.074 2.508 2.819 23 1.714 2.069 2.500 2.807 24 1.711 2.064 2.492 2.797 25 1.708 2.060 2.485 2.787 26 1.706 2.056 2.479 2.779 27 1.703 2.052 2.473 2.771 28 1.701 2.048 2.467 2.763 29 1.699 2.045 2.462 2.756 30 1.697 2.042 2.457 2.750 40 1.684 2.021 2.423 2.704 50 1.676 2.009 2.403 2.678 100 1.660 1.984 2.364 2.626 ∞∞∞∞ 1.645 1.960 2.326 2.576 Adapted from David Howell, Statistical Methods for Psychology (Boston: Duxbury Press, 1982), 521 one sample t df = n-1 independent samples t df = nx + ny - 2 matched samples t df = n-2 pairs
  • 3. © 4th ed. 2006 Dr. Rick Yount Tables χ2 Distribution Table df 0.05 0.025 0.01 0.005 1 3.84 5.02 6.63 7.88 2 5.99 7.38 9.21 10.60 3 7.82 9.35 11.35 12.84 4 9.49 11.14 13.28 14.86 5 11.07 12.83 15.09 16.75 6 12.59 14.45 16.81 18.55 7 14.07 16.01 18.48 20.28 8 15.51 17.54 20.09 21.96 9 16.92 19.02 21.66 23.59 10 18.31 20.48 23.21 25.19 11 19.68 21.92 24.72 26.75 12 21.03 23.34 26.21 28.30 13 22.36 24.74 27.69 29.82 14 23.69 26.12 29.14 31.31 15 25.00 27.49 30.58 32.80 16 26.30 28.85 32.00 34.27 17 27.59 30.19 33.41 35.72 18 28.87 31.53 34.81 37.15 19 30.14 32.85 36.19 38.58 20 31.41 34.17 37.56 40.00 21 32.67 35.48 38.93 41.40 22 33.93 36.78 40.29 42.80 23 35.17 38.08 41.64 44.18 24 36.42 39.37 42.98 45.56 25 37.65 40.65 44.32 46.93 26 38.89 41.92 45.64 48.29 27 40.11 43.20 46.96 49.64 28 41.34 44.46 48.28 50.99 29 42.56 45.72 49.59 52.34 30 43.77 46.98 50.89 53.67 40 55.75 59.34 63.71 66.80 50 67.50 71.42 76.17 79.52 100 124.34 129.56 135.82 140.19 A3-3 Critical Value Table for the Chi-Square Tests Chapter 23 Goodness of Fit df = k-1 Test of Independence df = (r-1)(c-1) Adapted from David Howell, Statistical Methods for Psychology (Boston: Duxbury Press, 1982), 521
  • 4. Research Design and Statistical Analysis in Christian Ministry © 4th ed. 2006 Dr. Rick Yount Critical Value Table for the Analysis of Variance Test Chapter 21 A3-4 F-Distribution Table Degrees of Freedom for the F-Ratio numera-tor Degrees of Freedom for the F-Ratio denominator αααα = 0.05 1 2 3 4 5 6 7 8 9 10 1 161.4 199.5 215.8 224.8 230.0 233.8 236.5 238.6 240.1 242.1 2 18.51 19.00 19.16 19.25 19.30 19.33 19.35 19.37 19.38 19.40 3 10.13 9.55 9.28 9.12 9.01 8.94 8.89 8.85 8.81 8.79 4 7.71 6.94 6.59 6.39 6.26 6.16 6.09 6.04 6.00 5.96 5 6.61 5.79 5.41 5.19 5.05 4.95 4.88 4.82 4.77 4.74 6 5.99 5.14 4.76 4.53 4.39 4.28 4.21 4.15 4.10 4.06 7 5.59 4.74 4.35 4.12 3.97 3.87 3.79 3.73 3.68 3.64 8 5.32 4.46 4.07 3.84 3.69 3.58 3.50 3.44 3.39 3.35 9 5.12 4.26 3.86 3.63 3.48 3.37 3.29 3.23 3.18 3.14 10 4.96 4.10 3.71 3.48 3.33 3.22 3.14 3.07 3.02 2.98 11 4.84 3.98 3.59 3.36 3.20 3.09 3.01 2.95 2.90 2.85 12 4.75 3.89 3.49 3.26 3.11 3.00 2.91 2.85 2.80 2.75 13 4.67 3.81 3.41 3.18 3.03 2.92 2.83 2.77 2.71 2.67 14 4.60 3.74 3.34 3.11 2.96 2.85 2.76 2.70 2.65 2.60 15 4.54 3.68 3.29 3.06 2.90 2.79 2.71 2.64 2.59 2.54 16 4.49 3.63 3.24 3.01 2.85 2.74 2.66 2.59 2.54 2.49 17 4.45 3.59 3.20 2.96 2.81 2.70 2.61 2.55 2.49 2.45 18 4.41 3.55 3.16 2.93 2.77 2.66 2.58 2.51 2.46 2.41 19 4.38 3.52 3.13 2.90 2.74 2.63 2.54 2.48 2.42 2.38 20 4.35 3.49 3.10 2.87 2.71 2.60 2.51 2.45 2.39 2.35 22 4.30 3.44 3.05 2.82 2.66 2.55 2.46 2.40 2.34 2.30 24 4.26 3.40 3.01 2.78 2.62 2.51 2.42 2.36 2.30 2.25 26 4.23 3.37 2.98 2.74 2.59 2.47 2.39 2.32 2.27 2.22 28 4.20 3.34 2.95 2.71 2.56 2.45 2.36 2.29 2.24 2.19 30 4.17 3.32 2.92 2.69 2.53 2.42 2.33 2.27 2.21 2.16 40 4.08 3.23 2.84 2.61 2.45 2.34 2.25 2.18 2.12 2.08 50 4.03 3.18 2.79 2.56 2.40 2.29 2.20 2.13 2.07 2.03 60 4.00 3.15 2.76 2.53 2.37 2.25 2.17 2.10 2.04 1.99 120 3.92 3.07 2.68 2.45 2.29 2.18 2.09 2.02 1.96 1.91 200 3.89 3.04 2.65 2.42 2.26 2.14 2.06 1.98 1.93 1.88 500 3.86 3.01 2.62 2.39 2.23 2.12 2.03 1.96 1.90 1.85 1000 3.85 3.01 2.61 2.38 2.22 2.11 2.02 1.95 1.89 1.84 Adapted from David Howell, Statistical Methods for Psychology (Boston: Duxbury Press, 1982), 524
  • 5. © 4th ed. 2006 Dr. Rick Yount Tables F-Distribution Table A3-5 Degrees of Freedom for the F-Ratio numera-tor Critical Value Table for the Analysis of Variance Test Chapter 21 Degrees of Freedom for the F-Ratio denominator αααα = 0.01 1 2 3 4 5 6 7 8 9 10 1 4048 4993 5377 5577 5668 5924 5992 6096 6132 6168 2 98.50 99.01 99.15 99.23 99.30 99.33 99.35 99.39 99.40 99.43 3 34.12 30.82 29.46 28.71 28.24 27.91 27.67 27.49 27.34 27.23 4 21.20 18.00 16.69 15.98 15.52 15.21 14.98 14.80 14.66 14.55 5 16.26 13.27 12.06 11.39 10.97 10.67 10.46 10.29 10.16 10.05 6 13.75 10.92 9.78 9.15 8.75 8.47 8.26 8.10 7.98 7.87 7 12.25 9.55 8.45 7.85 7.46 7.19 6.99 6.84 6.72 6.62 8 11.26 8.65 7.59 7.01 6.63 6.37 6.18 6.03 5.91 5.81 9 10.56 8.02 6.99 6.42 6.06 5.80 5.61 5.47 5.35 5.26 10 10.04 7.56 6.55 5.99 5.64 5.39 5.20 5.06 4.94 4.85 11 9.65 7.21 6.22 5.67 5.32 5.07 4.89 4.74 4.63 4.54 12 9.33 6.93 5.95 5.41 5.06 4.82 4.64 4.50 4.39 4.30 13 9.07 6.70 5.74 5.21 4.86 4.62 4.44 4.30 4.19 4.10 14 8.86 6.51 5.56 5.04 4.69 4.46 4.28 4.14 4.03 3.94 15 8.68 6.36 5.42 4.89 4.56 4.32 4.14 4.00 3.89 3.80 16 8.53 6.23 5.29 4.77 4.44 4.20 4.03 3.89 3.78 3.69 17 8.40 6.11 5.18 4.67 4.34 4.10 3.93 3.79 3.68 3.59 18 8.29 6.01 5.09 4.58 4.25 4.01 3.84 3.71 3.60 3.51 19 8.18 5.93 5.01 4.50 4.17 3.94 3.77 3.63 3.52 3.43 20 8.10 5.85 4.94 4.43 4.10 3.87 3.70 3.56 3.46 3.37 22 7.95 5.72 4.82 4.31 3.99 3.76 3.59 3.45 3.35 3.26 24 7.82 5.61 4.72 4.22 3.90 3.67 3.50 3.36 3.26 3.17 26 7.72 5.53 4.64 4.14 3.82 3.59 3.42 3.29 3.18 3.09 28 7.64 5.45 4.57 4.07 3.75 3.53 3.36 3.23 3.12 3.03 30 7.56 5.39 4.51 4.02 3.70 3.47 3.30 3.17 3.07 2.98 40 7.31 5.18 4.31 3.83 3.51 3.29 3.12 2.99 2.89 2.80 50 7.17 5.06 4.20 3.72 3.41 3.19 3.02 2.89 2.78 2.70 60 7.08 4.98 4.13 3.65 3.34 3.12 2.95 2.82 2.72 2.63 120 6.85 4.79 3.95 3.48 3.17 2.96 2.79 2.66 2.56 2.47 200 6.76 4.71 3.88 3.41 3.11 2.89 2.73 2.60 2.50 2.41 500 6.69 4.65 3.82 3.36 3.05 2.84 2.68 2.55 2.44 2.36 1000 6.67 4.63 3.80 3.34 3.04 2.82 2.66 2.53 2.43 2.34 Adapted from David Howell, Statistical Methods for Psychology (Boston: Duxbury Press, 1982), 526
  • 6. Research Design and Statistical Analysis in Christian Ministry © 4th ed. 2006 Dr. Rick Yount Critical Value Table for the Wilcoxin Rank-Sum Ordinal Test Chapter 24 A3-6 Wilcoxin Ws Distribution Table N1 = 5 N1 = 6 N2 0.5 1.0 2.5 5.0% 0.5 1.0 2.5 5.0% 5 15 16 17 19 . . . . 6 16 17 18 20 23 24 26 28 7 16 16 18 21 24 25 27 29 8 17 19 21 23 25 27 29 31 9 18 20 22 24 26 28 31 33 10 19 21 23 26 27 29 32 35 11 20 22 24 27 28 30 34 37 12 21 23 26 28 30 32 35 38 13 22 24 27 30 31 33 37 40 14 22 25 28 31 32 34 38 42 15 23 26 29 33 33 36 40 44 16 24 27 30 34 34 37 42 46 17 25 28 32 35 36 39 43 47 18 26 29 33 37 37 40 45 49 19 27 30 34 38 38 41 46 51 20 28 31 35 40 39 43 48 53 21 29 32 37 41 40 44 50 55 22 29 33 38 43 42 45 51 57 23 30 34 39 44 43 47 53 59 24 31 35 40 45 44 48 54 60 25 32 36 42 47 45 50 56 62 N1 = 7 N1 = 8 N2 0.5 1.0 2.5 5.0% 0.5 1.0 2.5 5.0% 7 32 34 36 39 8 34 35 38 41 43 45 49 51 9 35 37 40 43 45 47 51 54 10 37 39 42 45 47 49 53 56 11 38 40 44 47 49 51 55 59 12 40 42 46 49 51 53 58 62 13 41 44 48 52 53 56 60 64 14 43 45 50 54 54 58 62 67 15 44 47 52 56 56 60 65 69 16 46 49 54 58 58 62 67 72 17 47 51 56 61 60 64 70 75 18 49 52 58 63 62 66 72 77 19 50 54 60 65 64 68 74 80 20 52 56 62 67 66 70 77 83 21 53 58 64 69 68 72 79 85 22 55 59 66 72 70 74 81 88 23 57 61 68 74 71 76 84 90 24 58 63 70 76 73 78 86 93 25 60 64 72 78 75 81 89 96 .....continued in Howell to N1 = 25 Adapted from David Howell, Statistical Methods for Psychology (Boston: Duxbury Press, 1982), 537-538
  • 7. © 4th ed. 2006 Dr. Rick Yount Tables Wilcoxin T Distribution Table A3-7 Critical Value Table for the Wilcoxin Matched Pairs Ordinal Test Chapter 24 .05 .025 .01 .005 number of pairs N T αααα T αααα T αααα T αααα 5 0 .0313 1 .0625 6 2 .0469 0 .0156 3 .0781 1 .0313 7 3 .0391 2 .0234 0 .0078 4 .0547 3 .0391 1 .0156 8 5 .0391 3 .0195 1 .0078 0 .0039 6 .0547 4 .0273 2 .0117 1 .0078 9 8 .0488 5 .0195 3 .0098 1 .0039 9 .0645 6 .0273 4 .0137 2 .0059 10 10 .0420 8 .0244 5 .0098 3 .0049 11 .0527 9 .0322 6 .0137 4 .0068 11 13 .0415 10 .0210 7 .0093 5 .0049 14 .0508 11 .0269 8 .0122 6 .0068 12 17 .0461 13 .0212 9 .0081 7 .0046 18 .0549 14 .0261 10 .0105 8 .0061 13 21 .0471 17 .0239 12 .0085 9 .0040 22 .0549 18 .0287 13 .0107 10 .0052 14 25 .0453 21 .0247 15 .0083 12 .0043 26 .0520 22 .0290 16 .0101 13 .0054 15 30 .0473 25 .0240 19 .0090 15 .0042 31 .0535 26 .0277 20 .0108 16 .0051 16 35 .0467 29 .0222 23 .0091 19 .0046 36 .0523 30 .0253 24 .0107 20 .0055 17 41 .0492 34 .0224 27 .0087 23 .0047 42 .0544 35 .0253 28 .0101 24 .0055 18 47 .0494 40 .0241 32 .0091 27 .0045 48 .0542 41 .0269 33 .0104 28 .0052 19 53 .0478 46 .0247 37 .0090 32 .0047 54 .0521 47 .0273 38 .0102 33 .0054 20 60 .0487 52 .0242 43 .0096 37 .0047 61 .0527 53 .0266 44 .0107 38 .0053 .....continued in Howell to N = 50 Adapted from David Howell, Statistical Methods for Psychology (Boston: Duxbury Press, 1982), 541
  • 8. Research Design and Statistical Analysis in Christian Ministry © 4th ed. 2006 Dr. Rick Yount Critical Value Table for the Studentized-Range Statistic - Used with Chapter 24 A3-8 q-Distribution Table r = Number of Steps Between Ordered Means 2 3 4 5 6 7 8 9 10 1 17.97 26.98 32.82 37.08 40.41 43.12 45.40 47.36 49.07 2 6.08 8.33 9.80 10.88 11.74 12.44 13.03 13.54 13.99 3 4.50 5.91 6.82 7.50 8.04 8.48 8.85 9.18 9.46 4 3.93 5.04 5.76 6.29 6.71 7.05 7.35 7.60 7.33 5 3.64 4.60 5.22 5.67 6.03 6.33 6.58 6.80 7.00 6 3.46 4.34 4.90 5.31 5.63 5.90 6.12 6.32 6.49 7 3.34 4.16 4.68 5.06 5.36 5.61 5.82 6.00 6.16 8 3.26 4.04 4.53 4.89 5.17 5.40 5.60 5.77 5.92 9 3.20 3.95 4.42 4.76 5.02 5.24 5.43 5.60 5.74 10 3.15 3.88 4.33 4.65 4.91 5.12 5.30 5.46 5.60 11 3.11 3.82 4.26 4.57 4.82 5.03 5.20 5.35 5.49 12 3.08 3.77 4.20 4.51 4.75 4.95 5.12 5.26 5.40 13 3.06 3.74 4.15 4.45 4.69 4.88 5.05 5.19 5.32 14 3.03 3.70 4.11 4.41 4.64 4.83 4.99 5.13 5.25 15 3.01 3.67 4.08 4.37 4.60 4.78 4.94 5.08 5.20 16 3.00 3.65 4.05 4.33 4.56 4.74 4.90 5.03 5.15 17 2.98 3.63 4.02 4.30 4.52 4.70 4.86 4.99 5.11 18 2.97 3.61 4.00 4.28 4.50 4.67 4.82 4.96 5.07 19 2.96 3.59 3.98 4.25 4.47 4.64 4.79 4.92 5.04 20 2.95 3.58 3.96 4.23 4.44 4.62 4.77 4.90 5.01 24 2.92 3.53 3.90 4.17 4.37 4.54 4.68 4.81 4.92 30 2.89 3.49 3.84 4.10 4.30 4.46 4.60 4.72 4.82 40 2.86 3.44 3.79 4.04 4.23 4.39 4.52 4.64 4.74 60 2.83 3.40 3.74 3.98 4.16 4.31 4.44 4.55 4.65 120 2.80 3.36 3.69 3.92 4.10 4.24 4.36 4.47 4.56 ∞ 2.77 3.31 3.63 3.86 4.03 4.17 4.29 4.39 4.47 .....continued in Howell to r = 15 Adapted from David Howell, Statistical Methods for Psychology (Boston: Duxbury Press, 1982), 532 dfw
  • 9. © 4th ed. 2006 Dr. Rick Yount Tables U-Distribution Table A3-9 Critical Value Table for the Mann-Whitney U test Chapter 24 N2 N2 1-tail test at α = 0.025 or 2-tail test at αααα = 0.05 1-tail test at αααα = 0.05 or 2-tail test at α = 0.10 N1 1 2 3 4 5 6 7 8 9 10 11 12 13 14 15 16 17 18 19 20 12 0 0 0 0 1 1 1 1 1 2 2 2 2 3 0 1 1 2 2 3 3 4 4 5 5 6 6 7 7 8 4 0 1 2 3 4 4 5 6 7 8 9 10 11 11 12 13 13 5 0 1 2 3 5 6 7 8 9 11 12 13 14 15 17 18 19 20 6 1 2 3 5 6 8 10 11 13 14 16 17 19 21 22 24 25 27 7 1 3 5 6 8 10 12 14 16 18 20 22 24 26 28 30 32 34 8 0 2 4 6 8 10 13 15 17 19 22 24 26 29 21 34 36 38 41 9 0 2 4 7 10 12 15 17 20 23 26 28 31 34 37 39 42 45 48 10 0 3 5 8 11 14 17 20 23 26 29 33 36 39 42 45 48 52 55 11 0 3 6 9 13 16 19 23 26 30 33 37 40 44 47 51 55 58 62 12 1 4 7 11 14 18 22 26 29 33 37 41 45 49 53 57 61 65 69 13 1 4 8 12 16 20 24 28 33 37 41 45 50 54 59 63 67 72 76 14 1 5 9 13 17 22 26 31 36 40 45 50 55 59 64 67 74 78 83 15 1 5 10 14 19 24 29 34 39 44 49 54 59 64 70 75 80 85 90 16 1 6 11 15 21 26 31 37 42 47 53 59 64 70 75 81 86 92 98 17 2 6 11 17 22 28 34 39 45 51 57 63 67 75 81 87 93 99 105 18 2 7 12 18 24 30 36 42 48 55 61 67 74 80 86 93 99 106 112 19 2 7 13 19 25 32 38 45 52 58 65 72 78 95 92 99 106 113 119 20 2 8 13 20 27 34 41 48 55 62 69 76 83 90 98 105 112 119 127 N1 1 2 3 4 5 6 7 8 9 10 11 12 13 14 15 16 17 18 19 20 12 0 0 0 1 1 1 1 2 2 2 3 3 3 4 4 4 3 0 0 1 2 2 3 3 4 5 5 6 7 7 8 9 9 10 11 4 0 1 2 3 4 5 6 7 8 9 10 11 12 14 15 16 17 18 5 0 1 2 4 5 6 8 9 11 12 13 15 16 18 19 20 22 23 25 6 0 2 3 5 7 8 10 12 14 16 17 19 21 23 25 26 28 30 32 7 0 2 4 6 8 11 13 15 17 19 21 24 26 28 30 33 35 37 39 8 1 3 5 8 10 13 15 18 20 23 26 28 31 33 36 39 41 44 47 9 1 3 6 9 12 15 18 21 24 27 30 33 36 39 42 45 48 51 54 10 1 4 7 11 14 17 20 24 27 31 34 37 41 44 48 51 55 58 62 11 1 5 8 12 16 19 23 27 31 34 38 42 46 50 54 57 61 65 69 12 2 5 9 13 17 21 26 30 34 38 42 47 51 55 60 64 68 72 77 13 2 6 10 15 19 24 28 33 37 42 47 51 56 61 65 70 75 80 84 14 2 7 11 16 21 26 31 36 41 46 51 56 61 66 71 77 82 87 92 15 3 7 12 18 23 28 33 39 44 50 55 61 66 72 77 83 88 94 100 16 3 8 14 19 25 30 36 42 48 54 60 65 71 77 83 89 95 101 107 17 3 9 15 20 26 33 39 45 51 57 64 70 77 83 89 96 102 109 115 18 4 9 16 22 28 35 41 48 55 61 68 75 82 88 95 102 109 116 123 19 0 4 10 17 23 30 37 44 51 58 65 72 80 87 94 101 109 116 123 130 20 0 4 11 18 25 32 39 47 54 62 69 77 84 92 100 107 115 123 130 138 N1 < N2 Adapted from Robert Johnson, Elementary Statistics, 6th ed. (Boston: PWS-Kent Publishing, 1992), Appendix F-20
  • 10. Research Design and Statistical Analysis in Christian Ministry © 4th ed. 2006 Dr. Rick Yount A3-10