Summary of Descriptive Statistics - Handout
•
2 gefällt mir•952 views

A summary of all fundamental concepts in descriptive statistics on a single page, with Excel functions: measures of central tendency, measures of variation, percentiles, five-number summary, etc.

Empfohlen
Weitere ähnliche Inhalte
Andere mochten auch
Andere mochten auch (20)
Mehr von Toni Menninger
Mehr von Toni Menninger (17)
Kürzlich hochgeladen
Kürzlich hochgeladen (20)
Summary of Descriptive Statistics - Handout
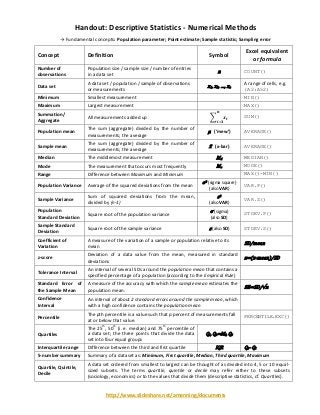
- 1. http://www.slideshare.net/amenning/documents Handout: Descriptive Statistics - Numerical Methods → Fundamental concepts: Population parameter; Point estimate; Sample statistic; Sampling error Concept Definition Symbol Excel equivalent or formula Number of observations Population size / sample size / number of entries in a data set n COUNT() Data set A data set / population / sample of observations or measurements x1, x2, …, xn A range of cells, e.g. (A2:A52) Minimum Smallest measurement MIN() Maximum Largest measurement MAX() Summation/ Aggregate All measurements added up ∑ 𝒙𝒊 𝒏 𝒊=𝟏 SUM() Population mean The sum (aggregate) divided by the number of measurements; the average μ (‘mew’) AVERAGE() Sample mean The sum (aggregate) divided by the number of measurements; the average x̄ (x-bar) AVERAGE() Median The middlemost measurement Md MEDIAN() Mode The measurement that occurs most frequently Mo MODE() Range Difference between Maximum and Minimum MAX()-MIN() Population Variance Average of the squared deviations from the mean σ2 (sigma square) (also VAR) VAR.P() Sample Variance Sum of squared deviations from the mean, divided by (n-1) s2 (also VAR) VAR.S() Population Standard Deviation Square root of the population variance σ (sigma) (also SD) STDEV.P() Sample Standard Deviation Square root of the sample variance s (also SD) STDEV.S() Coefficient of Variation A measure of the variation of a sample or population relative to its mean SD/mean z-score Deviation of a data value from the mean, measured in standard deviations z=(x-mean)/SD Tolerance Interval An interval of several SDs around the population mean that contains a specified percentage of a population (according to the Empirical Rule) Standard Error of the Sample Mean A measure of the accuracy with which the sample mean estimates the population mean. SE=SD/√n Confidence Interval An interval of about 2 standard errors around the sample mean, which with a high confidence contains the population mean Percentile The pth percentile is a value such that p percent of measurements fall at or below that value. PERCENTILE.EXC() Quartiles The 25 th , 50 th (i. e. median) and 75 th percentile of a data set; the three points that divide the data set into four equal groups Q1, Q2=Md, Q3 Interquartile range Difference between the third and first quartile IQR Q3- Q1 5-number summary Summary of a dataset as: Minimum, First quartile, Median, Third quartile, Maximum Quartile, Quintile, Decile A data set ordered from smallest to largest can be thought of as divided into 4, 5 or 10 equal- sized subsets. The terms quartile, quintile or decile may refer either to these subsets (sociology, economics) or to the values that divide them (descriptive statistics, cf. Quartiles).