Credit Crisis Watch
•Als DOC, PDF herunterladen•
1 gefällt mir•595 views

Credit Crisis Indicators, TED Spread, LIBOR, OIS

Empfohlen
Weitere ähnliche Inhalte
Was ist angesagt?
Was ist angesagt? (20)
Andere mochten auch
Ähnlich wie Credit Crisis Watch
Ähnlich wie Credit Crisis Watch (20)
Mehr von Amar Ranu
Mehr von Amar Ranu (11)
Kürzlich hochgeladen
Kürzlich hochgeladen (20)
Credit Crisis Watch
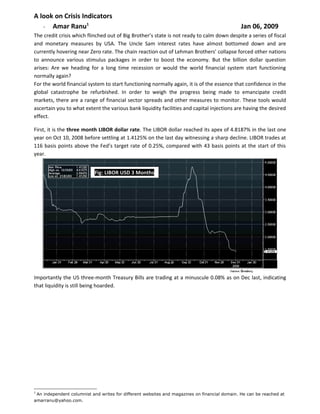
- 1. A look on Crisis Indicators - Amar Ranu Jan 06, 2009 1 The credit crisis which flinched out of Big Brother’s state is not ready to calm down despite a series of fiscal and monetary measures by USA. The Uncle Sam interest rates have almost bottomed down and are currently hovering near Zero rate. The chain reaction out of Lehman Brothers’ collapse forced other nations to announce various stimulus packages in order to boost the economy. But the billion dollar question arises: Are we heading for a long time recession or would the world financial system start functioning normally again? For the world financial system to start functioning normally again, it is of the essence that confidence in the global catastrophe be refurbished. In order to weigh the progress being made to emancipate credit markets, there are a range of financial sector spreads and other measures to monitor. These tools would ascertain you to what extent the various bank liquidity facilities and capital injections are having the desired effect. First, it is the three month LIBOR dollar rate. The LIBOR dollar reached its apex of 4.8187% in the last one year on Oct 10, 2008 before settling at 1.4125% on the last day witnessing a sharp decline. LIBOR trades at 116 basis points above the Fed’s target rate of 0.25%, compared with 43 basis points at the start of this year. Fig: LIBOR USD 3 Months Importantly the US three-month Treasury Bills are trading at a minuscule 0.08% as on Dec last, indicating that liquidity is still being hoarded. 1 An independent columnist and writes for different websites and magazines on financial domain. He can be reached at amarranu@yahoo.com.
- 2. Fig: US 3Months Treasury Bill Rate The second watch is the TED spread (i.e. Three-month dollar LIBOR minus three-month Treasury Bills). It is a measure of perceived credit risk in the economy. This is because T-bills are considered risk-free while LIBOR reflects the credit risk of lending to commercial banks. An increase in TED spread is a sign that lenders believe the risk of default on inter bank loans (also known as counterparty risk) is increasing. Interbank lenders therefore demand a higher rate of interest, or accept lower returns on safe investments such as T-bills. On the hand, when the risk of bank defaults is considered to be decreasing, the TED spread narrow. Since the TED spread’s peak of 4.65% on October 10, the measure has eased to 1.46% – a level last seen prior to the Lehman bankruptcy in September. Fig: LIBOR USD 3 Month - 3 Month Treasury Bills Spread The third indicator to gauge the credit market stress is the difference between the LIBOR rate and the overnight index swap (OIS). When the LIBOR-OIS spread is increasing, it indicates that banks believe the other banks they are lending to have a higher risk of defaulting on the loans so they are charging a higher interest rate to offset this risk. The opposite applies to a narrowing LIBOR-OIS spread. The difference between those two rates is the perceived availability of funds available for short-term loans. The higher the LIBOR-OIS spread, the less money there is for lending.
- 3. The movement in the LIBOR-OIS spread over the past few weeks is similar to the TED spread and shows that credit markets are still not functioning. However, the LIBOR-OIS spread is now back to 1.24, which is the lowest (healthiest) reading since September. The fourth indicator worth keeping an eye on is the Barron’s Confidence Index. This index is calculated by dividing the average indicative yield on high-grade bonds by the average yield on intermediate-grade bonds. The discrepancy between the yields is indicative of investors’ confidence. A declining ration indicates that investors are demanding a lower premium in yield for increased risk, showing waning confidence in the economy. In summary, although some progress has been made as a result of central banks’ liquidity injections and other monetary and fiscal measures, the credit markets are not yet liquefying.