More Related Content
Similar to Istation monthly report for 2018 rdg dec (20)
More from albertrodriguez5150 (20)
Istation monthly report for 2018 rdg dec
- 1. Campus SEPT OCT NOV DEC T1 T2 T3 # SEPT OCT NOV DEC T1 T2 T3 # SEPT OCT NOV DEC T1 T2 T3 # SEPT OCT NOV DEC T1 T2 T3 #
Austin 77% 79% 86% 30 4 1 35 54% 64% 74% 68% 34 9 7 50 41% 54% 65% 62% 34 19 2 55 63% 57% 69% 73% 43 7 9 59
Bonham 62% 67% 70% 47 16 4 67 63% 77% 67% 71% 56 14 9 79 55% 49% 61% 67% 60 23 7 90 61% 65% 68% 66% 73 23 14 110
Bowie 52% 65% 58% 15 7 4 26 38% 56% 62% 65% 30 10 6 46 33% 46% 54% 45% 19 17 6 42 67% 72% 74% 68% 41 14 5 60
Crockett 53% 61% 83% 15 3 18 81% 69% 82% 93% 26 2 28 49% 48% 51% 50% 27 14 13 54 45% 56% 56% 63% 35 10 11 56
Dishman 62% 62% 62% 23 4 10 37 53% 71% 76% 86% 36 4 2 42 65% 81% 86% 76% 38 11 1 50 66% 72% 71% 69% 40 10 8 58
Houston 43% 58% 67% 24 6 6 36 40% 48% 61% 64% 39 17 5 61 46% 47% 58% 54% 40 25 9 74 56% 49% 65% 58% 29 14 7 50
Jefferson 43% 46% 51% 19 7 11 37 47% 58% 57% 55% 18 4 11 33 51% 54% 73% 74% 29 6 4 39 70% 68% 69% 71% 34 8 6 48
Lamar 30% 44% 47% 18 11 9 38 48% 68% 67% 69% 43 9 10 62 39% 42% 52% 49% 31 22 10 63 48% 55% 52% 59% 37 16 10 63
Long 65% 69% 77% 51 7 8 66 60% 67% 69% 70% 57 15 10 82 56% 55% 59% 54% 44 26 12 82 56% 56% 60% 59% 60 25 17 102
Means 57% 53% 69% 31 7 7 45 53% 68% 65% 69% 44 14 6 64 64% 65% 78% 67% 53 19 7 79 74% 69% 76% 77% 56 12 5 73
Milam N/T 41% 50% 12 3 9 24 36% 49% 55% 50% 23 12 11 46 35% 50% 64% 56% 27 14 7 48 53% 57% 58% 67% 31 3 12 46
Rodriguez 65% 58% 59% 32 9 13 54 51% 71% 71% 70% 56 15 9 80 40% 57% 58% 57% 62 25 22 109 54% 48% 55% 60% 56 12 26 94
Stuart 60% 68% 73% 48 8 10 66 63% 71% 76% 78% 71 11 9 91 65% 67% 74% 67% 72 23 13 108 71% 79% 80% 82% 96 13 8 117
Travis 38% 42% 50% 15 6 9 30 49% 66% 70% 71% 27 6 5 38 38% 48% 56% 51% 18 9 8 35 55% 55% 63% 56% 33 12 7 52
THE 51% 61% 63% 52 15 15 82 53% 63% 72% 74% 73 21 5 99 62% 64% 68% 64% 85 27 21 133 74% 72% 76% 83% 110 15 7 132
Wilson 52% 80% 69% 24 9 2 35 65% 65% 71% 67% 34 9 8 51 58% 69% 75% 70% 42 16 2 60 76% 68% 76% 71% 53 16 6 75
Zavala 44% 56% 57% 16 6 6 28 52% 57% 65% 62% 31 11 8 50 45% 50% 56% 48% 26 21 7 54 54% 53% 59% 59% 30 12 9 51
Campus SEPT OCT NOV DEC T1 T2 T3 # SEPT OCT NOV DEC T1 T2 T3 # SEPT OCT NOV DEC T1 T2 T3 #
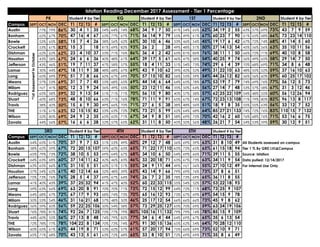
Austin 64% 65% 61% 70% 37 9 7 53 51% 53% 49% 60% 29 12 7 48 56% 69% 59% 63% 31 8 10 49 All Students assessed on campus
Bonham 58% 62% 59% 67% 72 20 15 107 59% 60% 65% 65% 71 22 17 110 65% 72% 65% 65% 61 15 18 94 Tier 1 % By GRD LVL&Campus
Bowie 65% 79% 73% 72% 38 10 5 53 69% 64% 67% 68% 34 10 6 50 64% 69% 66% 71% 39 11 5 55 Source: Istation
Crockett 64% 63% 68% 60% 37 14 11 62 42% 46% 43% 46% 33 20 18 71 63% 67% 73% 63% 34 11 9 54 Data pulled: 12/14/2017
Dishman 63% 65% 66% 61% 31 15 5 51 60% 51% 51% 55% 24 9 11 44 49% N/T 56% 55% 27 10 12 49 For Internal Use Only
Houston 57% 54% 62% 61% 40 12 14 66 52% 48% 59% 65% 43 14 9 66 79% 69% 76% 73% 37 8 6 51
Jefferson 75% 73% 76% 76% 28 5 4 37 69% 67% 64% 74% 26 7 2 35 78% 73% 69% 65% 36 11 8 55
Lamar 41% 40% 43% 39% 37 25 32 94 41% 47% 40% 52% 60 22 33 115 55% 54% 52% 57% 53 22 18 93
Long 59% 63% 66% 69% 63 20 8 91 70% 70% 71% 73% 72 15 12 99 64% 72% 71% 68% 73 25 9 107
Means 64% 68% 67% 72% 67 17 9 93 68% 74% 73% 70% 65 16 12 93 73% 67% 69% 69% 54 15 9 78
Milam 50% 53% 54% 46% 31 16 21 68 57% 48% 50% 46% 25 17 12 54 66% 66% 66% 73% 45 9 8 62
Rodriguez 56% 59% 60% 56% 59 22 25 106 50% 54% 58% 57% 73 29 25 127 65% 70% 69% 59% 63 24 19 106
Stuart 76% 78% 81% 74% 92 26 7 125 75% 77% 79% 80% 105 16 11 132 79% 79% 74% 78% 85 15 9 109
Travis 44% 60% 55% 56% 27 13 8 48 74% 79% 82% 77% 34 6 4 44 64% 69% 67% 65% 35 6 13 54
THE 72% 78% 77% 78% 104 22 8 134 70% 73% 74% 67% 91 30 15 136 65% 62% 54% 64% 70 28 12 110
Wilson 60% 65% 61% 62% 44 19 8 71 53% 62% 57% 61% 57 20 17 94 75% 66% 69% 73% 52 10 9 71
Zavala 65% 71% 68% 70% 43 13 5 61 63% 72% 68% 65% 33 8 10 51 72% 69% 69% 71% 35 8 6 49
Istation Reading December 2017 Assessment - Tier 1 Percentage
Student # by Tier
PK KG 1ST 2NDStudent # by Tier Student # by Tier Student # by Tier Student # by Tier
*1stAssessmentinOctober
5TH4TH3RD Student # by Tier Student # by Tier
- 2. Campus SEPT OCT NOV DEC T1 T2 T3 # SEPT OCT NOV DEC T1 T2 T3 # SEPT OCT NOV DEC T1 T2 T3 # SEPT OCT NOV DEC T1 T2 T3 #
Austin 100% 100% 100% 1 1 25% 42% 44% 38% 3 2 3 8 22% 50% 60% 60% 3 2 5 36% 36% 50% 58% 7 3 2 12
Bonham 0 0% 0% 0% 0 50% 0% 33% 33% 1 1 1 3 26% 24% 30% 26% 5 4 10 19
Bowie 50% 83% 63% 5 1 2 8 29% 60% 67% 60% 6 1 3 10 25% 43% 57% 43% 3 3 1 7 43% 57% 64% 47% 7 5 3 15
Crockett 0% 83% 15 3 18 100% 100% 100% 100% 2 2 25% 25% 29% 38% 8 7 6 21 44% 61% 58% 70% 14 3 3 20
Dishman 17% 17% 1 1 4 6 100% 100% 80% 4 1 5 57% 86% 86% 71% 5 2 7 56% 67% 60% 50% 5 3 2 10
Houston 0% 0% 1 1 43% 0% 0% 0% 1 1 45% 100% 67% 100% 2 2 22% 50% 100% 50% 2 1 1 4
Jefferson 0% 0% 33% 1 2 3 50% 60% 50% 50% 1 1 2 13% 6% 0% 0% 2 1 3 78% 72% 78% 76% 13 3 1 17
Lamar 0% 0% 33% 1 2 3 100% 60% 67% 80% 4 1 5 18% 60% 50% 50% 2 2 4 30% 60% 60% 80% 4 1 5
Long 50% 67% 67% 2 1 3 25% 50% 50% 100% 2 2 22% 44% 44% 56% 5 2 2 9 50% 50% 46% 55% 6 2 3 11
Means 0% 1 1 0% 0 100% 100% 100% 100% 3 3 100% 75% 75% 60% 3 2 5
Milam N/T 0% 25% 1 3 4 31% 0% 43% 33% 1 1 1 3 21% 20% 33% 23% 3 4 6 13 39% 28% 28% 41% 7 3 7 17
Rodriguez 0 0% 100% 100% 100% 1 1 43% 58% 50% 50% 3 3 6 29% 33% 28% 42% 8 1 10 19
Stuart 18% 55% 45% 5 3 3 11 36% 42% 33% 42% 5 1 6 12 65% 53% 56% 39% 7 6 5 18 67% 76% 76% 71% 15 5 1 21
Travis 0% 25% 0% 1 1 2 25% 0 6% 0% 0% 0% 1 1 62% 53% 64% 64% 9 1 4 14
THE 25% 0% 0% 1 2 3 44% 44% 50% 30% 3 5 2 10 23% 31% 38% 17% 2 5 5 12 67% 22% 56% 57% 4 1 2 7
Wilson 100% 0% 1 1 100% 75% 100% 100% 1 1 33% 50% 50% 100% 2 2 100% 80% 88% 67% 6 2 1 9
Zavala 0% 0% 1 1 50% 55% 55% 45% 5 3 3 11 29% 57% 43% 29% 2 2 3 7 56% 56% 61% 50% 9 6 3 18
AVG 27% 34% 31% 66 47% 53% 51% 61% 73 35% 46% 47% 48% 123 53% 53% 60% 57% 223
Campus SEPT OCT NOV DEC T1 T2 T3 # SEPT OCT NOV DEC T1 T2 T3 # SEPT OCT NOV DEC T1 T2 T3 #
Austin 71% 56% 56% 50% 4 4 8 17% 57% 43% 67% 4 1 1 6 25% 33% 75% 33% 1 2 3 Students w/ LEP Indicator Y
Bonham 44% 25% 38% 60% 3 2 5 30% 27% 25% 25% 3 2 7 12 20% 33% 29% 14% 1 6 7 Tier 1% By Grade Lvl&Campus
Bowie 59% 76% 65% 71% 12 4 1 17 56% 50% 50% 50% 8 5 3 16 56% 63% 63% 56% 5 1 3 9 Source: Istation
Crockett 57% 65% 68% 55% 12 6 4 22 47% 42% 56% 50% 15 8 7 30 69% 33% 50% 56% 5 4 9 Data pulled:
Dishman 50% 75% 46% 54% 7 6 13 40% 60% 60% 33% 2 2 2 6 38% 0% 36% 25% 3 5 4 12 For Internal Use Only
Houston 25% 25% 50% 20% 1 1 3 5 38% 33% 50% 55% 6 2 3 11 57% 57% 57% 71% 5 2 7
Jefferson 80% 73% 73% 71% 10 3 1 14 67% 45% 46% 67% 8 2 2 12 67% 55% 50% 53% 10 6 3 19
Lamar 39% 36% 36% 43% 18 7 17 42 36% 39% 38% 47% 15 8 9 32 44% 43% 36% 36% 8 7 7 22
Long 50% 50% 45% 45% 5 3 3 11 40% 40% 40% 40% 2 2 1 5 0% 14% 25% 13% 1 5 2 8
Means 36% 39% 42% 54% 13 7 4 24 58% 47% 50% 32% 6 8 5 19 71% 57% 46% 62% 8 2 3 13
Milam 47% 41% 16% 25% 5 7 8 20 61% 36% 47% 43% 6 4 4 14 33% 31% 40% 53% 8 2 5 15
Rodriguez 36% 58% 56% 46% 13 9 6 28 41% 52% 54% 42% 11 9 6 26 33% 33% 35% 35% 7 3 10 20
Stuart 60% 40% 70% 50% 5 3 2 10 25% 46% 54% 62% 8 1 4 13 88% 50% 78% 78% 7 2 9
Travis 40% 53% 40% 33% 5 8 2 15 75% 82% 70% 90% 9 1 10 13% 25% 13% 13% 1 3 4 8
THE 58% 67% 89% 60% 6 2 2 10 63% 67% 50% 40% 2 3 5 43% 43% 0% 50% 3 1 2 6
Wilson 56% 50% 60% 53% 8 5 2 15 50% 67% 46% 62% 8 4 1 13 83% 56% 70% 80% 8 1 1 10
Zavala 57% 52% 64% 67% 14 5 2 21 47% 29% 17% 0% 3 4 7 67% 43% 50% 80% 4 1 5
AVG 51% 52% 54% 50% 280 47% 48% 47% 47% 237 47% 39% 44% 48% 182
Istation Reading December 2017 Assessment - Tier 1 Percentage for LEP
Student # by Tier
PK KG 1ST 2NDStudent # by Tier Student # by Tier Student # by Tier Student # by Tier
*1stAssessmentinOctober
5TH4TH3RD Student # by Tier Student # by Tier
- 3. Campus SEPT OCT NOV DEC T1 T2 T3 # SEPT OCT NOV DEC T1 T2 T3 # SEPT OCT NOV DEC T1 T2 T3 # SEPT OCT NOV DEC T1 T2 T3 # SEPT OCT NOV DEC T1 T2 T3 #
Austin 100% 100% 50% 2 1 1 4 56% 44% 30% 30% 3 4 3 10 25% 0% 0% 0% 2 4 6 100% 100% 100% 100% 1 1 100% 1 1
Bonham 33% 50% 38% 3 5 8 67% 33% 67% 58% 7 2 3 12 73% 62% 77% 71% 10 4 14 0 0
Bowie 73% 82% 64% 7 2 2 11 50% 29% 100% 100% 3 3 0% 0% 0% 0% 1 1 0% 0% 0% 2 1 3 50% 50% 0
Crockett 83% 83% 83% 10 1 1 12 67% 67% 67% 73% 8 2 1 11 0% 0% 0 0 0
Dishman 0% 5 5 0% 17% 20% 50% 2 2 4 17% 0 0 100% 100% 100% 100% 1 1
Houston 63% 86% 86% 6 1 7 67% 44% 56% 78% 7 2 9 73% 67% 42% 67% 8 2 2 12 11% 50% 29% 2 2 3 7 75% 31% 75% 67% 2 1 3
Jefferson 40% 50% 0% 2 1 3 55% 82% 92% 91% 10 1 11 57% 43% 50% 64% 9 3 2 14 0 0
Lamar 60% 63% 48% 11 6 6 23 37% 53% 71% 79% 11 3 14 58% 58% 55% 58% 18 5 8 31 73% 69% 85% 92% 12 1 13 36% 44% 42% 45% 15 3 15 33
Long 38% 40% 2 1 2 5 ~~ 25% 57% 4 1 2 7 ~~ 20% 20% 1 1 3 5 ~~ 0% 1 1 ~~ 0
Means 38% 56% 57% 8 3 3 14 36% 43% 47% 67% 10 2 3 15 72% 72% 66% 57% 16 11 1 28 73% 52% 75% 77% 23 6 1 30 50% 0% 0% 0% 1 1
Milam 36% 40% 6 4 5 15 29% 48% 55% 65% 13 5 2 20 39% 42% 36% 39% 14 11 11 36 30% 30% 34% 26% 7 9 11 27 26% 28% 26% 24% 8 6 20 34
Rodriguez 67% 91% 55% 6 3 2 11 38% 69% 85% 100% 14 14 33% 36% 38% 62% 8 3 2 13 0 33% 33% 33% 33% 1 2 3
Stuart 55% 80% 40% 2 1 2 5 36% 36% 63% 50% 4 1 3 8 44% 41% 47% 8 2 7 17 0 0% 100% 100% 0
Travis 57% 25% 33% 3 3 3 9 38% 29% 40% 50% 7 3 4 14 50% 31% 25% 38% 6 3 7 16 33% 33% 50% 50% 1 1 2 0% 0% 0% 0% 1 1
Treasure
Hills
67% 33% 20% 1 4 5 40% 50% 50% 67% 2 1 3 33% 0% 0% 33% 1 2 3 0% 0% 0% 0% 1 1 33% 33% 33% 33% 1 1 1 3
Wilson 44% 67% 50% 3 2 1 6 54% 57% 38% 62% 8 3 2 13 80% 50% 60% 89% 8 1 9 100% 100% 100% 3 3 80% 75% 100% 0
Zavala 40% 43% 38% 3 4 1 8 8% 55% 36% 80% 8 2 10 14% 29% 2 2 3 7 67% 100% 100% 100% 2 2 0
AVG 57% 63% 44% 151 42% 46% 57% 68% 178 49% 34% 34% 45% 212 54% 50% 59% 52% 90 44% 44% 51% 45% 80
All Students assessed in Español
Tier 1 Percentages By Grade Level & Campus
Source: Istation
Data pulled: 12/15/2017
~~ No students assessed in Español
For Internal Use Only
*1stAssessmentinOctober
Istation Reading Español December 2017 Assessment - Tier 1 Percentage
PK Student # by Tier3RDKG 1ST 2NDStudent # by Tier Student # by Tier Student # by Tier Student # by Tier
- 4. Campus SEPT OCT NOV DEC T1 T2 T3 # SEPT OCT NOV DEC T1 T2 T3 # SEPT OCT NOV DEC T1 T2 T3 # SEPT OCT NOV DEC T1 T2 T3 #
Austin 100% 100% 100% 1 1 25% 50% 0 25% 25% 20% 25% 1 1 2 4 13% 0% 14% 14% 1 2 4 7
Bonham 50% 75% 25% 1 3 4 100% 50% 20% 0% 2 2 0 33% 33% 29% 33% 2 2 2 6
Bowie 0 0 0% 0% 0% 0% 1 1 100% 100% 100% 100% 2 2
Crockett 0 0% 0% 0% 0% 1 1 0% 0% 0% 0% 1 1 0% 0% 0% 0% 3 4 7
Dishman 50% 50% 50% 1 1 2 50% 50% 100% 100% 2 2 100% 100% 100% 100% 1 1 33% 20% 20% 20% 1 1 3 5
Houston 0 0% 0% 50% 50% 1 1 2 25% 25% 25% 25% 1 1 2 4 0% 0% 0% 25% 1 1 2 4
Jefferson 20% 40% 33% 2 3 1 6 0% 0% 0% 5 5 0% 50% 33% 0% 1 1 2 40% 40% 40% 40% 2 3 5
Lamar 0% 0% 0% 1 1 2 0% 0% 1 1 25% 0% 17% 0% 2 5 7 0% 0% 0% 0% 2 5 7
Long 100% 100% 1 1 33% 25% 67% 67% 2 1 3 17% 33% 20% 20% 1 3 1 5 17% 15% 14% 17% 2 2 8 12
Means 100% 0% 1 1 0% 0% 2 2 4 0% 0% 0% 0% 1 2 3 67% 67% 57% 67% 4 2 6
Milam 0 0% 0% 0% 0% 1 1 2 0% 0% 0% 0% 1 1 2 50% 50% 33% 33% 1 2 3
Rodriguez 0% 100% 0% 1 1 33% 25% 25% 50% 2 2 4 17% 14% 14% 14% 1 1 5 7 25% 0% 14% 17% 1 5 6
Stuart 0% 100% 100% 2 2 67% 67% 67% 67% 2 1 3 20% 20% 17% 0% 3 3 6 100% 100% 100% 100% 1 1
Travis 0 0% 50% 50% 50% 1 1 2 0% 0% 0% 0% 2 2 50% 0% 50% 50% 1 1 2
Treasure Hills 0% 0% 50% 1 1 2 80% 50% 80% 60% 3 1 1 5 33% 20% 40% 20% 1 1 3 5 33% 33% 20% 40% 2 2 1 5
Wilson 0 100% 100% 100% 100% 1 1 0% 0% 100% 100% 1 1 0% 100% 0% 1 1
Zavala 33% 67% 0% 3 3 40% 40% 57% 43% 3 2 2 7 0% 20% 0% 20% 1 1 3 5 67% 67% 67% 67% 2 1 3
AVG 28% 67% 42% 25 41% 36% 41% 39% 44 16% 19% 24% 20% 56 39% 31% 39% 37% 82
Campus SEPT OCT NOV DEC T1 T2 T3 # SEPT OCT NOV DEC T1 T2 T3 # SEPT OCT NOV DEC T1 T2 T3 #
Austin 40% 20% 25% 25% 1 1 2 4 0% 29% 17% 20% 1 3 1 5 13% 33% 25% 13% 2 1 5 8 All Students w/SPED Indicator(Y)
Bonham 20% 0% 20% 13% 1 1 6 8 17% 13% 9% 9% 1 1 9 11 14% 29% 18% 18% 2 9 11 Tier 1 % By Grd Lvl & Campus
Bowie 0% 0% 0% 0% 4 4 0% 20% 17% 17% 1 5 6 0% 0% 0% 0% 2 3 5 Source: Istation
Crockett 42% 17% 33% 27% 3 1 7 11 0% 0% 0% 0% 1 7 8 13% 10% 17% 0% 4 7 11 Data pulled:
Dishman 0% 33% 0% 0% 2 1 3 0% 0% 0% 0% 1 4 5 25% 0% 25% 25% 1 3 4 For Internal Use Only
Houston 13% 0% 17% 0% 1 5 6 11% 0% 0% 22% 2 2 5 9 50% 30% 36% 18% 2 3 6 11
Jefferson 33% 0% 0% 0% 1 4 5 0 0% 0% 0% 50% 1 1 2
Lamar 0% 0% 0% 0% 7 7 0% 0% 0% 0% 1 14 15 0% 0% 0% 0% 1 7 8
Long 7% 21% 14% 23% 3 4 6 13 0% 0% 10% 0% 1 9 10 6% 0% 6% 13% 2 6 8 16
Means 0% 0% 0% 20% 1 4 5 50% 33% 33% 33% 1 1 1 3 25% 14% 25% 33% 3 1 5 9
Milam 17% 0% 0% 25% 2 6 8 0% 0% 0% 13% 1 1 6 8 14% 14% 17% 0% 2 3 5
Rodriguez 25% 22% 20% 18% 2 9 11 25% 18% 18% 17% 2 2 8 12 7% 7% 6% 6% 1 4 12 17
Stuart 100% 100% 100% 100% 2 2 33% 33% 33% 33% 2 2 2 6 0% 50% 0% 0% 1 1
Travis 0% 25% 0% 20% 1 1 3 5 25% 0% 50% 20% 1 1 3 5 11% 11% 8% 0% 2 10 12
Treasure Hills 33% 40% 50% 50% 4 2 2 8 17% 13% 7% 21% 3 3 8 14 25% 0% 20% 0% 2 2
Wilson 9% 20% 17% 8% 1 5 6 12 10% 10% 10% 10% 1 5 4 10 36% 27% 36% 27% 3 3 5 11
Zavala 33% 33% 33% 33% 1 2 3 33% 33% 17% 0% 5 5 13% 25% 11% 11% 1 3 5 9
AVG 22% 19% 19% 21% 115 14% 13% 14% 13% 132 15% 15% 15% 13% 142
*1stAssessmentinOctober
5TH4TH3RD Student # by TierStudent # by TierStudent # by Tier
Istation Reading December 2017 Assessment - Tier 1 Percentage for SPED
PK KG 1ST 2NDStudent # by Tier Student # by Tier Student # by Tier Student # by Tier