Consider the following data x 0 –2 1 1 2 y 2 –2 5 4 8 Find .pdf
•
0 likes•2 views
The document provides data points (x, y) and asks to find the equation of the least squares regression line. It shows the step-by-step calculations of finding the slope and y-intercept using the formulae for least squares regression. The regression line calculated from the data is y = 0.128x + 0.896.
Report
Share
Report
Share
Download to read offline
Recommended
Recommended
Mehran University Newsletter is a Quarterly Publication from Public Relations OfficeMehran University Newsletter Vol-X, Issue-I, 2024
Mehran University Newsletter Vol-X, Issue-I, 2024Mehran University of Engineering & Technology, Jamshoro
More Related Content
Recently uploaded
Mehran University Newsletter is a Quarterly Publication from Public Relations OfficeMehran University Newsletter Vol-X, Issue-I, 2024
Mehran University Newsletter Vol-X, Issue-I, 2024Mehran University of Engineering & Technology, Jamshoro
Recently uploaded (20)
Basic Civil Engineering first year Notes- Chapter 4 Building.pptx
Basic Civil Engineering first year Notes- Chapter 4 Building.pptx
This PowerPoint helps students to consider the concept of infinity.
This PowerPoint helps students to consider the concept of infinity.
Food safety_Challenges food safety laboratories_.pdf
Food safety_Challenges food safety laboratories_.pdf
Salient Features of India constitution especially power and functions
Salient Features of India constitution especially power and functions
Kodo Millet PPT made by Ghanshyam bairwa college of Agriculture kumher bhara...
Kodo Millet PPT made by Ghanshyam bairwa college of Agriculture kumher bhara...
Jual Obat Aborsi Hongkong ( Asli No.1 ) 085657271886 Obat Penggugur Kandungan...
Jual Obat Aborsi Hongkong ( Asli No.1 ) 085657271886 Obat Penggugur Kandungan...
Mixin Classes in Odoo 17 How to Extend Models Using Mixin Classes
Mixin Classes in Odoo 17 How to Extend Models Using Mixin Classes
Featured
Featured (20)
Product Design Trends in 2024 | Teenage Engineerings
Product Design Trends in 2024 | Teenage Engineerings
How Race, Age and Gender Shape Attitudes Towards Mental Health
How Race, Age and Gender Shape Attitudes Towards Mental Health
AI Trends in Creative Operations 2024 by Artwork Flow.pdf
AI Trends in Creative Operations 2024 by Artwork Flow.pdf
Content Methodology: A Best Practices Report (Webinar)
Content Methodology: A Best Practices Report (Webinar)
How to Prepare For a Successful Job Search for 2024
How to Prepare For a Successful Job Search for 2024
Social Media Marketing Trends 2024 // The Global Indie Insights
Social Media Marketing Trends 2024 // The Global Indie Insights
Trends In Paid Search: Navigating The Digital Landscape In 2024
Trends In Paid Search: Navigating The Digital Landscape In 2024
5 Public speaking tips from TED - Visualized summary
5 Public speaking tips from TED - Visualized summary
Google's Just Not That Into You: Understanding Core Updates & Search Intent
Google's Just Not That Into You: Understanding Core Updates & Search Intent
The six step guide to practical project management
The six step guide to practical project management
Beginners Guide to TikTok for Search - Rachel Pearson - We are Tilt __ Bright...
Beginners Guide to TikTok for Search - Rachel Pearson - We are Tilt __ Bright...
Unlocking the Power of ChatGPT and AI in Testing - A Real-World Look, present...
Unlocking the Power of ChatGPT and AI in Testing - A Real-World Look, present...
Consider the following data x 0 –2 1 1 2 y 2 –2 5 4 8 Find .pdf
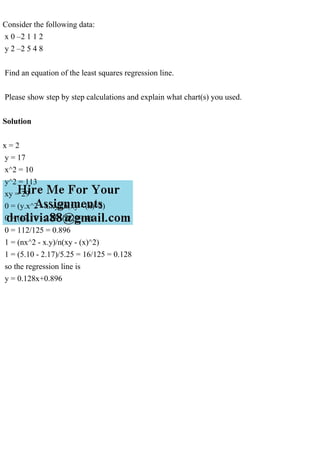
- 1. Consider the following data: x 0 –2 1 1 2 y 2 –2 5 4 8 Find an equation of the least squares regression line. Please show step by step calculations and explain what chart(s) you used. Solution x = 2 y = 17 x^2 = 10 y^2 = 113 xy = 29 0 = (y.x^2 - x.xy)/n(xy - (x)^2) 0 = (17.10 - 2.29)/5(29 - 4) 0 = 112/125 = 0.896 1 = (nx^2 - x.y)/n(xy - (x)^2) 1 = (5.10 - 2.17)/5.25 = 16/125 = 0.128 so the regression line is y = 0.128x+0.896