
Empfohlen
Empfohlen
Weitere ähnliche Inhalte
Was ist angesagt?
Was ist angesagt? (16)
Ähnlich wie EED406 2014 E-tivity 3
Ähnlich wie EED406 2014 E-tivity 3 (20)
Kürzlich hochgeladen
Kürzlich hochgeladen (20)
EED406 2014 E-tivity 3
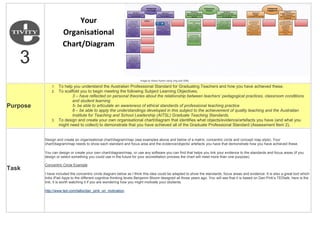
- 1. 3 Image by Alison Ayrton using Jing and Gliffy Purpose 1. To help you understand the Australian Professional Standard for Graduating Teachers and how you have achieved these. 2. To scaffold you to begin meeting the following Subject Learning Objectives; 3 – have reflected on personal theories about the relationship between teachers’ pedagogical practices, classroom conditions and student learning 5- be able to articulate an awareness of ethical standards of professional teaching practice 8 – be able to apply the understandings developed in this subject to the achievement of quality teaching and the Australian Institute for Teaching and School Leadership (AITSL) Graduate Teaching Standards. 3. To design and create your own organisational chart/diagram that identifies what objects/evidence/artefacts you have (and what you might need to collect) to demonstrate that you have achieved all of the Graduate Professional Standard (Assessment Item 2). Task Design and create an organisational chart/diagram/map (see examples above and below of a matrix, concentric circle and concept map style). Your chart/diagram/map needs to show each standard and focus area and the evidence/objects/ artefacts you have that demonstrate how you have achieved these. You can design or create your own chart/diagram/map, or use any software you can find that helps you link your evidence to the standards and focus areas (if you design or select something you could use in the future for your accreditation process the chart will meet more than one purpose). Concentric Circle Example I have included the concentric circle diagram below as I think this idea could be adapted to show the standards, focus areas and evidence. It is also a great tool which links iPad Apps to the different cognitive thinking levels Benjamin Bloom designed all those years ago. You will see that it is based on Dan Pink’s TEDtalk, here is the link, it is worth watching it if you are wondering how you might motivate your students. http://www.ted.com/talks/dan_pink_on_motivation Your Organisational Chart/Diagram
- 2. Concept Map Example Concept mapping is a tool that helps you organise your thinking and to see the interconnected way concepts and thoughts operate. It would be a great tool to use to map out the standards, focus areas and your evidence. I have had an initial fiddle with the Edraw Mind Map Freeware – I use IThoughts on my iPad which I find is
- 3. user friendly and great to record meeting notes. Read some more about ways to use this in the classroom at the useful link here: http://www.readingrockets.org/strategies/concept_maps I found some useful free internet resources and had a fiddle with this Edraw one – I think I quite like the way you can create your own map with these tools and it is quite easy to use, I had to sign up and down load the free version to access this and have only used the very basic functions, but it might give you an idea of how you will be able to link several focus areas to one object/artefact see the Unit plan example below. http://www.edrawsoft.com/examples.php
- 4. You need to attach your object to a forum post, be mindful of the size so it can be easily uploaded, you may need to ‘zip’ your files for easier access. Your chart/diagram needs to be submitted before the beginning of week 10 – Monday 5 May, 2014 to enable you to begin annotating your objects/evidence/ artefacts and assembling your portfolio (Assessment Item 2). Try a quick search of Google images of diagrams, charts which will throw up a myriad of examples, these are useful to show the types of graphics which will be appropriate and helpful as a starting point: Be sure to read them carefully, I didn’t, and found my ‘free trial’ to Gliffy runs out in 13 days! Darn! Response You need to read and view each others’ contributions (as many as you can manage) and respond with constructive feedback via the forum. Be mindful that this is in the public domain and all of your communications must be professional. This is the heart of the e-tivity, because this is where the learner-learner interaction comes in. A tip: select people you don’t know so well to gain a more diverse range of ideas. Feedback I will be looking at each of your charts/diagrams and will provide feedback via the forum while the e-tivity is in progress as required.