What Kind of Shopper are You?
•
13 likes•19,654 views

Y&R's BAV Shopper analyzes how shoppers approach specific brands, offers a variety of actionable, data-based shopper insights to clients, and can help manufacturers and retail brands better understand their target shoppers, as well as how they stack up against competitors. BAV Shopper is the latest research study from BAVLab, the creators of Y&R’s BrandAsset® Valuator – the world’s largest database and model on brands, and was fielded in conjunction with Labstore, Y&R’s shopper and retail marketing network. BAV Shopper adds a new lens to BAV’s existing data, quizzing shoppers on their attitudes and behaviors, and linking the responses to the primary study in the first BAV Shopper For more information email info@bavlab.com

Recommended
More Related Content
Viewers also liked
Viewers also liked (11)
More from Young & Rubicam
More from Young & Rubicam (16)
Recently uploaded
Recently uploaded (20)
What Kind of Shopper are You?
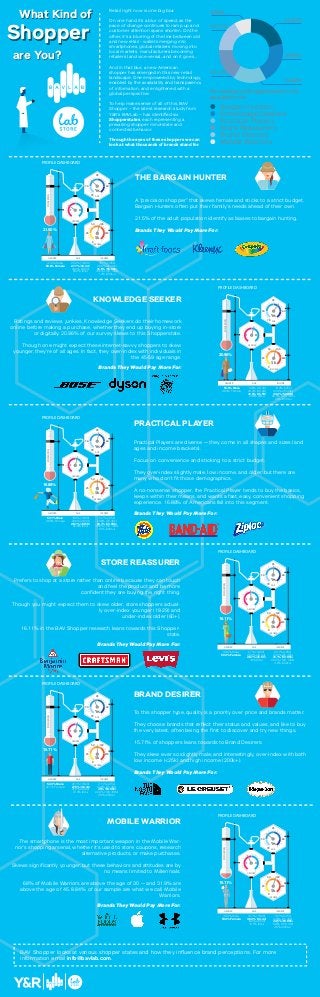
- 1. Retail right now is one big blur. On one hand it’s a blur of speed, as the pace of change continues to ramp up and customer attention spans shorten. On the other, it's a blurring of the line between old and new retail - wallets merging into smartphones, global retailers moving into local markets, manufacturers becoming retailers (and vice-versa)...and on it goes... And in that blur, a new American shopper has emerged in this new retail landscape. One empowered by technology, enabled by the availability and transparency of information, and enlightened with a global perspective. To help make sense of all of this, BAV Shopper – the latest research study from Y&R’s BAVLab – has identified six Shopperstates, each representing a prevailing shopper mind-state and connected behavior. Through the eyes of these shoppers we can look at what thousands of brands stand for. What Kind of are You? Shopper Bargain Hunters Knowledge Seekers Practical Players Store Reassurers Brand Desirers Mobile Warriors 21.50% 8.84% 20.96% 15.71% 16.11% 16.88% Percentage of Shopperstates in US population 18+ PROFILE DASHBOARD 53.6% Male 46.4% Female 19.6% (18-29) 24.2% (30-44) 31.6% (45-59) 24.6% (60+) 14.4% (<25k) 23.4% (25-49k) 33.2% (50-99k) 26.5% (100-199k) 2.5% (200k+) F M 18 30 45 60 50 100 20025 0 $k Yrs GENDER GENDER POPULATION INCOME INCOME AGE AGE 20.96% PROFILE DASHBOARD 49.6% Male 50.4% Female 27% (18-29) 28.3% (30-44) 28.7% (45-60) 16% (60+) 22.1% (<25k) 23.5% (25-49k) 31.1% (50-99k) 20.2% (100-199k) 3.2% (200k+) F M 18 30 45 60 50 100 20025 0 $k Yrs GENDER GENDER POPULATION INCOME INCOME AGE AGE 16.11% KNOWLEDGE SEEKER Ratings and reviews junkies, Knowledge Seekers do their homework online before making a purchase, whether they end up buying in-store or digitally. 20.96% of our survey skews to this Shopperstate. Though one might expect these internet-savvy shoppers to skew younger, they’re of all ages. In fact, they over-index with individuals in the 45-59 age range. STORE REASSURER Prefers to shop at a store rather than online because they can touch and feel the product and be more confident they are buying the right thing. Though you might expect them to skew older, store shoppers actual- ly over-index younger (18-29) and under-index older (60+). 16.11% in the BAV Shopper research leans towards this Shopper- state. PROFILE DASHBOARD 46.6% Male 53.4% Female 31.7% (18-29) 36.3% (30-44) 19.4% (45-59) 12.5% (60+) 19.7% (<25k) 23.6% (25-49k) 33.5% (50-99k) 19.6% (100-199) 3.6% (200k+) F M 18 30 45 60 50 100 20025 0 $k Yrs GENDER GENDER POPULATION INCOME INCOME AGE AGE 15.71% MOBILE WARRIOR The smartphone is the most important weapon in the Mobile War- rior’s shopping arsenal, whether it’s used to store coupons, research alternative products, or make purchases. Skews significantly younger, but these behaviors and attitudes are by no means limited to Millennials. 68% of Mobile Warriors are above the age of 30 — and 31.9% are above the age of 45. 8.84% of our sample are what we call Mobile Warriors. PROFILE DASHBOARD 37.2% Male 62.8% Female 20.2% (18-29) 27.7% (30-44) 26.2% (45-59) 25.9% (60+) 18.7% (<25k) 26.8% (25-49k) 31.5% (50-99k) 21.6% (100-199k) 1.3% (200k+) F M 18 30 45 60 50 100 20025 0 $k Yrs GENDER GENDER POPULATION INCOME INCOME AGE AGE 21.50% THE BARGAIN HUNTER A "precision shopper" that skews female and sticks to a strict budget. Bargain Hunters often put their family's needs ahead of their own. 21.5% of the adult population identify as biases to bargain hunting. Brands They Would Pay More For: Brands They Would Pay More For: Brands They Would Pay More For: Brands They Would Pay More For: PROFILE DASHBOARD 52.3% Male 47.7% Female 25.1% (18-29) 27.5% (30-44) 25.5% (45-60) 21.9% (60+) 21.1% (<25k) 22.6% (25-49k) 30% (50-99k) 22.4% (100-199k) 3.9% (200k+) F M 18 30 45 60 50 100 20025 0 $k Yrs GENDER GENDER POPULATION INCOME INCOME AGE AGE 15.71% BRAND DESIRER To this shopper type, quality is a priority over price and brands matter. They choose brands that reflect their status and values, and like to buy the very latest, often being the first to discover and try new things. 15.71% of shoppers leans towards to Brand Desirers. They skew ever so slightly male; and interestingly, over-index with both low income (<25k) and high income (200k+). PROFILE DASHBOARD 53.1% Male 46.9% Female 18.4% (18-29) 26.6% (30-44) 28.1% (45-59) 26.8% (60+) 24.7% (<25k) 24.8% (25-49k) 29.7% (50-99k) 18.8% (100-199k) 1.9% (200k+) F M 18 30 45 60 50 100 20025 0 $k Yrs GENDER GENDER POPULATION INCOME INCOME AGE AGE 16.88% PRACTICAL PLAYER Practical Players are diverse — they come in all shapes and sizes (and ages and income brackets). Focus on convenience and sticking to a strict budget. They over-index slightly male, low income, and older, but there are many who don’t fit those demographics. A no-nonsense shopper, the Practical Player tends to buy the basics, keeps within their means, and wants a fast, easy, convenient shopping experience. 16.88% of Americans fall into this segment. Brands They Would Pay More For: Brands They Would Pay More For: BAV Shopper looks at various shopper states and how they influence brand perceptions. For more information email info@bavlab.com.