1. 3
2
1
Abstract:
Loss, sadness, and isolation – the devastating feelings 35 million Alzheimer’s patients worldwide must wrestle on a daily basis. Alzheimer’s is a
neurodegenerative disease characterized by brain mass loss. Using Cobweb, a better understanding of the mechanisms that underliethis
disease can be achieved, facilitating the creation of new treatments. According to the Amyloid Cascade Hypothesis, amyloid beta is the cause of
this degeneration. Neurons, the cells in our nervous system, produce this transmembrane protein which a series of enzymes, namely beta
secratase, cut and release. It then clumps and wreaks havoc on synapses, the connections between neurons. Normally, these proteins are
swept out of the brain by cerebral spinal fluid (CSF), while in Alzheimer’s, there is a decrease in the efficiency of this cleaning mechanism, which
we have been able to illustrate in Cobweb. As a result, amyloid beta aggregates and interferes in neuronal communication, becoming the
catalyst for the formation of neurofibrillary tangles, which are dead nerve cells. Both of these phenomena are successfully realized in our
model. The combination of plaques and tangles causes brain mass loss, the cause of the manifestation of symptoms.
The Brain on COBWEB
A Hierarchy, Revisited
Alessandro Ricci, Melisa Gumus, Mazen El-Kurdi,
Vernon Li, Victoria Agapova
Supervisor: Dr. Brad Bass
Purpose - To successfully model the progress of Alzheimer’s in the brain using Cobweb.
Hypothesis - We hypothesize that we can monitor the brain of an Alzheimer’s patient from birth to neurodegeneration by illustrating its
components on Cobweb, software originally meant to explore theoretical complex systems.
Legend
- Glucose- A Hippocampal
Neuron
- Cerebral Spinal Fluid
(CSF) and interstitial fluid
- Amyloid Beta (represented
as a product of a neuron)
- Cerebral Spinal Fluid (CSF)
and interstitial fluid
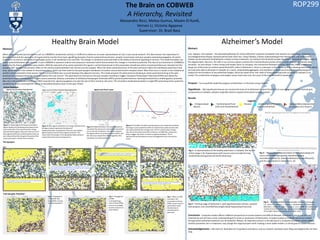
Results
Fig 1 – A representation of the healthy adult brain in Cobweb. The top 4/5
of the image is the hippocampus with neurons and normally forming
amyloid beta being produced and flushed away.
Fig 2 – The final stage of Alzheimer’s, with significant brain cell loss, amyloid
beta plaques, and neurofibrillary tangles (dead hippocampal neurons).
Fig 3 – The graphical representation of the hippocampal cell
count, with initial rapid growth representing early
neurodevelopment (1), relative stabilization in adulthood (2),
and the rapid decline in Alzheimer’s. (3)
Fig 4 – An amyloid beta immunostain. Source : Grathwohl,
S.A., Kälin, R.E., Bolmont, T., Prokop, S., Winkelmann, G., Kaeser, S.A.,
Odenthal, J., Radde, R., Eldh, T., Gandy, S., et al. (2009). Formation and
maintenance of Alzheimer’s disease β-amyloid plaques in the absence
of microglia. Nature Neuroscience 12, 1361–1363.
Conclusion - Computer models afford a different perspective on human systems and difficult diseases. Alzheimer’s, being one of them.
Scientists do not yet have a clear understanding of its onset or mechanism of destruction. A model created on Cobweb can act as a vessel
through which potential treatments can be tested for efficacy. An important concern is the delicacy of a computer simulation, where adding
another parameter, be it a treatment, may change the original project itself. Creating a more stable model is a critical goal for future research.
Fig 1 - Propagation
of one IPSP and
three EPSPs coming
from the dendrites
Fig 2 - Propagation
of IPSP
outcompeting a
sum of three EPSPs
due to its strategic
location close to an
axon hillock
Fig 3 - When no IPSP
is present, the
summation of three
EPSPs causes neuron
potential to reach
threshold and
activate action
potential
Post Synaptic Potential -
Abstract:
When using computerized simulations such as COBWEB to model brain activity, it is difficult to obtain an accurate representationof such a vast neural network. This idea stresses the importance of
deconstruction and the separation of neural activity into the three basic signalling principles of action potential transmission, synaptic transmission and post synaptic potential propagation. An action
potential is an event in which electrical charges across a cell membrane rises and falls. The change in membrane potential leads to the ability of electrical signalling in neurons. This model simulates one
action potential between two neurons. It uses COBWEB to represent sodium and potassium movement which demonstrates the changes in membrane potential. The idea of ion movement in COBWEB is
applied by the theory of predator prey models. With the execution of an action potential, the signal is carried downstream to the presynaptic membrane where neurotransmitters are released into the
synaptic cleft. Synaptic transmission refers to the communication between two neurons via the synapse. When the action potential arrives at the axon terminal it alters the membrane potential in that
area, which results in the release of neurotransmitters, which can then travel to the post synaptic membrane of another neuron and bind to receptors there. After that occurs it results in the initiation of
another action potential in that neuron. Hence communication has occurred between the adjacent neurons. This model presents this phenomenon showing an action potential arriving at the axon
terminal and subsequently being communicated to the next neuron. The opening of ion channels on the post synaptic membrane triggers Excitatory Postsynaptic Potentials (EPSPs) and allows the
potential to reach a threshold that triggers action potential, whereas summation of Inhibitory Postsynaptic Potentials (IPSPs) prevents potential from reaching threshold thus inhibiting action potential.
Not only is the amplitude of IPSPs and EPSPs important for signal propagation, but also the site of their arrival to cell soma. This simulation model demonstrates a single IPSP preventing action potential
activation by three incoming EPSPs due to its beneficial location closer to the axon hillock.
Figure 1: Yellow Agents (Potassium) and Blue
Agents (Sodium) interacting at the peak of the
action potential. This map shows the charge
represented by agents. Because there are more
blue agents (sodium) vs yellow (potassium), we
can interpret that the charge at the peak of the
action potential is mainly due to sodium.
Figure 2: Blue agents (sodium) is no longer dominant and
the figure above represents the phase of
hyperpolarization. As depicted, there are more yellow
agents (potassium) than blue agents (sodium). This
means that the charge in the hyperpolarization phase is
mainly due to the action of potassium.
Figure 4: The effect of sodium and potassium ions inside the cell when
forming an action potential. With an initial stimuli, sodium enters the
cell represented by the orange curve. At first, sodium plays a larger
role, but as the action potential continues, at 1000 ticks, potassium
plays a bigger role when it comes to hyperpolarization. This is
represented by the potassium count being greater than the sodium
count.
0
500
1000
1500
2000
2500
0 200 400 600 800 1000 1200 1400 1600
Agent Count (K+/Na+)
Time (Ticks)
Amount of Sodium and Potassium Ions Inside the Cell Over Time.
Potassium
Sodium
Figure 3: Representation of an action potential
caused by the potassium and sodium movement
across the cell membrane. The red line depicts
the agents which are potassium and sodium and
the red curve shows their effect together, thus
resulting in an action potential.
Action Potential -
The Synapse -
Healthy Brain Model Alzheimer’s Model
Acknowledgements – We thank Dr. Brad Bass for his guidance and advice, and our research assistants Jason Ning and Angelina Pan for their
help.
ROP299
Fig 1 Fig 2 Fig 3 Fig 4