SlideShare ist ein Scribd-Unternehmen logo
1 von 10
Downloaden Sie, um offline zu lesen
News Release
FOR IMMEDIATE RELEASE:
Spring ushers in calmer housing market trends in Metro Vancouver
VANCOUVER, BC – June 2, 2022 – After reaching record-setting levels in 2021, home sale
activity has returned to more typical seasonal levels in Metro Vancouver* this spring due, in
large part, to rising interest rates.
The Real Estate Board of Greater Vancouver (REBGV) reports that residential home sales in the
region totalled 2,918 in May 2022, a 31.6 per cent decrease from the 4,268 sales recorded in May
2021, and a 9.7 per cent decrease from the 3,232 homes sold in April 2022.
Last month’s sales were 12.9 per cent below the 10-year May sales average.
“With interest rates rising, home buyers are taking more time to make their decisions in today’s
housing market,” said Daniel John, REBGV Chair. “Home buyers have been operating in a
frenzied environment for much of the past two years. This spring is providing a calmer
environment, with fewer multiple offer situations, which is allowing buyers to explore their
housing options, understand the changing mortgage market, and do their due diligence.”
There were 6,377 detached, attached and apartment properties newly listed for sale on the
Multiple Listing Service® (MLS®) in Metro Vancouver in May 2022. This represents a 10.5 per
cent decrease compared to the 7,125 homes listed in May 2021 and a 4.4 per cent increase
compared to April 2022 when 6,107 homes were listed.
The total number of homes currently listed for sale on the MLS® system in Metro Vancouver is
10,010, an 8.8 per cent decrease compared to May 2021 (10,970) and a 13.8 per cent increase
compared to April 2022 (8,796).
For all property types, the sales-to-active listings ratio for May 2022 is 29.2 per cent. By
property type, the ratio is 18.3 per cent for detached homes, 35.5 per cent for townhomes, and
38.1 per cent for apartments.
Generally, analysts say downward pressure on home prices occurs when the ratio dips below 12
per cent for a sustained period, while home prices often experience upward pressure when it
surpasses 20 per cent over several months.
The MLS® Home Price Index* (See editor’s note #2) composite benchmark price for all
residential properties in Metro Vancouver is currently $1,261,1001
. This represents a 14.7 per
cent increase over May 2021 and a 0.3 per cent decrease compared to April 2022.
“Upward pressure on home prices has begun to ease in the housing market over the last two
months,” John said. “Where home prices go next will depend on housing supply. While we’re
beginning to see modest increases in home listings, we still need housing supply totals to more
than double to bring the market close to balanced territory.”
Sales of detached homes in May 2022 reached 793, a 44.1 per cent decrease from the 1,419
detached sales recorded in May 2021. The benchmark price for a detached home is $2,093,600.
This represents a 15 per cent increase from May 2021 and a 0.4 per cent decrease compared to
April 2022.
Sales of apartment homes reached 1,605 in May 2022, a 21.7 per cent decrease compared to the
2,049 sales in May 2021. The benchmark price of an apartment home is $779,700. This
represents a 15 per cent increase from May 2021 and a 0.4 per cent increase compared to April
2022.
Attached home sales in May 2022 totalled 520, a 35 per cent decrease compared to the 800 sales
in May 2021. The benchmark price of an attached home is $1,141,200. This represents a 21.5 per
cent increase from May 2021 and a 0.6 per cent decrease compared to April 2022.
*Editor’s Notes:
1.) Areas covered by the Real Estate Board of Greater Vancouver include: Burnaby, Coquitlam, Maple Ridge, New
Westminster, North Vancouver, Pitt Meadows, Port Coquitlam, Port Moody, Richmond, South Delta, Squamish,
Sunshine Coast, Vancouver, West Vancouver, and Whistler.
2.) MLS® Home Price Index 2022 update: The national MLS® Home Price Index (MLS® HPI) methodology was
updated during an annual review of the model in May. In line with best statistical practices, the MLS® HPI is
reviewed each year.
Under the new methodology, benchmark attribute data is derived from data collected from the previous five-year
rolling period. Benchmark prices are also now based on current benchmark attributes instead of linking benchmark
prices to historical benchmark attributes.
In the annual review, coverage was extended to neighbourhoods where sales volumes picked up enough to support
benchmark price tracking and discontinued for neighbourhoods where sales became too sparse to support
benchmark price calculations. Read more about these changes.
Due to new housing development, REBGV also expanded the boundaries of the Brentwood neighbourhood in
Burnaby, which affected the typical home associated with that area, Central Burnaby, and Parkcrest.
To ensure the MLS® HPI coverage is consistent and comparable, the MLS® HPI historical aggregate and
composite data was recalculated based on revised and consistent coverage.
-30-
The real estate industry is a key economic driver in British Columbia. In 2021, 43,999 homes changed ownership in
the Board’s area, generating $2.98 billion in economic spin-off activity and an estimated 20,942 jobs. The total
dollar value of residential sales transacted through the MLS® system in Greater Vancouver totalled $53.4 billion in
2021.
The Real Estate Board of Greater Vancouver is an association representing more than 14,000 REALTORS® and
their companies. The Board provides a variety of member services, including the Multiple Listing Service®. For
more information on real estate, statistics, and buying or selling a home, contact a local REALTOR® or visit
www.rebgv.org.
For more information please contact:
Craig Munn
Director, Communication
Real Estate Board of Greater Vancouver
604.730.3146
cmunn@rebgv.org
Property Type Area
Benchmark
Price
Price
Index
1 Month
Change %
3 Month
Change %
6 Month
Change %
1 Year
Change %
3 Year
Change %
5 Year
Change %
10 Year
Change %
Residential / Composite Lower Mainland $1,226,800 371.8 -0.9% 1.1% 12.4% 18.9% 49.8% 31.2% 103.4%
Greater Vancouver $1,261,100 356.2 -0.3% 1.9% 10.8% 14.7% 40.1% 20.5% 86.9%
Bowen Island $1,673,600 352.9 0.0% 7.9% 19.1% 23.2% 76.9% 86.5% 179.6%
Burnaby East $1,216,300 380.6 -0.3% 1.1% 13.8% 17.4% 35.5% 25.1% 108.3%
Burnaby North $1,079,600 358.8 0.3% 4.2% 12.1% 15.4% 37.9% 25.2% 102.9%
Burnaby South $1,181,600 369.6 -0.4% 3.0% 13.6% 17.9% 36.9% 26.0% 107.2%
Coquitlam $1,200,600 373.7 -1.1% 2.5% 14.1% 20.4% 49.3% 40.0% 126.5%
Ladner $1,233,900 357.7 0.1% 2.4% 15.8% 21.1% 55.0% 47.0% 122.6%
Maple Ridge $1,115,500 384.9 -2.0% -1.6% 14.0% 25.3% 68.9% 75.5% 178.9%
New Westminster $862,400 387.9 -0.5% 1.9% 13.5% 18.1% 39.6% 40.7% 121.8%
North Vancouver $1,475,700 340.0 -0.4% 0.7% 10.4% 15.3% 39.0% 24.2% 102.1%
Pitt Meadows $1,027,800 402.0 -0.5% 0.2% 14.9% 28.4% 64.8% 74.9% 177.6%
Port Coquitlam $1,023,900 394.3 -1.2% 2.5% 16.5% 24.6% 61.3% 60.2% 156.7%
Port Moody $1,225,600 386.3 0.2% 7.1% 17.2% 23.6% 57.1% 50.0% 157.2%
Richmond $1,196,300 391.1 -0.3% 1.6% 10.8% 15.3% 39.4% 17.5% 91.6%
Squamish $1,190,700 391.4 1.3% 3.7% 12.0% 18.2% 56.7% 69.1% 181.2%
Sunshine Coast $954,400 351.5 1.7% 6.4% 19.2% 24.3% 70.5% 84.3% 179.6%
Tsawwassen $1,353,600 352.7 0.7% 3.3% 16.1% 24.7% 46.8% 34.0% 112.0%
Vancouver East $1,249,000 388.2 -0.3% 2.2% 9.6% 12.8% 37.0% 21.5% 98.6%
Vancouver West $1,375,500 322.7 -0.6% 0.5% 5.2% 5.6% 21.3% -4.3% 49.6%
West Vancouver $2,898,100 313.0 2.0% 4.5% 7.4% 6.3% 37.5% 0.6% 61.6%
Whistler $1,551,200 341.7 1.4% 3.2% 11.3% 19.3% 64.1% 84.8% 167.6%
Single Family Detached Lower Mainland $1,919,600 420.3 -1.2% 0.4% 12.3% 19.4% 57.4% 37.6% 119.7%
Greater Vancouver $2,093,600 389.8 -0.4% 1.6% 10.9% 15.0% 45.8% 21.5% 92.2%
Bowen Island $1,674,100 352.8 0.1% 7.9% 19.0% 23.2% 76.9% 86.7% 179.6%
Burnaby East $1,963,700 417.6 -0.7% -1.6% 13.7% 19.2% 46.1% 35.8% 137.0%
Burnaby North $2,117,600 404.6 -0.4% 4.6% 13.7% 16.5% 43.3% 29.3% 116.4%
Burnaby South $2,318,000 430.5 -0.9% 3.5% 14.3% 21.6% 45.7% 25.3% 120.3%
Coquitlam $1,950,800 446.3 -0.6% 3.9% 15.2% 23.1% 61.2% 51.0% 166.6%
Ladner $1,545,700 373.3 -0.1% 0.5% 14.8% 19.5% 61.7% 52.4% 130.6%
Maple Ridge $1,438,500 420.6 -2.1% -1.9% 12.7% 25.1% 74.3% 82.6% 199.1%
New Westminster $1,606,000 401.4 -0.9% -1.5% 12.2% 18.3% 50.1% 39.6% 133.1%
North Vancouver $2,368,600 369.5 -1.0% -0.9% 10.4% 14.6% 43.9% 29.2% 121.1%
Pitt Meadows $1,454,800 429.8 -1.2% -4.3% 8.9% 28.0% 64.4% 76.8% 197.9%
Port Coquitlam $1,517,700 429.0 -1.4% -0.8% 15.3% 25.8% 70.8% 61.4% 179.7%
Port Moody $2,231,100 422.5 0.6% 8.3% 18.1% 23.5% 58.5% 53.4% 173.3%
Richmond $2,178,300 444.6 -0.9% 0.9% 9.3% 13.2% 38.2% 20.1% 103.5%
Squamish $1,812,700 449.5 2.6% 5.5% 12.7% 15.9% 66.1% 78.6% 232.0%
Sunshine Coast $1,045,400 364.5 1.7% 6.9% 20.7% 24.7% 75.7% 91.4% 185.9%
Tsawwassen $1,734,000 384.1 0.2% 2.3% 15.5% 25.2% 57.9% 44.8% 133.1%
Vancouver East $1,947,000 435.7 0.3% 2.7% 11.4% 14.1% 44.8% 27.9% 125.4%
Vancouver West $3,490,600 364.2 -1.2% 0.4% 4.1% 3.6% 23.1% -3.2% 56.5%
West Vancouver $3,475,600 323.3 2.6% 4.4% 7.3% 6.7% 35.1% 2.3% 67.0%
Whistler $2,808,600 379.3 2.1% 4.2% 13.5% 20.4% 72.3% 77.8% 180.5%
HOW TO READ THE TABLE:
• Benchmark Price: Estimated sale price of a benchmark property. Benchmarks represent a typical property within each market.
• Price Index: Index numbers estimate the percentage change in price on typical and constant quality properties over time. All figures are based on past sales.
• x Month/Year Change %: Percentage change of index over a period of x month(s)/year(s) *
In January 2005, the indexes are set to 100.
Townhome properties are similar to Attached properties, a category that was used in the previous MLSLink HPI, but do not included duplexes.
The above info is deemed reliable, but is not guaranteed. All dollar amounts in CDN.
May 2022
*
* MLS®, Multiple Listing Service®, and all related graphics are trademarks of The Canadian Real Estate Association 1 of 19
Property Type Area
Benchmark
Price
Price
Index
1 Month
Change %
3 Month
Change %
6 Month
Change %
1 Year
Change %
3 Year
Change %
5 Year
Change %
10 Year
Change %
May 2022
*
Townhouse Lower Mainland $1,031,400 390.2 -0.9% 2.6% 16.2% 25.9% 52.8% 61.0% 144.8%
Greater Vancouver $1,141,200 393.1 -0.6% 3.0% 14.0% 21.5% 44.6% 50.8% 136.4%
Burnaby East $897,800 378.0 1.2% 2.0% 15.8% 17.0% 34.9% 42.9% 124.7%
Burnaby North $982,200 398.8 3.1% 11.6% 21.1% 25.9% 41.7% 53.9% 139.8%
Burnaby South $1,065,300 395.9 1.3% 6.0% 17.7% 22.5% 38.3% 45.9% 134.4%
Coquitlam $1,121,400 434.3 -2.4% 2.2% 17.0% 25.5% 51.9% 65.5% 182.6%
Ladner $1,007,000 386.7 -1.8% -0.1% 14.5% 19.6% 41.3% 45.0% 134.1%
Maple Ridge $859,400 426.9 -2.7% -2.2% 19.5% 27.2% 60.5% 89.1% 206.9%
New Westminster $960,400 408.9 0.9% 4.1% 18.0% 23.2% 49.7% 54.2% 140.2%
North Vancouver $1,399,000 380.0 0.9% 5.1% 12.8% 25.5% 51.8% 51.8% 138.2%
Pitt Meadows $922,900 447.1 0.2% 5.1% 22.0% 24.9% 63.3% 78.8% 195.1%
Port Coquitlam $1,019,000 408.1 -1.2% 6.5% 20.0% 26.7% 58.7% 70.9% 176.5%
Port Moody $1,138,500 432.2 0.1% 8.1% 19.8% 28.3% 59.5% 75.1% 190.7%
Richmond $1,127,800 404.5 0.0% 4.1% 15.2% 22.3% 41.5% 43.8% 128.0%
Squamish $1,080,700 389.6 -1.2% -0.3% 9.5% 17.8% 51.5% 78.7% 208.0%
Sunshine Coast $774,700 351.3 -1.8% -1.0% 8.5% 18.0% 55.6% 75.6% 183.3%
Tsawwassen $1,028,500 322.7 -0.9% 1.2% 15.7% 19.1% 23.8% 21.0% 91.7%
Vancouver East $1,145,700 375.1 -0.7% 3.7% 7.4% 15.3% 31.1% 33.8% 109.8%
Vancouver West $1,530,200 342.2 -1.2% -0.1% 5.6% 11.5% 27.4% 21.4% 93.7%
Whistler $1,543,300 393.4 -1.4% 0.7% 11.6% 21.7% 59.2% 99.4% 221.9%
Apartment Lower Mainland $731,700 362.6 0.1% 3.1% 13.3% 17.7% 32.6% 38.0% 114.3%
Greater Vancouver $779,700 356.2 0.4% 3.3% 12.0% 15.0% 28.0% 33.7% 110.6%
Burnaby East $838,800 352.3 -0.5% 4.6% 14.0% 19.0% 25.5% 34.2% 101.5%
Burnaby North $750,800 379.0 0.8% 3.8% 12.9% 18.1% 33.3% 48.1% 123.9%
Burnaby South $809,200 385.1 0.1% 3.0% 13.4% 15.3% 26.7% 40.0% 128.3%
Coquitlam $717,400 406.9 -0.8% 2.5% 14.8% 19.0% 32.7% 53.6% 147.4%
Ladner $746,400 379.7 2.1% 12.9% 19.3% 26.2% 54.7% 66.6% 146.2%
Maple Ridge $574,600 396.8 0.2% 4.8% 19.2% 27.7% 51.5% 98.7% 182.8%
New Westminster $670,400 401.9 -0.3% 4.0% 13.9% 18.0% 28.5% 49.4% 136.1%
North Vancouver $841,600 336.1 1.4% 3.8% 13.4% 16.9% 30.0% 34.7% 117.1%
Pitt Meadows $649,500 438.0 -0.5% 3.5% 17.6% 24.9% 44.9% 85.9% 194.6%
Port Coquitlam $653,700 444.4 -0.9% 5.4% 16.9% 20.3% 43.2% 69.4% 176.5%
Port Moody $757,600 403.8 0.3% 4.1% 12.5% 17.5% 37.3% 55.2% 152.1%
Richmond $739,000 399.2 0.9% 2.3% 12.1% 17.3% 32.4% 42.1% 123.4%
Squamish $646,600 383.5 2.4% 6.9% 14.9% 26.9% 50.6% 75.5% 212.6%
Sunshine Coast $625,200 358.3 3.0% 7.1% 13.5% 23.9% 40.3% 50.4% 175.0%
Tsawwassen $778,200 363.3 3.3% 12.4% 18.1% 26.4% 39.2% 47.9% 130.5%
Vancouver East $725,500 415.5 -0.5% 1.5% 8.5% 9.3% 21.0% 29.2% 118.3%
Vancouver West $884,900 334.1 0.6% 2.9% 9.4% 10.1% 19.9% 18.7% 97.2%
West Vancouver $1,267,100 247.4 -4.2% 4.6% 10.5% 7.3% 20.4% 15.2% 71.6%
Whistler $738,900 318.5 5.2% 7.7% 16.0% 29.9% 58.9% 91.3% 190.3%
HOW TO READ THE TABLE:
• Benchmark Price: Estimated sale price of a benchmark property. Benchmarks represent a typical property within each market.
• Price Index: Index numbers estimate the percentage change in price on typical and constant quality properties over time. All figures are based on past sales.
• x Month/Year Change %: Percentage change of index over a period of x month(s)/year(s)
In January 2005, the indexes are set to 100. *
Townhome properties are similar to attached properties, a category that was used in the previous MLSLink HPI, but do not included duplexes.
Lower Mainland includes areas serviced by both Real Estate Board of Greater Vancouver & Fraser Valley Real Estate Board.
The above info is deemed reliable, but is not guaranteed. All dollar amounts in CDN.
* MLS®, Multiple Listing Service®, and all related graphics are trademarks of The Canadian Real Estate Association 2 of 19
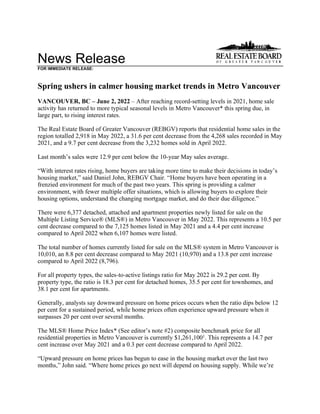
C:DATAMonthEndHpiexporthi_resgv-hpi2.tif
Greater
Vancouver
5
Year
Trend
60
110
160
210
260
310
360
410
460
May 2017
Jul 2017
Sep 2017
Nov 2017
Jan 2018
Mar 2018
May 2018
Jul 2018
Sep 2018
Nov 2018
Jan 2019
Mar 2019
May 2019
Jul 2019
Sep 2019
Nov 2019
Jan 2020
Mar 2020
May 2020
Jul 2020
Sep 2020
Nov 2020
Jan 2021
Mar 2021
May 2021
Jul 2021
Sep 2021
Nov 2021
Jan 2022
Mar 2022
May 2022
Price
Index
Residential
Detached
Townhouse
Apartment
Jan
2005
HPI
=
100
5
29
2022
MLS
®
SALES
Facts
B
u
r
n
a
b
y
C
o
q
u
it
la
m
D
e
lt
a
-
S
o
u
th
Is
la
n
d
s
-
G
u
lf
M
a
p
le
R
id
g
e
/P
it
t
M
e
a
d
o
w
s
N
e
w
W
e
s
tm
in
s
t
e
r
N
o
r
th
V
a
n
c
o
u
v
e
r
P
o
r
t
C
o
q
u
it
la
m
P
o
r
t
M
o
o
d
y
/B
e
lc
a
r
r
a
R
ic
h
m
o
n
d
S
q
u
a
m
is
h
S
u
n
s
h
in
e
C
o
a
s
t
V
a
n
c
o
u
v
e
r
E
a
s
t
V
a
n
c
o
u
v
e
r
W
e
s
t
W
e
s
t
V
a
n
c
o
u
v
e
r
/H
o
w
e
S
o
u
n
d
W
h
is
tl
e
r
/P
e
m
b
e
r
to
n
Detached
67
67
39
4
92
20
81
27
12
77
19
55
94
84
46
9
793
Attached
54
51
18
0
57
14
43
21
16
67
17
14
53
67
5
23
520
Apartment
246
125
15
0
49
82
154
43
29
194
13
6
171
430
18
30
1,605
Detached
$2,130,500
$1,786,400
$1,600,000
n/a
$1,365,000
$1,482,500
$2,150,000
$1,475,000
n/a
$2,135,000
n/a
$999,000
$1,940,000
$3,544,000
$3,322,500
n/a
Attached
$1,130,000
$1,049,800
n/a
n/a
$805,000
n/a
$1,352,500
$999,900
n/a
$1,070,000
n/a
n/a
$1,327,500
$1,550,000
n/a
$1,097,500
n/a
Apartment
$695,000
$707,000
n/a
n/a
$561,000
$630,000
$806,667
$570,000
$806,000
$704,900
n/a
n/a
$669,000
$830,000
n/a
$694,000
Detached
85
88
36
10
103
24
96
36
16
96
24
72
110
93
54
19
962
Attached
61
42
13
0
63
7
54
33
23
96
19
10
65
60
4
28
578
Apartment
242
149
31
0
44
102
125
48
26
233
9
3
178
465
13
24
1,692
Detached
$2,207,000
$1,840,000
$1,692,500
n/a
$1,404,500
$1,701,500
$2,260,500
$1,500,000
n/a
$1,960,000
$1,770,000
$1,125,000
$2,065,000
$3,768,000
$3,205,000
n/a
Attached
$1,103,000
$1,250,000
n/a
n/a
$846,000
n/a
$1,362,500
$1,050,000
$1,126,500
$1,165,000
n/a
n/a
$1,350,000
$1,614,950
n/a
$1,244,000
n/a
Apartment
$740,000
$707,900
$675,000
n/a
$553,000
$630,000
$781,028
$582,500
$779,000
$675,000
n/a
n/a
$680,000
$887,500
n/a
$799,500
Detached
115
155
71
10
178
45
128
51
27
134
31
85
190
117
60
22
1,419
Attached
110
65
31
0
86
18
58
39
27
120
29
12
59
106
8
32
800
Apartment
296
130
42
0
73
129
171
72
46
248
30
18
222
513
21
38
2,049
Detached
$1,784,000
$1,499,500
$1,380,000
n/a
$1,200,000
$1,308,000
$1,877,000
$1,295,500
$1,700,000
$1,734,000
$1,384,000
$900,000
$1,770,000
$3,580,000
$3,125,000
$2,272,500
Attached
$905,750
$958,000
$780,000
n/a
$699,000
n/a
$1,195,000
$790,000
$950,000
$930,444
$914,950
n/a
$1,100,000
$1,479,450
n/a
$1,167,750
n/a
Apartment
$635,000
$606,500
$552,500
n/a
$457,000
$519,000
$670,000
$495,000
$628,000
$605,500
$572,450
n/a
$631,750
$775,000
$900,000
$584,500
Detached
390
403
245
28
535
123
411
185
102
530
103
283
560
468
252
60
4,678
Attached
306
217
70
2
301
71
228
117
103
407
101
55
305
324
29
113
2,749
Apartment
1,358
734
123
2
293
509
660
232
163
1,118
82
32
921
2,313
70
166
8,776
Detached
$2,168,000
$1,866,734
$1,670,000
$798,000
$1,497,000
$1,640,000
$2,252,000
$1,555,000
$2,100,000
$2,102,500
$1,601,000
$1,050,000
$2,080,000
$3,600,000
$3,115,000
$3,137,750
Attached
$1,080,000
$1,188,800
$998,500
n/a
$880,000
$1,028,000
$1,399,000
$1,015,000
$1,100,000
$1,160,444
$1,060,000
$635,000
$1,388,000
$1,617,500
$2,376,000
$1,555,000
n/a
Apartment
$730,000
$725,000
$650,000
n/a
$575,000
$630,000
$810,000
$595,000
$775,000
$682,000
$722,500
$575,000
$684,000
$863,000
$1,087,000
$632,500
Detached
583
642
382
47
917
180
619
290
134
756
160
384
901
558
345
112
7,010
Attached
512
337
130
3
444
102
358
149
131
661
119
63
384
424
44
140
4,001
Apartment
1,550
716
202
0
366
614
814
299
228
1,235
133
72
1,061
2,378
105
216
9,989
Detached
$1,760,000
$1,550,000
$1,328,000
$807,500
$1,150,250
$1,322,500
$1,915,000
$1,258,888
$1,700,000
$1,750,000
$1,411,000
$859,500
$1,766,500
$3,405,000
$3,100,000
$2,167,500
Attached
$901,250
$964,900
$837,000
n/a
$665,000
$800,450
$1,200,500
$782,000
$900,000
$928,888
$884,000
$513,900
$1,200,000
$1,450,000
$1,825,500
$1,079,000
n/a
Apartment
$625,944
$575,000
$579,000
n/a
$443,750
$543,000
$696,500
$492,910
$637,000
$589,900
$560,555
$479,000
$625,000
$770,000
$998,500
$589,250
Note:
Median
Selling
Prices
are
not
reported
for
areas
with
less
than
20
sales
or
for
the
Gulf
Islands
Median
Selling
Price
Number
of
Sales
Median
Selling
Price
April
2022
May
2021
Jan.
-
May.
2022
Jan.
-
May.
2021
Median
Selling
Price
Number
of
Sales
Median
Selling
Price
Number
of
Sales
May
2022
Number
of
Sales
Median
Selling
Price
Number
of
Sales
May
2022
Year-to-date
Year-to-date
5
29
2022
MLS
®
LISTINGS
Facts
B
u
r
n
a
b
y
C
o
q
u
it
la
m
D
e
lt
a
-
S
o
u
th
Is
la
n
d
s
-
G
u
lf
M
a
p
le
R
id
g
e
/P
it
t
M
e
a
d
o
w
s
N
e
w
W
e
s
tm
in
s
t
e
r
N
o
r
th
V
a
n
c
o
u
v
e
r
P
o
r
t
C
o
q
u
it
la
m
P
o
r
t
M
o
o
d
y
/B
e
lc
a
r
r
a
R
ic
h
m
o
n
d
S
q
u
a
m
is
h
S
u
n
s
h
in
e
C
o
a
s
t
V
a
n
c
o
u
v
e
r
E
a
s
t
V
a
n
c
o
u
v
e
r
W
e
s
t
W
e
s
t
V
a
n
c
o
u
v
e
r
/H
o
w
e
S
o
u
n
d
W
h
is
tl
e
r
/P
e
m
b
e
r
to
n
Detached
179
160
94
15
297
48
162
88
58
245
61
143
253
253
157
38
2,251
Attached
107
84
39
1
137
40
97
54
38
171
35
11
146
126
14
33
1,133
Apartment
405
217
45
2
94
160
215
68
69
390
23
8
297
890
64
46
2,993
Detached
37%
42%
41%
27%
31%
42%
50%
31%
21%
31%
31%
38%
37%
33%
29%
24%
Attached
50%
61%
46%
0%
42%
35%
44%
39%
42%
39%
49%
127%
36%
53%
36%
70%
n/a
Apartment
61%
58%
33%
0%
52%
51%
72%
63%
42%
50%
57%
75%
58%
48%
28%
65%
Detached
147
176
82
11
274
56
193
85
29
245
40
107
249
284
184
23
2,185
Attached
116
85
30
0
146
14
61
41
33
173
35
12
140
148
9
30
1,073
Apartment
491
222
23
1
81
132
214
62
48
332
22
10
280
839
40
52
2,849
Detached
58%
50%
44%
91%
38%
43%
50%
42%
55%
39%
60%
67%
44%
33%
29%
83%
Attached
53%
49%
43%
n/a
43%
50%
89%
80%
70%
55%
54%
83%
46%
41%
44%
93%
n/a
Apartment
49%
67%
135%
0%
54%
77%
58%
77%
54%
70%
41%
30%
64%
55%
33%
46%
Detached
221
231
113
16
256
62
248
100
43
257
43
116
349
340
192
35
2,622
Attached
165
101
41
1
98
41
73
51
43
164
43
18
127
177
24
54
1,221
Apartment
464
236
37
1
86
167
271
95
63
408
27
16
370
960
43
38
3,282
Detached
52%
67%
63%
63%
70%
73%
52%
51%
63%
52%
72%
73%
54%
34%
31%
63%
Attached
67%
64%
76%
0%
88%
44%
79%
76%
63%
73%
67%
67%
46%
60%
33%
59%
n/a
Apartment
64%
55%
114%
0%
85%
77%
63%
76%
73%
61%
111%
113%
60%
53%
49%
100%
Detached
761
780
455
51
1,218
242
763
368
189
1,192
207
494
1,166
1,200
764
123
9,973
Attached
499
360
125
4
579
121
343
175
163
760
158
68
602
651
53
162
4,823
Apartment
2,119
1,113
162
3
417
728
984
318
262
1,730
118
43
1,444
4,146
183
232
14,002
Detached
51%
52%
54%
55%
44%
51%
54%
50%
54%
44%
50%
57%
48%
39%
33%
49%
Attached
61%
60%
56%
50%
52%
59%
66%
67%
63%
54%
64%
81%
51%
50%
55%
70%
n/a
Apartment
64%
66%
76%
67%
70%
70%
67%
73%
62%
65%
69%
74%
64%
56%
38%
72%
Detached
1,130
1,078
579
51
1,251
298
1,002
479
216
1,344
237
535
1,682
1,347
889
134
12,252
Attached
728
455
182
5
505
144
488
201
181
867
167
62
607
771
94
181
5,638
Apartment
2,141
968
237
1
426
881
1,223
455
285
1,857
150
85
1,631
4,216
197
235
14,988
Detached
52%
60%
66%
92%
73%
60%
62%
61%
62%
56%
68%
72%
54%
41%
39%
84%
Attached
70%
74%
71%
60%
88%
71%
73%
74%
72%
76%
71%
102%
63%
55%
47%
77%
n/a
Apartment
72%
74%
85%
0%
86%
70%
67%
66%
80%
67%
89%
85%
65%
56%
53%
92%
*
Year-to-date
listings
represent
a
cumulative
total
of
listings
rather
than
total
active
listings.
Number
of
Listings
May
2022
Number
of
Listings
%
Sales
to
Listings
Number
of
Listings
%
Sales
to
Listings
Number
of
Listings
%
Sales
to
Listings
April
2022
May
2021
Jan.
-
May.
2022
Jan.
-
May.
2021
%
Sales
to
Listings
Number
of
Listings
%
Sales
to
Listings
May
2022
Year-to-date*
Year-to-date*
Listing & Sales Activity Summary
Listings Sales
1 2 3 Col. 2 & 3 5 6 7 Col. 6 & 7 9 10 Col. 9 & 10
May Apr May Percentage May Apr May Percentage Mar 2021 - Mar 2022 - Percentage
2021 2022 2022 Variance 2021 2022 2022 Variance May 2021 May 2022 Variance
BURNABY % % %
DETACHED 221 147 179 21.8 115 85 67 -21.2 430 243 -43.5
ATTACHED 165 116 107 -7.8 110 61 54 -11.5 388 208 -46.4
APARTMENTS 464 491 405 -17.5 296 242 246 1.7 1083 829 -23.5
COQUITLAM
DETACHED 231 176 160 -9.1 155 88 67 -23.9 461 274 -40.6
ATTACHED 101 85 84 -1.2 65 42 51 21.4 230 159 -30.9
APARTMENTS 236 222 217 -2.3 130 149 125 -16.1 472 485 2.8
DELTA
DETACHED 113 82 94 14.6 71 36 39 8.3 253 147 -41.9
ATTACHED 41 30 39 30.0 31 13 18 38.5 97 49 -49.5
APARTMENTS 37 23 45 95.7 42 31 15 -51.6 156 78 -50.0
MAPLE RIDGE/PITT MEADOWS
DETACHED 256 274 297 8.4 178 103 92 -10.7 653 348 -46.7
ATTACHED 98 146 137 -6.2 86 63 57 -9.5 287 195 -32.1
APARTMENTS 86 81 94 16.0 73 44 49 11.4 244 180 -26.2
NORTH VANCOUVER
DETACHED 248 193 162 -16.1 128 96 81 -15.6 486 294 -39.5
ATTACHED 73 61 97 59.0 58 54 43 -20.4 231 161 -30.3
APARTMENTS 271 214 215 0.5 171 125 154 23.2 581 441 -24.1
NEW WESTMINSTER
DETACHED 62 56 48 -14.3 45 24 20 -16.7 129 73 -43.4
ATTACHED 41 14 40 185.7 18 7 14 100.0 67 46 -31.3
APARTMENTS 167 132 160 21.2 129 102 82 -19.6 437 333 -23.8
PORT MOODY/BELCARRA
DETACHED 43 29 58 100.0 27 16 12 -25.0 98 61 -37.8
ATTACHED 43 33 38 15.2 27 23 16 -30.4 97 63 -35.1
APARTMENTS 63 48 69 43.8 46 26 29 11.5 161 105 -34.8
PORT COQUITLAM
DETACHED 100 85 88 3.5 51 36 27 -25.0 206 114 -44.7
ATTACHED 51 41 54 31.7 39 33 21 -36.4 106 85 -19.8
APARTMENTS 95 62 68 9.7 72 48 43 -10.4 218 150 -31.2
RICHMOND
DETACHED 257 245 245 0.0 134 96 77 -19.8 546 321 -41.2
ATTACHED 164 173 171 -1.2 120 96 67 -30.2 482 279 -42.1
APARTMENTS 408 332 390 17.5 248 233 194 -16.7 896 718 -19.9
SUNSHINE COAST
DETACHED 116 107 143 33.6 85 72 55 -23.6 271 198 -26.9
ATTACHED 18 12 11 -8.3 12 10 14 40.0 36 38 5.6
APARTMENTS 16 10 8 -20.0 18 3 6 100.0 51 22 -56.9
SQUAMISH
DETACHED 43 40 61 52.5 31 24 19 -20.8 109 70 -35.8
ATTACHED 43 35 35 0.0 29 19 17 -10.5 86 57 -33.7
APARTMENTS 27 22 23 4.5 30 9 13 44.4 92 45 -51.1
VANCOUVER EAST
DETACHED 349 249 253 1.6 190 110 94 -14.5 655 378 -42.3
ATTACHED 127 140 146 4.3 59 65 53 -18.5 251 202 -19.5
APARTMENTS 370 280 297 6.1 222 178 171 -3.9 779 588 -24.5
VANCOUVER WEST
DETACHED 340 284 253 -10.9 117 93 84 -9.7 402 301 -25.1
ATTACHED 177 148 126 -14.9 106 60 67 11.7 323 202 -37.5
APARTMENTS 960 839 890 6.1 513 465 430 -7.5 1653 1495 -9.6
WHISTLER/PEMBERTON
DETACHED 35 23 38 65.2 22 19 9 -52.6 72 41 -43.1
ATTACHED 54 30 33 10.0 32 28 23 -17.9 98 71 -27.6
APARTMENTS 38 52 46 -11.5 38 24 30 25.0 132 97 -26.5
WEST VANCOUVER/HOWE SOUND
DETACHED 192 184 157 -14.7 60 54 46 -14.8 238 162 -31.9
ATTACHED 24 9 14 55.6 8 4 5 25.0 29 24 -17.2
APARTMENTS 43 40 64 60.0 21 13 18 38.5 80 40 -50.0
GRAND TOTALS
DETACHED 2606 2174 2236 2.9 1409 952 789 -17.1 5009 3025 -39.6
ATTACHED 1220 1073 1132 5.5 800 578 520 -10.0 2808 1839 -34.5
APARTMENTS 3281 2848 2991 5.0 2049 1692 1605 -5.1 7035 5606 -20.3
Residential
Average
Sale
Prices
-
January
1977
to
May
2022
0
500
1000
1500
2000
2500
1
9
7
7
1
9
7
8
1
9
7
9
1
9
8
0
1
9
8
1
1
9
8
2
1
9
8
3
1
9
8
4
1
9
8
5
1
9
8
6
1
9
8
7
1
9
8
8
1
9
8
9
1
9
9
0
1
9
9
1
1
9
9
2
1
9
9
3
1
9
9
4
1
9
9
5
1
9
9
6
1
9
9
7
1
9
9
8
1
9
9
9
2
0
0
0
2
0
0
1
2
0
0
2
2
0
0
3
2
0
0
4
2
0
0
5
2
0
0
6
2
0
0
7
2
0
0
8
2
0
0
9
2
0
1
0
2
0
1
1
2
0
1
2
2
0
1
3
2
0
1
4
2
0
1
5
2
0
1
6
2
0
1
7
2
0
1
8
2
0
1
9
2
0
2
0
2
0
2
1
2
0
2
2
DETACHED
CONDOMINIUM
ATTACHED
APARTMENTS
IN
THOUSANDS
($)
NOTE:
From
1977
-
1984
condominium
averages
were
not
separated
into
attached
&
apartment.
$1,208,068
$814,409
$2,258,779

Weitere ähnliche Inhalte

Ähnlich wie REBGV Statistics Package May 2022

Real Estate Board of Greater Vancouver Statistics Package January 2021
Real Estate Board of Greater Vancouver Statistics Package January 2021 Real Estate Board of Greater Vancouver Statistics Package January 2021
Real Estate Board of Greater Vancouver Statistics Package January 2021 Vicky Aulakh
 
REBGV Statistics Package June 2020
REBGV Statistics Package June 2020REBGV Statistics Package June 2020
REBGV Statistics Package June 2020Vicky Aulakh
 
2021 June - REBGV Statistics Package
2021 June - REBGV Statistics Package2021 June - REBGV Statistics Package
2021 June - REBGV Statistics PackageVicky Aulakh
 
REBGV-Stats-Pkg-April-2022.pdf
REBGV-Stats-Pkg-April-2022.pdfREBGV-Stats-Pkg-April-2022.pdf
REBGV-Stats-Pkg-April-2022.pdfVicky Aulakh
 
REBGV Statistics package July 2020
REBGV Statistics package July 2020REBGV Statistics package July 2020
REBGV Statistics package July 2020Vicky Aulakh
 
Real Estate Board of Greater Vancouver Statistics Package February 2022
Real Estate Board of Greater Vancouver Statistics Package February 2022Real Estate Board of Greater Vancouver Statistics Package February 2022
Real Estate Board of Greater Vancouver Statistics Package February 2022Vicky Aulakh
 
Rebgv Stats Package September 2020
Rebgv Stats Package September 2020Rebgv Stats Package September 2020
Rebgv Stats Package September 2020Vicky Aulakh
 
Real Estate Board of Greater Vancouver Statistics Package November 2020
Real Estate Board of Greater Vancouver Statistics Package November 2020Real Estate Board of Greater Vancouver Statistics Package November 2020
Real Estate Board of Greater Vancouver Statistics Package November 2020Vicky Aulakh
 
REBGV Statistics Package October 2020
REBGV Statistics Package October 2020REBGV Statistics Package October 2020
REBGV Statistics Package October 2020Vicky Aulakh
 
Real Estate Board of Greater Vancouver Statistics Package - November 2021
Real Estate Board of Greater Vancouver Statistics Package - November 2021Real Estate Board of Greater Vancouver Statistics Package - November 2021
Real Estate Board of Greater Vancouver Statistics Package - November 2021VickyAulakh1
 
September 2015 rebgv statistics package mike stewart
September 2015 rebgv statistics package mike stewartSeptember 2015 rebgv statistics package mike stewart
September 2015 rebgv statistics package mike stewartMike Stewart
 
Real Estate Board of Greater Vancouver Statistics Package March 2021
Real Estate Board of Greater Vancouver Statistics Package March 2021Real Estate Board of Greater Vancouver Statistics Package March 2021
Real Estate Board of Greater Vancouver Statistics Package March 2021Vicky Aulakh
 
May-2019 Stats Package for Greater Vancouver
May-2019 Stats Package for Greater VancouverMay-2019 Stats Package for Greater Vancouver
May-2019 Stats Package for Greater VancouverBC PRIME Realty
 
Rebgv stats-pkg-may-2019
Rebgv stats-pkg-may-2019Rebgv stats-pkg-may-2019
Rebgv stats-pkg-may-2019Kathryn Huang
 
Real Estate Board of Greater Vancouver Statistics Package July 2021
Real Estate Board of Greater Vancouver Statistics Package July 2021Real Estate Board of Greater Vancouver Statistics Package July 2021
Real Estate Board of Greater Vancouver Statistics Package July 2021Vicky Aulakh
 
Real Estate Board of Greater Vancouver - Statistics Package for July 2021
Real Estate Board of Greater Vancouver - Statistics Package for July 2021Real Estate Board of Greater Vancouver - Statistics Package for July 2021
Real Estate Board of Greater Vancouver - Statistics Package for July 2021Alexander Mackenzie, PMP
 
REBGV Statistics Package August 2020
REBGV Statistics Package August 2020REBGV Statistics Package August 2020
REBGV Statistics Package August 2020Vicky Aulakh
 

Ähnlich wie REBGV Statistics Package May 2022 (20)

Real Estate Board of Greater Vancouver Statistics Package January 2021
Real Estate Board of Greater Vancouver Statistics Package January 2021 Real Estate Board of Greater Vancouver Statistics Package January 2021
Real Estate Board of Greater Vancouver Statistics Package January 2021
 
REBGV Statistics Package June 2020
REBGV Statistics Package June 2020REBGV Statistics Package June 2020
REBGV Statistics Package June 2020
 
2021 June - REBGV Statistics Package
2021 June - REBGV Statistics Package2021 June - REBGV Statistics Package
2021 June - REBGV Statistics Package
 
2021 June REBGV Stats Package
2021 June REBGV Stats Package2021 June REBGV Stats Package
2021 June REBGV Stats Package
 
REBGV-Stats-Pkg-April-2022.pdf
REBGV-Stats-Pkg-April-2022.pdfREBGV-Stats-Pkg-April-2022.pdf
REBGV-Stats-Pkg-April-2022.pdf
 
REBGV Statistics package July 2020
REBGV Statistics package July 2020REBGV Statistics package July 2020
REBGV Statistics package July 2020
 
Real Estate Board of Greater Vancouver Statistics Package February 2022
Real Estate Board of Greater Vancouver Statistics Package February 2022Real Estate Board of Greater Vancouver Statistics Package February 2022
Real Estate Board of Greater Vancouver Statistics Package February 2022
 
Rebgv Stats Package September 2020
Rebgv Stats Package September 2020Rebgv Stats Package September 2020
Rebgv Stats Package September 2020
 
Rebgv stats-pkg-november-2020
Rebgv stats-pkg-november-2020Rebgv stats-pkg-november-2020
Rebgv stats-pkg-november-2020
 
Real Estate Board of Greater Vancouver Statistics Package November 2020
Real Estate Board of Greater Vancouver Statistics Package November 2020Real Estate Board of Greater Vancouver Statistics Package November 2020
Real Estate Board of Greater Vancouver Statistics Package November 2020
 
Rebgv stats-pkg-october-2020
Rebgv stats-pkg-october-2020Rebgv stats-pkg-october-2020
Rebgv stats-pkg-october-2020
 
REBGV Statistics Package October 2020
REBGV Statistics Package October 2020REBGV Statistics Package October 2020
REBGV Statistics Package October 2020
 
Real Estate Board of Greater Vancouver Statistics Package - November 2021
Real Estate Board of Greater Vancouver Statistics Package - November 2021Real Estate Board of Greater Vancouver Statistics Package - November 2021
Real Estate Board of Greater Vancouver Statistics Package - November 2021
 
September 2015 rebgv statistics package mike stewart
September 2015 rebgv statistics package mike stewartSeptember 2015 rebgv statistics package mike stewart
September 2015 rebgv statistics package mike stewart
 
Real Estate Board of Greater Vancouver Statistics Package March 2021
Real Estate Board of Greater Vancouver Statistics Package March 2021Real Estate Board of Greater Vancouver Statistics Package March 2021
Real Estate Board of Greater Vancouver Statistics Package March 2021
 
May-2019 Stats Package for Greater Vancouver
May-2019 Stats Package for Greater VancouverMay-2019 Stats Package for Greater Vancouver
May-2019 Stats Package for Greater Vancouver
 
Rebgv stats-pkg-may-2019
Rebgv stats-pkg-may-2019Rebgv stats-pkg-may-2019
Rebgv stats-pkg-may-2019
 
Real Estate Board of Greater Vancouver Statistics Package July 2021
Real Estate Board of Greater Vancouver Statistics Package July 2021Real Estate Board of Greater Vancouver Statistics Package July 2021
Real Estate Board of Greater Vancouver Statistics Package July 2021
 
Real Estate Board of Greater Vancouver - Statistics Package for July 2021
Real Estate Board of Greater Vancouver - Statistics Package for July 2021Real Estate Board of Greater Vancouver - Statistics Package for July 2021
Real Estate Board of Greater Vancouver - Statistics Package for July 2021
 
REBGV Statistics Package August 2020
REBGV Statistics Package August 2020REBGV Statistics Package August 2020
REBGV Statistics Package August 2020
 

Mehr von Vicky Aulakh

Okanagan Statistics May2023.pdf
Okanagan Statistics May2023.pdfOkanagan Statistics May2023.pdf
Okanagan Statistics May2023.pdfVicky Aulakh
 
FVREB May 2023 Statistics Package.pdf
FVREB May 2023 Statistics Package.pdfFVREB May 2023 Statistics Package.pdf
FVREB May 2023 Statistics Package.pdfVicky Aulakh
 
Metro Vancouver Stats.pdf
Metro Vancouver Stats.pdfMetro Vancouver Stats.pdf
Metro Vancouver Stats.pdfVicky Aulakh
 
Okanagan Stats June 2022
Okanagan Stats June 2022Okanagan Stats June 2022
Okanagan Stats June 2022Vicky Aulakh
 
Okanagan Stats May 2022
Okanagan Stats May 2022Okanagan Stats May 2022
Okanagan Stats May 2022Vicky Aulakh
 
VREB June 2022 Stats
VREB June 2022 StatsVREB June 2022 Stats
VREB June 2022 StatsVicky Aulakh
 
FVREB June 2022 Stats
FVREB June 2022 StatsFVREB June 2022 Stats
FVREB June 2022 StatsVicky Aulakh
 
VREB May 2022 Statistics Package.pdf
VREB May 2022 Statistics Package.pdfVREB May 2022 Statistics Package.pdf
VREB May 2022 Statistics Package.pdfVicky Aulakh
 
The Okanagan Real Estate April 2022 Statistics
The Okanagan Real Estate April 2022 StatisticsThe Okanagan Real Estate April 2022 Statistics
The Okanagan Real Estate April 2022 StatisticsVicky Aulakh
 
FVREB April 2022 Stats Package .pdf
FVREB April 2022 Stats Package .pdfFVREB April 2022 Stats Package .pdf
FVREB April 2022 Stats Package .pdfVicky Aulakh
 
VREB April 2022 Stats Package .pdf
VREB April 2022 Stats Package .pdfVREB April 2022 Stats Package .pdf
VREB April 2022 Stats Package .pdfVicky Aulakh
 
March 2022 Okanagan Statistics
March 2022 Okanagan StatisticsMarch 2022 Okanagan Statistics
March 2022 Okanagan StatisticsVicky Aulakh
 
FVREB Statistics Package March 2022
FVREB Statistics Package March 2022FVREB Statistics Package March 2022
FVREB Statistics Package March 2022Vicky Aulakh
 
February 2022 Okanagan Real Estate Board Statistics Package With Charts & Graphs
February 2022 Okanagan Real Estate Board Statistics Package With Charts & GraphsFebruary 2022 Okanagan Real Estate Board Statistics Package With Charts & Graphs
February 2022 Okanagan Real Estate Board Statistics Package With Charts & GraphsVicky Aulakh
 
Victoria Real Estate Board February 2022
Victoria Real Estate Board February 2022Victoria Real Estate Board February 2022
Victoria Real Estate Board February 2022Vicky Aulakh
 

Mehr von Vicky Aulakh (20)

Okanagan Statistics May2023.pdf
Okanagan Statistics May2023.pdfOkanagan Statistics May2023.pdf
Okanagan Statistics May2023.pdf
 
FVREB May 2023 Statistics Package.pdf
FVREB May 2023 Statistics Package.pdfFVREB May 2023 Statistics Package.pdf
FVREB May 2023 Statistics Package.pdf
 
Metro Vancouver Stats.pdf
Metro Vancouver Stats.pdfMetro Vancouver Stats.pdf
Metro Vancouver Stats.pdf
 
FVREB July 2022
FVREB July 2022FVREB July 2022
FVREB July 2022
 
VREB July 2022
VREB July 2022VREB July 2022
VREB July 2022
 
BCRE June 2022
BCRE June 2022BCRE June 2022
BCRE June 2022
 
Okanagan Stats June 2022
Okanagan Stats June 2022Okanagan Stats June 2022
Okanagan Stats June 2022
 
Okanagan Stats May 2022
Okanagan Stats May 2022Okanagan Stats May 2022
Okanagan Stats May 2022
 
VREB June 2022 Stats
VREB June 2022 StatsVREB June 2022 Stats
VREB June 2022 Stats
 
FVREB June 2022 Stats
FVREB June 2022 StatsFVREB June 2022 Stats
FVREB June 2022 Stats
 
FVREB May 2022
FVREB May 2022FVREB May 2022
FVREB May 2022
 
VREB May 2022 Statistics Package.pdf
VREB May 2022 Statistics Package.pdfVREB May 2022 Statistics Package.pdf
VREB May 2022 Statistics Package.pdf
 
The Okanagan Real Estate April 2022 Statistics
The Okanagan Real Estate April 2022 StatisticsThe Okanagan Real Estate April 2022 Statistics
The Okanagan Real Estate April 2022 Statistics
 
FVREB April 2022 Stats Package .pdf
FVREB April 2022 Stats Package .pdfFVREB April 2022 Stats Package .pdf
FVREB April 2022 Stats Package .pdf
 
VREB April 2022 Stats Package .pdf
VREB April 2022 Stats Package .pdfVREB April 2022 Stats Package .pdf
VREB April 2022 Stats Package .pdf
 
BCREA.pdf
BCREA.pdfBCREA.pdf
BCREA.pdf
 
March 2022 Okanagan Statistics
March 2022 Okanagan StatisticsMarch 2022 Okanagan Statistics
March 2022 Okanagan Statistics
 
FVREB Statistics Package March 2022
FVREB Statistics Package March 2022FVREB Statistics Package March 2022
FVREB Statistics Package March 2022
 
February 2022 Okanagan Real Estate Board Statistics Package With Charts & Graphs
February 2022 Okanagan Real Estate Board Statistics Package With Charts & GraphsFebruary 2022 Okanagan Real Estate Board Statistics Package With Charts & Graphs
February 2022 Okanagan Real Estate Board Statistics Package With Charts & Graphs
 
Victoria Real Estate Board February 2022
Victoria Real Estate Board February 2022Victoria Real Estate Board February 2022
Victoria Real Estate Board February 2022
 

Kürzlich hochgeladen

Purva Park Hill Kanakapura Road Bangalore.pdf
Purva Park Hill  Kanakapura Road Bangalore.pdfPurva Park Hill  Kanakapura Road Bangalore.pdf
Purva Park Hill Kanakapura Road Bangalore.pdfashiyadav24
 
LCAR Unit 20 - Appraising Real Estate - 14th Edition Revised
LCAR Unit 20 - Appraising Real Estate - 14th Edition RevisedLCAR Unit 20 - Appraising Real Estate - 14th Edition Revised
LCAR Unit 20 - Appraising Real Estate - 14th Edition RevisedTom Blefko
 
SVN Live 4.15.24 Weekly Property Broadcast
SVN Live 4.15.24 Weekly Property BroadcastSVN Live 4.15.24 Weekly Property Broadcast
SVN Live 4.15.24 Weekly Property BroadcastSVN International Corp.
 
Triaa Housing Lohegaon Pune E-Brochure.pdf
Triaa Housing Lohegaon Pune  E-Brochure.pdfTriaa Housing Lohegaon Pune  E-Brochure.pdf
Triaa Housing Lohegaon Pune E-Brochure.pdfManishSaxena95
 
Goyal Orchid Life East Bangalore.pdf.pdf
Goyal Orchid Life East Bangalore.pdf.pdfGoyal Orchid Life East Bangalore.pdf.pdf
Goyal Orchid Life East Bangalore.pdf.pdfkratirudram
 
Prestige Orchards Plots in Shamshabad, Mamidipalli, Hyderabad pdf.pdf
Prestige Orchards Plots in Shamshabad, Mamidipalli, Hyderabad pdf.pdfPrestige Orchards Plots in Shamshabad, Mamidipalli, Hyderabad pdf.pdf
Prestige Orchards Plots in Shamshabad, Mamidipalli, Hyderabad pdf.pdfAhanundefined
 
Provident Solitaire Park Square Kanakapura Road, Bangalore E- Brochure.pdf
Provident Solitaire Park Square Kanakapura Road, Bangalore E- Brochure.pdfProvident Solitaire Park Square Kanakapura Road, Bangalore E- Brochure.pdf
Provident Solitaire Park Square Kanakapura Road, Bangalore E- Brochure.pdffaheemali990101
 
Listing Turkey Green life Istanbul Eyup Catalog
Listing Turkey Green life Istanbul Eyup CatalogListing Turkey Green life Istanbul Eyup Catalog
Listing Turkey Green life Istanbul Eyup CatalogListing Turkey
 
LCAR RE Practice - The Power of Your Database
LCAR RE Practice - The Power of Your DatabaseLCAR RE Practice - The Power of Your Database
LCAR RE Practice - The Power of Your DatabaseTom Blefko
 
Listing Turkey - Resim Modern Catalog Istanbul
Listing Turkey - Resim Modern Catalog IstanbulListing Turkey - Resim Modern Catalog Istanbul
Listing Turkey - Resim Modern Catalog IstanbulListing Turkey
 
Kolte Patil Mirabilis at Horamavu Road, Bangalore E brochure.pdf
Kolte Patil Mirabilis at Horamavu Road, Bangalore E brochure.pdfKolte Patil Mirabilis at Horamavu Road, Bangalore E brochure.pdf
Kolte Patil Mirabilis at Horamavu Road, Bangalore E brochure.pdfAhanundefined
 
Vilas Javdekar Yashwin Enchante Pune E-Brochure .pdf
Vilas Javdekar Yashwin Enchante Pune  E-Brochure .pdfVilas Javdekar Yashwin Enchante Pune  E-Brochure .pdf
Vilas Javdekar Yashwin Enchante Pune E-Brochure .pdfManishSaxena95
 
Radiance Majestic Valasaravakkam Chennai.pdf
Radiance Majestic Valasaravakkam Chennai.pdfRadiance Majestic Valasaravakkam Chennai.pdf
Radiance Majestic Valasaravakkam Chennai.pdfashiyadav24
 
Sankla East World Hadapsar Pune Brochure.pdf
Sankla East World Hadapsar Pune Brochure.pdfSankla East World Hadapsar Pune Brochure.pdf
Sankla East World Hadapsar Pune Brochure.pdfabbu831446
 
Anandtara Iris Residences Mundhwa Pune Brochure.pdf
Anandtara Iris Residences Mundhwa Pune Brochure.pdfAnandtara Iris Residences Mundhwa Pune Brochure.pdf
Anandtara Iris Residences Mundhwa Pune Brochure.pdfabbu831446
 
What is Affordable Housing? Bristol Civic Society April 2024
What is Affordable Housing? Bristol Civic Society April 2024What is Affordable Housing? Bristol Civic Society April 2024
What is Affordable Housing? Bristol Civic Society April 2024Paul Smith
 
Maha Mauka Squarefeet Brochure |Maha Mauka Squarefeet PDF Brochure|
Maha Mauka Squarefeet Brochure |Maha Mauka Squarefeet PDF Brochure|Maha Mauka Squarefeet Brochure |Maha Mauka Squarefeet PDF Brochure|
Maha Mauka Squarefeet Brochure |Maha Mauka Squarefeet PDF Brochure|AkshayJoshi575980
 
Brigade Neopolis Kokapet, Hyderabad E- Brochure
Brigade Neopolis Kokapet, Hyderabad E- BrochureBrigade Neopolis Kokapet, Hyderabad E- Brochure
Brigade Neopolis Kokapet, Hyderabad E- Brochurefaheemali990101
 
LCAR Unit 19 - Financing the Real Estate Transaction - 14th Edition Revised
LCAR Unit 19 - Financing the Real Estate Transaction - 14th Edition RevisedLCAR Unit 19 - Financing the Real Estate Transaction - 14th Edition Revised
LCAR Unit 19 - Financing the Real Estate Transaction - 14th Edition RevisedTom Blefko
 
Managing Uncertainty: Newman George Leech's Real Estate Finance Strategy
Managing Uncertainty: Newman George Leech's Real Estate Finance StrategyManaging Uncertainty: Newman George Leech's Real Estate Finance Strategy
Managing Uncertainty: Newman George Leech's Real Estate Finance StrategyNewman George Leech
 

Kürzlich hochgeladen (20)

Purva Park Hill Kanakapura Road Bangalore.pdf
Purva Park Hill  Kanakapura Road Bangalore.pdfPurva Park Hill  Kanakapura Road Bangalore.pdf
Purva Park Hill Kanakapura Road Bangalore.pdf
 
LCAR Unit 20 - Appraising Real Estate - 14th Edition Revised
LCAR Unit 20 - Appraising Real Estate - 14th Edition RevisedLCAR Unit 20 - Appraising Real Estate - 14th Edition Revised
LCAR Unit 20 - Appraising Real Estate - 14th Edition Revised
 
SVN Live 4.15.24 Weekly Property Broadcast
SVN Live 4.15.24 Weekly Property BroadcastSVN Live 4.15.24 Weekly Property Broadcast
SVN Live 4.15.24 Weekly Property Broadcast
 
Triaa Housing Lohegaon Pune E-Brochure.pdf
Triaa Housing Lohegaon Pune  E-Brochure.pdfTriaa Housing Lohegaon Pune  E-Brochure.pdf
Triaa Housing Lohegaon Pune E-Brochure.pdf
 
Goyal Orchid Life East Bangalore.pdf.pdf
Goyal Orchid Life East Bangalore.pdf.pdfGoyal Orchid Life East Bangalore.pdf.pdf
Goyal Orchid Life East Bangalore.pdf.pdf
 
Prestige Orchards Plots in Shamshabad, Mamidipalli, Hyderabad pdf.pdf
Prestige Orchards Plots in Shamshabad, Mamidipalli, Hyderabad pdf.pdfPrestige Orchards Plots in Shamshabad, Mamidipalli, Hyderabad pdf.pdf
Prestige Orchards Plots in Shamshabad, Mamidipalli, Hyderabad pdf.pdf
 
Provident Solitaire Park Square Kanakapura Road, Bangalore E- Brochure.pdf
Provident Solitaire Park Square Kanakapura Road, Bangalore E- Brochure.pdfProvident Solitaire Park Square Kanakapura Road, Bangalore E- Brochure.pdf
Provident Solitaire Park Square Kanakapura Road, Bangalore E- Brochure.pdf
 
Listing Turkey Green life Istanbul Eyup Catalog
Listing Turkey Green life Istanbul Eyup CatalogListing Turkey Green life Istanbul Eyup Catalog
Listing Turkey Green life Istanbul Eyup Catalog
 
LCAR RE Practice - The Power of Your Database
LCAR RE Practice - The Power of Your DatabaseLCAR RE Practice - The Power of Your Database
LCAR RE Practice - The Power of Your Database
 
Listing Turkey - Resim Modern Catalog Istanbul
Listing Turkey - Resim Modern Catalog IstanbulListing Turkey - Resim Modern Catalog Istanbul
Listing Turkey - Resim Modern Catalog Istanbul
 
Kolte Patil Mirabilis at Horamavu Road, Bangalore E brochure.pdf
Kolte Patil Mirabilis at Horamavu Road, Bangalore E brochure.pdfKolte Patil Mirabilis at Horamavu Road, Bangalore E brochure.pdf
Kolte Patil Mirabilis at Horamavu Road, Bangalore E brochure.pdf
 
Vilas Javdekar Yashwin Enchante Pune E-Brochure .pdf
Vilas Javdekar Yashwin Enchante Pune  E-Brochure .pdfVilas Javdekar Yashwin Enchante Pune  E-Brochure .pdf
Vilas Javdekar Yashwin Enchante Pune E-Brochure .pdf
 
Radiance Majestic Valasaravakkam Chennai.pdf
Radiance Majestic Valasaravakkam Chennai.pdfRadiance Majestic Valasaravakkam Chennai.pdf
Radiance Majestic Valasaravakkam Chennai.pdf
 
Sankla East World Hadapsar Pune Brochure.pdf
Sankla East World Hadapsar Pune Brochure.pdfSankla East World Hadapsar Pune Brochure.pdf
Sankla East World Hadapsar Pune Brochure.pdf
 
Anandtara Iris Residences Mundhwa Pune Brochure.pdf
Anandtara Iris Residences Mundhwa Pune Brochure.pdfAnandtara Iris Residences Mundhwa Pune Brochure.pdf
Anandtara Iris Residences Mundhwa Pune Brochure.pdf
 
What is Affordable Housing? Bristol Civic Society April 2024
What is Affordable Housing? Bristol Civic Society April 2024What is Affordable Housing? Bristol Civic Society April 2024
What is Affordable Housing? Bristol Civic Society April 2024
 
Maha Mauka Squarefeet Brochure |Maha Mauka Squarefeet PDF Brochure|
Maha Mauka Squarefeet Brochure |Maha Mauka Squarefeet PDF Brochure|Maha Mauka Squarefeet Brochure |Maha Mauka Squarefeet PDF Brochure|
Maha Mauka Squarefeet Brochure |Maha Mauka Squarefeet PDF Brochure|
 
Brigade Neopolis Kokapet, Hyderabad E- Brochure
Brigade Neopolis Kokapet, Hyderabad E- BrochureBrigade Neopolis Kokapet, Hyderabad E- Brochure
Brigade Neopolis Kokapet, Hyderabad E- Brochure
 
LCAR Unit 19 - Financing the Real Estate Transaction - 14th Edition Revised
LCAR Unit 19 - Financing the Real Estate Transaction - 14th Edition RevisedLCAR Unit 19 - Financing the Real Estate Transaction - 14th Edition Revised
LCAR Unit 19 - Financing the Real Estate Transaction - 14th Edition Revised
 
Managing Uncertainty: Newman George Leech's Real Estate Finance Strategy
Managing Uncertainty: Newman George Leech's Real Estate Finance StrategyManaging Uncertainty: Newman George Leech's Real Estate Finance Strategy
Managing Uncertainty: Newman George Leech's Real Estate Finance Strategy
 

REBGV Statistics Package May 2022