
Recommended
Recommended
More Related Content
What's hot
What's hot (20)
Similar to REBGV Statistics Package August 2020
Similar to REBGV Statistics Package August 2020 (20)
More from Vicky Aulakh
More from Vicky Aulakh (20)
Recently uploaded
Recently uploaded (20)
REBGV Statistics Package August 2020
- 1. News Release FOR IMMEDIATE RELEASE: Home sale and listing activity continues to increase in August VANCOUVER, BC – September 2, 2020 – Home buyers and sellers remained active across Metro Vancouver* in August, with home sale and new listing activity outpacing the region’s historical averages. The Real Estate Board of Greater Vancouver (REBGV) reports that residential home sales in the region totalled 3,047 in August 2020, a 36.6 per cent increase from the 2,231 sales recorded in August 2019, and a 2.6 per cent decrease from the 3,128 homes sold in July 2020. Last month’s sales were 19.9 per cent above the 10-year August sales average. “People who put their home buying and selling plans on hold in the spring have been returning to the market throughout the summer,” Colette Gerber, REBGV Chair said. “Like everything else in our lives these days, the uncertainty COVID-19 presents makes it challenging to predict what will happen this fall.” There were 5,813 detached, attached and apartment properties newly listed for sale on the Multiple Listing Service® (MLS®) in Metro Vancouver in August 2020. This represents a 55.1 per cent increase compared to the 3,747 homes listed in August 2019 and a 2.3 per cent decrease compared to July 2020 when 5,948 homes were listed. This was 34.8 per cent above the 10-year August new listings average. The total number of homes currently listed for sale on the MLS® system in Metro Vancouver is 12,803, a 4.4 per cent decrease compared to August 2019 (13,396) and a six per cent increase compared to July 2020 (12,083). For all property types, the sales-to-active listings ratio for August 2020 is 23.8 per cent. By property type, the ratio is 23.7 per cent for detached homes, 30.5 per cent for townhomes, and 21.6 per cent for apartments. Generally, analysts say downward pressure on home prices occurs when the ratio dips below 12 per cent for a sustained period, while home prices often experience upward pressure when it surpasses 20 per cent over several months. “Low interest rates and limited overall supply of homes for sale are creating competition in today’s housing market,” Gerber said. “Your local REALTOR® can help you navigate today’s market and ensure that the latest public health requirements are followed at every step of the process. Above all, safety has to remain our top priority during this pandemic.”
- 2. The MLS® Home Price Index composite benchmark price for all residential properties in Metro Vancouver is currently $1,038,700. This represents a 5.3 per cent increase over August 2019 and a 0.7 per cent increase compared to July 2020. Sales of detached homes in August 2020 reached 1,095, a 55.1 per cent increase from the 706 detached sales recorded in August 2019. The benchmark price of a detached home is $1,491,300. This represents a 6.6 per cent increase from August 2019 and a one per cent increase compared to July 2020. Sales of apartment homes reached 1,332 in August 2020, a 19.4 per cent increase compared to the 1,116 sales in August 2019. The benchmark price of an apartment property is $685,800. This represents a 4.5 per cent increase from August 2019 and a 0.5 per cent increase compared to July 2020. Attached home sales in August 2020 totalled 620, a 51.6 per cent increase compared to the 409 sales in August 2019. The benchmark price of an attached home is $806,400. This represents a 4.4 per cent increase from August 2019 and a 1.1 per cent increase compared to July 2020. -30- *Editor’s Note: Areas covered by the Real Estate Board of Greater Vancouver include: Burnaby, Coquitlam, Maple Ridge, New Westminster, North Vancouver, Pitt Meadows, Port Coquitlam, Port Moody, Richmond, South Delta, Squamish, Sunshine Coast, Vancouver, West Vancouver, and Whistler. The real estate industry is a key economic driver in British Columbia. In 2019, 25,351 homes changed ownership in the Board’s area, generating $1.8 billion in economic spin-off activity and an estimated 12,910 jobs. The total dollar value of residential sales transacted through the MLS® system in Greater Vancouver totalled $25.3 billion in 2019. The Real Estate Board of Greater Vancouver is an association representing more than 14,000 REALTORS® and their companies. The Board provides a variety of member services, including the Multiple Listing Service®. For more information on real estate, statistics, and buying or selling a home, contact a local REALTOR® or visit www.rebgv.org. For more information please contact: Craig Munn Manager, Communication Real Estate Board of Greater Vancouver 604.730.3146 cmunn@rebgv.org
- 3. Property Type Area Benchmark Price Price Index 1 Month Change % 3 Month Change % 6 Month Change % 1 Year Change % 3 Year Change % 5 Year Change % 10 Year Change % Residential / Composite Lower Mainland $976,200 273.5 0.7% 1.3% 2.8% 5.1% 3.9% 52.8% 86.6% Greater Vancouver $1,038,700 272.5 0.7% 1.0% 2.4% 5.3% 0.9% 44.6% 81.9% Bowen Island $1,067,300 231.4 2.4% 11.6% 17.8% 11.8% 13.3% 69.4% 72.6% Burnaby East $981,400 272.2 0.8% 1.0% 3.5% 7.2% -0.5% 41.7% 83.2% Burnaby North $892,500 269.5 0.4% -0.4% 1.4% 3.5% 1.7% 47.3% 82.1% Burnaby South $964,100 272.3 -1.8% -1.1% -0.2% 2.6% -2.1% 44.6% 82.5% Coquitlam $935,900 277.6 -0.1% 0.0% 2.4% 4.9% 3.9% 55.3% 97.2% Ladner $851,100 239.6 0.7% 1.4% 3.9% 6.9% -3.5% 28.7% 62.8% Maple Ridge $786,400 250.4 0.6% 0.9% 4.0% 4.7% 9.6% 69.8% 87.6% New Westminster $667,100 293.5 -0.1% 0.7% 2.6% 4.9% 6.3% 64.9% 94.2% North Vancouver $1,098,600 246.9 0.8% 2.9% 3.6% 7.0% 0.0% 43.0% 77.2% Pitt Meadows $762,500 277.2 0.3% 0.1% 2.5% 3.1% 11.5% 70.6% 97.7% Port Coquitlam $776,500 265.8 0.6% 1.0% 3.1% 6.5% 4.9% 61.4% 88.6% Port Moody $915,700 253.1 -1.4% -1.9% 0.6% 1.2% 3.9% 52.4% 83.9% Richmond $945,000 282.1 1.3% 1.1% 2.6% 5.1% -0.1% 44.3% 76.3% Squamish $782,600 249.0 2.8% 3.6% 0.9% 0.0% 7.9% 61.3% 100.5% Sunshine Coast $644,500 225.8 2.3% 9.1% 15.1% 9.2% 11.9% 69.8% 68.5% Tsawwassen $961,200 249.2 2.0% 3.6% 3.0% 5.1% -3.3% 31.2% 71.7% Vancouver East $1,109,500 329.7 1.6% 1.9% 2.5% 7.9% 0.5% 43.7% 102.8% Vancouver West $1,291,100 269.6 0.9% 0.6% 1.5% 5.6% -4.4% 32.4% 72.6% West Vancouver $2,172,500 239.2 0.4% 1.4% 3.9% 3.7% -16.0% 10.5% 74.1% Whistler $924,300 215.4 4.1% 3.1% 0.1% 0.5% 14.5% 66.2% 79.9% Single Family Detached Lower Mainland $1,285,300 274.1 1.1% 2.7% 4.8% 6.8% -2.1% 39.8% 87.5% Greater Vancouver $1,491,300 275.5 1.0% 2.4% 4.6% 6.6% -6.5% 27.9% 80.7% Bowen Island $1,067,300 231.4 2.3% 11.6% 17.8% 11.8% 13.3% 69.4% 72.6% Burnaby East $1,257,500 281.2 2.1% 1.0% 5.2% 7.9% -4.8% 33.0% 91.0% Burnaby North $1,477,400 285.7 0.0% 0.3% 4.1% 7.4% -7.3% 23.8% 84.4% Burnaby South $1,555,100 297.7 -0.3% 1.7% 5.2% 5.9% -9.5% 27.4% 96.0% Coquitlam $1,229,600 272.9 0.1% 1.2% 4.6% 6.3% -3.9% 38.4% 91.4% Ladner $1,005,200 240.6 0.2% 2.2% 4.9% 9.3% -4.0% 24.9% 67.4% Maple Ridge $857,200 244.2 0.4% 1.0% 4.2% 4.8% 6.6% 65.1% 87.4% New Westminster $1,098,800 274.1 0.9% 0.0% 4.4% 6.3% -6.6% 32.7% 81.6% North Vancouver $1,614,900 254.3 0.9% 4.6% 4.4% 9.5% -5.2% 33.1% 83.3% Pitt Meadows $942,900 265.7 1.1% 2.4% 6.6% 5.8% 7.5% 62.1% 90.3% Port Coquitlam $993,500 264.9 1.4% 2.5% 4.2% 9.4% -0.9% 45.2% 87.7% Port Moody $1,467,500 271.0 1.8% 1.0% 4.0% 3.3% -1.6% 43.1% 91.0% Richmond $1,545,500 299.4 2.4% 1.1% 2.6% 5.9% -11.0% 24.6% 73.4% Squamish $988,900 260.6 -0.6% 3.8% 1.4% -0.7% 3.4% 60.0% 97.9% Sunshine Coast $639,100 223.9 2.2% 9.0% 14.9% 9.3% 11.7% 69.4% 67.0% Tsawwassen $1,138,900 253.8 2.2% 4.7% 3.5% 7.1% -4.0% 29.1% 77.1% Vancouver East $1,502,700 331.0 1.0% 3.8% 5.1% 10.1% -3.1% 26.6% 110.6% Vancouver West $3,084,600 312.0 1.0% 1.4% 4.5% 5.6% -15.7% 11.9% 71.1% West Vancouver $2,671,600 252.2 0.4% 1.9% 5.0% 6.0% -16.2% 10.0% 82.4% Whistler $1,685,100 234.4 -1.3% 1.2% 0.3% 2.7% 6.2% 53.3% 78.9% HOW TO READ THE TABLE: • Benchmark Price: Estimated sale price of a benchmark property. Benchmarks represent a typical property within each market. • Price Index: Index numbers estimate the percentage change in price on typical and constant quality properties over time. All figures are based on past sales. • x Month/Year Change %: Percentage change of index over a period of x month(s)/year(s) * In January 2005, the indexes are set to 100. Townhome properties are similar to Attached properties, a category that was used in the previous MLSLink HPI, but do not included duplexes. The above info is deemed reliable, but is not guaranteed. All dollar amounts in CDN. August 2020* * MLS®, Multiple Listing Service®, and all related graphics are trademarks of The Canadian Real Estate Association 1 of 18
- 4. Property Type Area Benchmark Price Price Index 1 Month Change % 3 Month Change % 6 Month Change % 1 Year Change % 3 Year Change % 5 Year Change % 10 Year Change % August 2020* Townhouse Lower Mainland $697,800 253.1 0.6% 1.6% 3.1% 3.7% 6.5% 60.3% 76.4% Greater Vancouver $806,400 258.7 1.1% 1.7% 2.9% 4.4% 4.0% 52.6% 75.3% Burnaby East $708,200 261.6 3.4% 5.8% 7.4% 9.8% 12.5% 58.5% 78.2% Burnaby North $732,500 273.4 -0.4% 1.8% 0.6% 1.5% 5.0% 52.1% 75.6% Burnaby South $802,400 276.4 0.4% 3.8% 3.6% 4.6% 3.8% 55.1% 77.4% Coquitlam $688,900 252.8 -0.6% 0.2% 2.4% 5.7% 7.5% 57.0% 80.2% Ladner $653,800 234.5 1.2% 0.0% 2.8% 6.0% -5.8% 30.9% 50.9% Maple Ridge $553,400 256.9 1.1% 0.9% 5.6% 5.9% 8.9% 73.5% 88.1% New Westminster $765,000 280.7 0.9% 2.6% 4.5% 8.5% 9.6% 59.1% 83.9% North Vancouver $1,014,900 246.6 1.5% 4.2% 7.1% 5.7% 4.8% 51.8% 74.0% Pitt Meadows $625,600 270.7 0.5% -1.2% 2.0% 4.4% 11.1% 70.1% 95.7% Port Coquitlam $656,400 248.5 0.4% 1.4% 5.7% 4.6% 2.4% 60.3% 75.7% Port Moody $652,500 220.5 0.8% 0.6% 3.6% -0.5% 7.2% 42.7% 59.7% Richmond $806,900 265.0 0.6% 1.7% 3.4% 4.3% 0.9% 46.6% 69.2% Squamish $717,100 235.8 4.9% 5.0% 0.2% 1.6% 15.0% 64.0% 98.2% Tsawwassen $628,000 246.2 -0.3% -1.2% 0.4% 4.5% -6.5% 42.6% 55.2% Vancouver East $903,100 287.2 1.7% -0.2% 0.2% 6.6% -1.0% 50.5% 83.3% Vancouver West $1,162,600 271.8 2.0% 3.3% 2.0% 4.3% -1.9% 45.7% 81.1% Whistler $922,400 222.4 3.8% 1.6% -2.9% -1.6% 15.0% 67.3% 91.1% Apartment Lower Mainland $658,200 282.0 0.3% 0.1% 1.1% 4.2% 10.3% 70.7% 89.9% Greater Vancouver $685,800 274.2 0.5% -0.1% 0.8% 4.5% 6.8% 63.0% 84.9% Burnaby East $721,000 276.6 -1.7% -3.4% -1.7% 2.9% -1.6% 52.1% 76.2% Burnaby North $614,400 262.3 0.6% -1.5% 0.2% 2.1% 8.6% 72.1% 86.0% Burnaby South $656,300 263.5 -2.7% -3.3% -3.0% 1.2% 1.4% 58.9% 80.4% Coquitlam $529,000 290.3 0.0% -1.0% 1.1% 0.9% 10.9% 82.2% 109.5% Ladner $522,800 244.1 1.4% 1.4% 3.0% 1.8% 2.0% 41.9% 62.0% Maple Ridge $362,500 258.8 0.4% 0.5% 1.8% 3.1% 19.4% 78.1% 80.3% New Westminster $528,400 299.4 -0.4% 0.7% 2.2% 4.3% 9.4% 77.9% 97.8% North Vancouver $583,600 238.0 0.2% 1.1% 1.7% 5.0% 5.0% 57.8% 71.2% Pitt Meadows $496,500 292.8 -0.4% -0.7% 0.7% 1.3% 15.1% 79.3% 103.5% Port Coquitlam $462,900 276.8 0.2% -0.2% 1.3% 5.6% 12.3% 84.8% 97.6% Port Moody $634,200 264.3 -4.0% -4.1% -2.0% 1.9% 9.2% 72.7% 96.9% Richmond $658,000 281.7 1.0% 0.8% 2.5% 5.0% 10.6% 72.9% 85.0% Squamish $493,000 243.0 5.6% 2.7% 1.1% -1.6% 12.9% 72.5% 107.7% Tsawwassen $553,100 238.2 2.0% 0.9% 1.9% 0.8% 1.4% 40.9% 59.2% Vancouver East $600,800 337.7 1.8% 0.9% 0.8% 6.1% 4.4% 67.6% 96.9% Vancouver West $799,400 259.4 0.7% -0.2% 0.4% 5.7% 1.5% 47.5% 74.9% West Vancouver $1,001,600 203.5 0.4% -0.4% -1.3% -5.7% -9.8% 28.8% 53.9% Whistler $506,200 198.3 8.1% 5.5% 2.4% 0.5% 19.3% 79.6% 73.3% HOW TO READ THE TABLE: • Benchmark Price: Estimated sale price of a benchmark property. Benchmarks represent a typical property within each market. • Price Index: Index numbers estimate the percentage change in price on typical and constant quality properties over time. All figures are based on past sales. • x Month/Year Change %: Percentage change of index over a period of x month(s)/year(s) In January 2005, the indexes are set to 100. * Townhome properties are similar to attached properties, a category that was used in the previous MLSLink HPI, but do not included duplexes. Lower Mainland includes areas serviced by both Real Estate Board of Greater Vancouver & Fraser Valley Real Estate Board. The above info is deemed reliable, but is not guaranteed. All dollar amounts in CDN. * MLS®, Multiple Listing Service®, and all related graphics are trademarks of The Canadian Real Estate Association 2 of 18
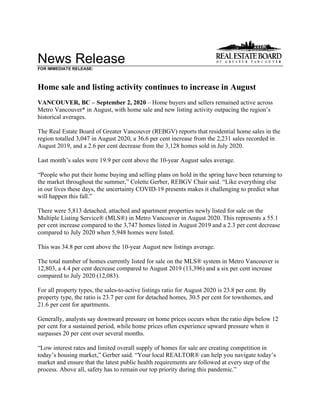
- 5. C:DATAMonthEndHpiexporthi_resgv-hpi2.tifGreaterVancouver 5YearTrend 60 110 160 210 260 310 Aug 2015 Oct 2015 Dec 2015 Feb 2016 Apr 2016 Jun 2016 Aug 2016 Oct 2016 Dec 2016 Feb 2017 Apr 2017 Jun 2017 Aug 2017 Oct 2017 Dec 2017 Feb 2018 Apr 2018 Jun 2018 Aug 2018 Oct 2018 Dec 2018 Feb 2019 Apr 2019 Jun 2019 Aug 2019 Oct 2019 Dec 2019 Feb 2020 Apr 2020 Jun 2020 Aug 2020 Price Index ResidentialDetachedTownhouseApartment Jan2005HPI=100
- 8. Listing & Sales Activity Summary Listings Sales 1 2 3 Col. 2 & 3 5 6 7 Col. 6 & 7 9 10 Col. 9 & 10 Aug Jul Aug Percentage Aug Jul Aug Percentage Jun 2019 - Jun 2020 - Percentage 2019 2020 2020 Variance 2019 2020 2020 Variance Aug 2019 Aug 2020 Variance BURNABY % % % DETACHED 108 172 163 -5.2 62 72 98 36.1 199 231 16.1 ATTACHED 105 117 116 -0.9 64 40 64 60.0 173 135 -22.0 APARTMENTS 298 410 441 7.6 160 173 197 13.9 452 498 10.2 COQUITLAM DETACHED 144 147 147 0.0 78 111 85 -23.4 244 277 13.5 ATTACHED 61 86 88 2.3 39 58 52 -10.3 127 160 26.0 APARTMENTS 137 189 170 -10.1 81 116 106 -8.6 239 307 28.5 DELTA DETACHED 64 125 98 -21.6 32 68 53 -22.1 113 170 50.4 ATTACHED 22 32 41 28.1 12 18 17 -5.6 38 55 44.7 APARTMENTS 52 40 40 0.0 19 23 23 0.0 60 63 5.0 MAPLE RIDGE/PITT MEADOWS DETACHED 130 219 179 -18.3 90 143 142 -0.7 271 396 46.1 ATTACHED 56 102 87 -14.7 44 89 70 -21.3 146 225 54.1 APARTMENTS 51 94 70 -25.5 36 57 41 -28.1 109 133 22.0 NORTH VANCOUVER DETACHED 92 150 159 6.0 64 101 103 2.0 222 288 29.7 ATTACHED 49 90 73 -18.9 32 46 54 17.4 97 144 48.5 APARTMENTS 119 253 256 1.2 88 119 92 -22.7 271 321 18.5 NEW WESTMINSTER DETACHED 30 47 49 4.3 14 28 34 21.4 57 77 35.1 ATTACHED 15 45 46 2.2 8 21 28 33.3 21 60 185.7 APARTMENTS 115 182 186 2.2 75 113 99 -12.4 237 283 19.4 PORT MOODY/BELCARRA DETACHED 29 41 38 -7.3 12 32 23 -28.1 34 74 117.6 ATTACHED 19 40 35 -12.5 11 26 29 11.5 39 69 76.9 APARTMENTS 25 61 44 -27.9 16 36 33 -8.3 64 94 46.9 PORT COQUITLAM DETACHED 36 52 49 -5.8 31 41 39 -4.9 89 108 21.3 ATTACHED 34 36 42 16.7 18 39 24 -38.5 65 90 38.5 APARTMENTS 46 79 75 -5.1 30 39 39 0.0 87 114 31.0 RICHMOND DETACHED 152 179 178 -0.6 67 94 99 5.3 242 268 10.7 ATTACHED 123 137 178 29.9 56 99 95 -4.0 185 256 38.4 APARTMENTS 238 297 312 5.1 127 163 140 -14.1 392 437 11.5 SUNSHINE COAST DETACHED 74 139 101 -27.3 49 101 105 4.0 156 281 80.1 ATTACHED 19 22 15 -31.8 6 10 18 80.0 18 36 100.0 APARTMENTS 15 25 12 -52.0 5 7 11 57.1 16 23 43.8 SQUAMISH DETACHED 29 35 36 2.9 20 25 29 16.0 50 71 42.0 ATTACHED 18 35 26 -25.7 15 25 22 -12.0 38 65 71.1 APARTMENTS 15 42 21 -50.0 5 20 17 -15.0 27 54 100.0 VANCOUVER EAST DETACHED 150 225 266 18.2 73 141 118 -16.3 262 364 38.9 ATTACHED 45 130 118 -9.2 37 46 56 21.7 122 145 18.9 APARTMENTS 161 333 342 2.7 124 156 155 -0.6 339 441 30.1 VANCOUVER WEST DETACHED 126 211 191 -9.5 60 75 91 21.3 199 244 22.6 ATTACHED 66 124 123 -0.8 49 58 56 -3.4 148 162 9.5 APARTMENTS 444 869 877 0.9 314 338 342 1.2 920 961 4.5 WHISTLER/PEMBERTON DETACHED 24 39 39 0.0 12 28 20 -28.6 28 65 132.1 ATTACHED 36 42 38 -9.5 17 27 31 14.8 45 86 91.1 APARTMENTS 33 41 45 9.8 28 31 26 -16.1 58 71 22.4 WEST VANCOUVER/HOWE SOUND DETACHED 107 124 144 16.1 40 54 49 -9.3 113 146 29.2 ATTACHED 14 18 16 -11.1 1 4 4 0.0 9 10 11.1 APARTMENTS 14 49 31 -36.7 8 9 11 22.2 29 37 27.6 GRAND TOTALS DETACHED 1295 1905 1837 -3.6 704 1114 1088 -2.3 2279 3060 34.3 ATTACHED 682 1056 1042 -1.3 409 606 620 2.3 1271 1698 33.6 APARTMENTS 1763 2964 2922 -1.4 1116 1400 1332 -4.9 3300 3837 16.3