
Recommended
More Related Content
Similar to Gender, Age and Marital Status Survey of Myntra Customers
Similar to Gender, Age and Marital Status Survey of Myntra Customers (20)
Recently uploaded
Recently uploaded (20)
Gender, Age and Marital Status Survey of Myntra Customers
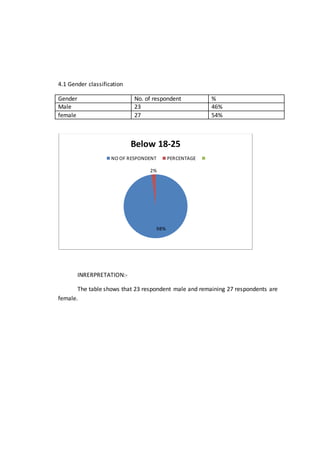
- 1. 4.1 Gender classification Gender No. of respondent % Male 23 46% female 27 54% INRERPRETATION:- The table shows that 23 respondent male and remaining 27 respondents are female. 98% 2% Below 18-25 NO OF RESPONDENT PERCENTAGE
- 2. 4.2 AGE CLASSIFICATION AGE NO.OF RESPONDENT PERCENTAGE BELOW 18-25 44 88% 25-35 6 12% 35-45 0 0% ABOVE 45 0 0% TOTAL 50 100% Interpretation:- The table shows that 44 respondents are below 18-25, 6 respondents are 25-35 and remaining any one not respondent of 35-45 and above 45. 0 5 10 15 20 25 30 35 40 45 50 Below 18- 25 25-35 35-45 Above 45 PERCENTAGE NO OF RESPONDENT
- 3. 4.3 MARRITIAL STATUES STATUES MARRIED UNMARRIED NO OF RESPONDENT 4 46 PERCENTAGE 8% 92% TOTAL 50 100% INTERPRETATION:- The table shows that 4 respondents are married and remaining 46 respondents are unmarried. 8% 92% MARRITIAL STATUES MARRIED UN MARRIED
- 4. 4.4 occupation classification Occupation No respondent percentage Student 44 88% Service 1 2% Self employment 2 4% Others 3 6% total 50 100% INTERPRERTATION:- The tables shows the 44 respondents are student, 1 respondent are service are worked in service, 2 respondents are self employment and remaining 3 respondents are others. 88% 2% 4% 6% OCCUPATION CLASSIFICATION student service selfemloment others
- 5. 4.5 EDUCATION QUALIFICATION EDUCATION QUALIFICATION NO OF RESPONDENT PERCENTAGE SSLC 1 2% PUC 2 4% GRADUATE 12 24% POST GRADUATE 35 70% OTHERS 0 0% TOTAL 50 100% INTERPRETION:- The table shows that respondents education qualification. 1 respondent are SSLC, 2 respondents are PUC, 12 respondents are GRADUATE, and 35 respondents are POST GRADUATE and others. SSLC PUC GRADUA TE POST GRADUA TE OTHERS PERCENTAGE 2% 4% 24% 70% 0% NO OF RESPONDENT 1 2 12 35 0 0 5 10 15 20 25 30 35 40 Axis Title EDUCATION QUALIFICATION CLASSIFICATION
- 6. 4.6 PATTREN OF SHOPPING IN MYNTRA. FREQUENCY NO OF RESPONDENTS PERCENTAGE REGULARL 11 22% OFTEN 7 14% OCCASIONALL 5 10% SOMETIMES 20 40% RARELY 7 14% TOTAL 50 100% INTREPRETATION:- The table shows that 22% of respondent are buying regularly, 14% of respondents are buying often, 10% of responding are buying occasionally, 40% of respondents are buying sometimes and 14% of respondents are buying rarely. The graph shows that the majority of the respondents are buying sometimes. Majority of the respondents are sometimes shoppers. Only few of them are buying occasionally as there may not be the requirement. 22% 14% 10% 40% 14% PATTREN OF SHOPPING IN MYNTRA REGULARL OFTEN OCCASIONALLY SOMETIMES RARELY
- 7. 4.7 CLASSIFICATION ON THE BASIS OF OTHER WEBSITES USING APART FROM MYNTRA WEBSITES NO OF RESPONDENTS PERCENTAGE FLIPKART 22 44% AMAZON 10 20% JABONG 01 2% MEESHO 13 26% OTHERS 4 8% TOTAL 50 100% INTERPRETATION:- The table shows that no of respondents in 44% respondents are preferring FLIPKART, and 20% respondents preferring AMAZON, 2% respondents preferring JABONG, 26% respondents preferring MEESHO and 8% respondents preferring OTHERS online shops. 22 10 1 13 4 44% 20% 2% 26% 8% FLIPKART AMAZON JABONG MEESHO OTHERS WEBSITES USING APART FROM MYNTRA PERCENTAGE NO OF RESPONDENTS
- 8. The table shows that majority of respondents are preferring FLIPKART AND MEESHO. This might be because of the quality service provided by FLIPKART AND MEESHO in terms of the delivery: price, product quality, effective promotion etc. and minority of the prefer the others online shopping shops today most of the customers are buying through online only so to retain and attract the customers the online shopping stores need to promote using latest strategies in an effective and attractive manner so that customers will prefer most. 4.8 PRODUCT PURCHASED THROUGH MYNTRA PARTICULAR TOTAL RANK CLOTHING 30 60% HANDBAGS 1 2% COSMATETIES 1 2% FOOTWEAR 8 18% OTHERS 10 20% TOTAL 50 100% CLOTHING 60% HANDBAGS 2% COSMETICES 2% FOOTWEAR 16% OTHERS 20% PRODUCT PURCHASED FROM MYNTRA
- 9. INTERPRETATION:- The table shows that the following is the most preferred respondents buy in MYNTRA because the variety of cloth, brand and quality etc. and minority of respondents buys other type of products. The graph shows that the majority of the respondents buying cloths in MYNTRA. This is due to the varieties of cloths and attractive offers and discounts etc…and minority of respondents buys other types of products. 4.9 MOTIVATION FACTORS TO Be IN MYNTRA. The table shows that factors motivation to buy in MYNTRA. factors 5 4 3 2 1 Delivery time 15 13 16 4 2 Price 19 14 10 5 2 Quality 20 14 14 1 1 Availability 11 13 18 6 2 Brand 21 11 14 2 2 Payment mechanism 18 13 11 5 3
- 10. INTERPRETATION:- The table shows that preferred that delivery time, price, quality, availability, brand and payment mechanism of different ranking level in the table. 15 19 20 11 21 18 13 14 14 13 11 13 16 10 14 18 14 11 4 5 1 6 2 5 2 2 1 2 2 3 0 5 10 15 20 25 delivery time price quality avaliability brand payment mechanism Series1 Series2 Series3 Series4 Series5
- 11. 4.10 RESPONDENTS RATE THE PROMOTIONS OF MYNTRA. PARTICULAR NO OF RESPONDENT PERCENTAGE POOR 2 4% AVERAGE 4 8% GOOD 27 54% VERY GOOD 10 20% EXCELLENT 7 14% TOTAL 50 100% INTERPRETATION:- The table shows the 4% respondents are poor rating about MYNTRA and 8% respondents are average rating about MYNTRA and 54% respondents are good rating about MYNTRA, 20% respondents are very good rating about MYNTRA and remaining 14% respondents are excellent rating about MYNTRA. 4% 8% 54% 20% 14% NO OF RESPONDENT POOR AVERAGE GOOD VERY GOOD EXCELLENT
- 12. 4.11 special offers Particular No of respondents Percentage Yes 41 82% No 9 18% total 50 100% INTERPRETATION:- The table shows that 82% no of respondents have got any special offer from MYNTRA and 18% have not got any special offer from MYNTRA. 82% 18% RESPONDENTS HAVE GOT ANY SPECIAL OFFER FROM MYNTRA yes no
- 13. 4.12 SATISFIED WITH THE PRODUCT INFORMATION PARTICULAR NO OF RESPONDENTS PERCENTAGE VERY MUCH SATISFIED 9 18% SATISFIED 28 56% NEUTRAL 9 18% DISSATISFIED 2 4% HIGHLY DISSATISFIED 2 4% TOTAL 50 100% INTERPRETATION:- The table shows that the 18% of respondents are very much satisfied with the product information of MYNTRA and 56% of respondents are satisfied with the product information of MYNTRA and 18% of respondents are very neutral with the product information of MYNTRA and 4% of respondents dissatisfied with the product 18% 56% 18% 4% 4% RESPONDENTS ARE SATISFIED WITH THE PRODUCT INFORMATION OF MYNTRA VERY MUCH SATISFIED SATISFIED NEUTRAL HIGHLY DISSATISFIED DISSATISFIED
- 14. information of MYNTRA and 4% of respondents are very highly dissatisfied with the product information of MYNTRA. 4.13 RESPONDENTS THINK THE MARKETING STRATEGIES HELP COMPANY TO INCREACING THE SALES. PARTICULAR NO OF RESPONDENTS PERCENTAGE YES 47 94% NO 03 6% TOTAL 50 100% INTERPRETATION:- The table shows the no of respondents 94% think the marketing strategies helps company to increases the sales and 6% think the marketing strategies no helps company to increase the sales. the shows that majority of respondents are think the strategies helps company to increase the sales and minority of respondents think marketing strategies not helps company to increase the sales. YES 94% NO 6% NO OF RESPONDNT
- 15. 4.14 NO OF RESPONDENTS SEES BEFORE MAKING A SLECTION OF PRODUCT IN MYNTRA. FACTORS 5 4 3 2 1 RATING 15 16 6 4 9 BRAND 19 17 5 3 6 DISCOUNTS 11 13 11 10 4 ADVERTISEMENT 14 14 10 8 4 PRICE 19 15 5 9 2 0 5 10 15 20 RATING BRAND DISCOUNTS ADVERTISEMENT PRICE Series5 Series4 Series3 Series2 Series1
- 16. 4.15 RESPONDENTS SATISFIED THE FOLLOWING FEATURES OF MYNTRA. FEATURES VERY MUCH SATISFIED SATISFIED NEUTRAL DISSSATISFIED HIGHLY DISSATISFIED DISCOUNT 11 16 11 3 9 CUSTOMER SERVICE 12 21 9 2 6 DELIVERY TIME 13 18 9 5 5 EXCHANGE 15 17 8 5 5 CASH ON DELIVERY 17 19 5 4 5 PACKAGING 19 13 7 2 9 0 5 10 15 20 25 VERY MUCH SATISFIED SATISFIED NEUTRAL DISSATISFIED FHIGHLY DISSATISFIED
- 17. 4.16 RESPONDENTS LIKE TO RECOMMEND OTHERS TO BUY PRODUCT OF MYNTRA. RECOMMENDED NO OF RESPONDENT PERCENTAGE YES 46 92% NO 4 8% TOTAL 50 100% INTERPRETATION:- The table shows that the 92% of respondents are yes and remaining 8% are not recommended others to buy product of MYNTRA. YES 92% NO 8% NO OF RESPONDENTS
- 18. 4.17 promotional strategies of MYNTRA. Promotional strategies 5 4 3 2 1 Coupon bough 14 15 8 5 8 Festival offer 18 17 9 5 1 End of reason sale 10 15 17 2 6 Delivery charge 15 18 8 2 7 Discounts and deals 11 23 9 5 2 14 18 10 15 11 15 17 15 18 23 8 9 17 8 9 5 5 2 2 5 8 1 6 7 2 coupon bough festival offer end of reason delivery charge discounts and deals promotional strategies Series5 Series4 Series3 Series2 Series1
- 19. 4.18 satisfied with online shopping satisfied No of respondents Percentage Strongly agree 13 26% Agree 26 52% Neutral 9 18% Disagree 1 2% Strongly disagree 1 2% Total 50 100% INTERPRETATION:- The tale shows that 26% respondents are strongly, 52% respondents are agree, 18% respondents are neutral, 2% respondents are strongly disagree and remaining 1% respondents are strongly disagree. 26% 52% 18% 2% 2% OVER ALL SATISFIED WITH ONLINE SHOPPING STRONGLY AGREE AGREE NEUTRAL DISAGREE STRONGLY DISAGREE
- 20. 4.19 continue with MYNTRA service. Service No of respondents Percentage Yes 35 70% No 1 2% May be 14 28% Total 50 100% INTERPRETATION:- The table shows that 35 respondents are continue with online shopping , 1 respondents are not continue with online shopping and remaining 14 respondents are may be continue with online shopping of MYNTRA. yes 70% NO 2% Maybe 28% no of respondent
- 21. QUESTIONNARE 1. Name:- ____________________________ 2. Gender : MALE FEMALE 3. Age Classification :- Below 18-25 25-35 35-45 Above 45 4. Marital Statues:- Married Unmarried 5. Occupation:- student Service Self employment Others 6. Education classification:- SSLC PUC Graduate Post graduate Others 7. How often do you purchase online? Regularly Often rarely Occasionally Sometimes
- 22. 8. Which Of The Others Websites, You Are Using Apart From Myntra? FLIPKART AMAZON JABONG MEESHO OTHERS 9. Which of the product have you purchased in Myntra? Cloth Handbags Cosmateties Footwear Others 10. Rate the following factors that motivates you a buy in Myntra? Factors 5 4 3 2 1 Delivery time Price Quality Availability Brand Payment mechanism
- 23. 11. Please rate the promotional of Myntra in comparison to others? Poor Average Good Very good Excellent 12. Do you hope a special offer from Myntra? Yes No 13. Are you satisfied with product information displayed in Myntra? Very much satisfied Satisfied Neutral Dissatisfied Highly dissatisfied 14. Do you think marketing strategies help company to increase sales? Yes No
- 24. 15. Rate the following factors influence you before making a selection of product in Myntra? Factors 5 4 3 2 1 Rating Brand Discounts advertisement Price 16. Are you satisfied the following features of Myntra? Features Very much satisfied Satisfied Neutral Dissatisfied Highly dissatisfied Discount Customer service Delivery time Exchange Cash on delivery Packaging 17. Would you recommend others to buy products of Myntra? Yes No
- 25. 18. Rate the following promotional strategies of Myntra? Promotional strategies 5 4 3 2 1 Coupon bough Festival offer End of reason sale Delivery charge Discounts and deals 19. Are you overall satisfied with online shopping? Strongly agree Agree Neutral Disagree Strongly disagree 20. Are you continuing with Myntra services? Yes No May be