SlideShare ist ein Scribd-Unternehmen logo
1 von 12
Downloaden Sie, um offline zu lesen
An Experimental Usability Test for different Destination
              Recommender Systems

                                  Andreas H. Zins a,
                                Ulrike Bauernfeind a,
                                 Fabio Del Missierb,
                               Adriano ‚Venturinib and
                               Hildegard Rumetshoferc
                     a
              Institute for Tourism and Leisure Studies
Vienna University of Economics and Business Administration, Austria
                {zins, bauernfeind}@wu-wien.ac.at
                                        b
                               ITC- irst
      Electronic Commerce and Tourism Research Laboratory, Italy
                     {delmissier, venturi}@itc.it
                 c
                     Institute for Applied Knowledge Processing
                             University of Linz, Austria
                     hildegard.rumetshofer@faw.uni- linz.ac.at


                                        Abstract
The present paper outlines the experimental evaluation of travel recommendation systems.
First, theoretical concepts concentrating on the influencing factors for human-computer
interaction, system usage and satisfaction are reviewed. An introduction of various methods
dealing with usability evaluation is given and an overview of different “standard” survey
instruments is provided. Second, a case study, the assessment of a travel recommender system
currently under development, is presented. The evaluation considers aspects such as design and
layout, functionality or ease of use. These measures obtained by a user questionnaire are
combined with user interaction logging data. Different variants of the travel recommendation
system and a baseline system were used for the assessment. This promising approach
complements subjective ratings by objective tracking data to obtain a more thorough picture of
the system’s weaknesses. Finally, findings are presented and an explanatory model for
user/system satisfaction is proposed.
Keywords: travel recommendation system; usability testing; human-computer interaction
(HCI); user interface questionnaire; subjective vs. objective rating.

1    Introduction

As the amount of information in the field of tourism becomes abundant, finding the
desired information is increasingly difficult. Therefore, recommender systems became
a significant tool in the travel industry; they offer users a convenient opportunity to
find a travel bundle or a single travel item such as accommodation. The development
of a recommendation system is a time and cost-intensive issue and a lot of usability
questions arise. Users will reject systems that do not meet their needs or provide
insufficient functionalities. Before its implementation, an assessment is a prerequisite
to discover strengths and weaknesses and to be able to provide the best system
version possible. Thus, the primary goal of this contribution is to illustrate how the
prototype of a recommendation system can be evaluated. Which concepts can be
found in the literature explaining human computer interaction and which methods
exist and are used to evaluate usability?

2    Theoretical considerations

An overview of theories, which concentrate on human computer-interaction (HCI)
and computer-mediated environments (CMEs), will be given. The aim is to illustrate
the factors, which mostly influence the usage of a system.

The Technology Acceptance Model (TAM; Davis 1989) relies on two factors
explaining human behaviour: perceived usefulness and perceived ease of use.
Perceived usefulness describes the user’s point of view of enhancing his/her
performance by using the system. Perceived ease of use is the degree of effort the user
believes he or she will need for using a particular system. There are numerous
contributions extending the TAM by additional factors such as playfulness, attitude
(Moon and Kim 2001), trust and risk (Pavlou 2001) or accessibility and attitude
(Jeong and Lambert 2001). Another approach differing from the TAM is the Concept
of Flow (Novak, Hoffman and Yung 2000) including the factors skill and control,
challenge and arousal, focused attention, telepresence, and time distortion. These
factors contribute to flow, a state of mind where the user is completely devoted to the
use of a system and forgets everything else around him, like time. Thus, the aim is to
create a compelling online experience to facilitate flow.

Another theoretical area relevant for this contribution is usability testing and system
evaluation. According to ISO 9241-11 (1998) usability is “the extent to which a
product can be used by specified users to achieve specified goals with effectiveness,
efficiency and satisfaction”. Lindgaard (1994) described usability as the ease of
learning and using computer systems from the experienced and unexperienced user’s
point of view. Classifications of usability evaluation methods differ from author to
author. According to Riihiaho (2000) usability evaluation can be divided into two
broad categories: user testing and usability inspection. User testing involves usability
testing, pluralistic, informal, visual walkthroughs and contextual inquiry. Usability
inspection comprises heuristic evaluation, cognitive walkthrough and GOMS (goals,
operators, methods, and selection rules). Harms and Schweibenz (2000) distinguish
two methods: the heuristic evaluation and usability testing. But different contributions
have a common definition of usability testing: persons performing a given task and
evaluating the system. Empirical testing with potential users is the best way to find
problems related to users’ tasks and experiences (Riihiaho 2000). A common way is
to ask a set of participants to accomplish a realistic task and performance measures
are collected (Galitz 2002). Usability can be gauged by objective and subjective
variables. Objective measures include for instance the task completion time, the
number of queries, or the error rate. Subjective measures, i.e. user’s feedback, are
often collected by questionnaires. For this purpose, some standard questionnaires
were created. Several of these survey instruments were suggested by IBM (Lewis
1995): the Post-Study System Usability Questionnaire (PSSUQ), the Computer
System Usability Questionnaire (CSUQ) or the After-Scenario Questionnaire (ASQ).
There are other examples as well: the Questionnaire for User Interface Satisfaction
(QUIS) developed by Chin, Diehl and Norman (1988), the System Usability Scale
(SUS) (http://www.usability.serco.com/trump/documents/Suschapt.doc) or the
Website              Analysis          and            Measurement             Inventory
(http://www.ucc.ie/hfrg/questionnaires/wammi).

3    Research objectives and applied methodology

The approach of the experimental evaluation described here consists of building some
variants of the recommendation prototype (named DieToRecs) and of testing some
hypotheses about the performance of each variant on a set of dependent measures
involving a reference or baseline system (in this case the TISCover system).

The variants to be tested are:
         o DTR-A: interactive query management only (i.e. empty case base and
              no recommendation support via smart sorting or through other means);
         o DTR-B: single item recommendation with interactive query
              management and ranking based on a representative case base;
         o DTR-C: this variant allows a user to navigate among complete travel
              recommendations in a simple and effective way (starting from the link
              “Seeking for inspiration”). Six travel examples are shown at each page.
Then the user is requested to provide a feedback on the presented
             examples in a simple form (“I like this” vs. “I do not like this”). Finally,
             the system updates the proposed examples by means of the feedback
             provided by the user, and the similarity-based retrieval in the case base
             is performed again.

The main hypotheses will concern the users’ search and choice behaviour, and their
satisfaction:
H1: The recommendation-enhanced system is able to deliver useful recommendations
This hypothesis can be tested by analyzing the differences between the DieToRecs
variants DTR-A vs. DTR-B on the relative position of the item within the result list
which the user selected and added to the travel plan. Only if the recommendation is
good the user will immediately find a suitable item. The position for DTR-B should
be nearer to the top of the visualized result list.
H2: The recommendation-enhanced system is able to facilitate the construction of
good travel plans
This hypothesis can be tested by analyzing the differences between the three systems
(the DieToRecs variants and TISCover) on the users’ ratings of the selected items.
We should find a significant difference between the two DieToRecs variants (DTR-A
will get a lower mean satisfaction rating than DTR-B). Nonetheless, DTR-A will not
receive very low ratings, due to the availability of the interactive query management
functions, which will help the plan construction. For different reasons, both TISCover
and the recommendation-enhanced variant should support the construction of
satisfying plans. TISCover can exploit its grounding on a rich item database and its
degree of development and testing and DTR-B should benefit from its effective
recommendation functions.
H3: The recommendation-enhanced system allows a more efficient search
The recommendation-enhanced system should enable the user to perform fewer
queries, to examine fewer pages and to reduce the search and decision time. The
variant with the empty case base will be less efficient, due to the lack of smart sorting
in the presentation of options. Therefore, the user will have to browse a greater
number of result pages, and occasionally will have to reformulate the query. The
TISCover system should obtain an intermediate result (because of the lack of
intelligent support, but its grounding on a rich item database).
H4: The recommendation-enhanced system heightens the user satisfaction
Given that user satisfaction is related both to the perception of the efficiency and
effectiveness of the system, we expect to find significant differences between DTR-B
and DTR-A on the questionnaire measures which are associated with efficiency,
effectiveness, and overall satisfaction. TISCover should get good ratings due to its
degree of development and testing that will prevent the user to be faced with salient
system failures or errors (strongly affecting user satisfaction). Furthermore, there will
be some differences in the products accessed by TISCover and DieToRecs (some
features could be missing in the information accessed by the DieToRecs variants), and
this should be appropriately taken into account in the interpretation and evaluation of
the results.

Different participants from a student population, randomly assigned to the
experimental groups, were asked to use both one DieToRecs variant and a so-called
baseline system (see Table 1). In our case, the baseline system is the TISCover.com
on-line travel agency web site. The DieToRecs recommender system and its variants
are fed by a substantial subset of the travel items represented in the TISCover system.
An additional small number of participants will be assigned to a full functionality
design (corresponding to a variant recommending complete travel arrangements
called DTR-C), to obtain some exploratory indications on the user’s interaction with a
system resembling the final development of the DieToRecs project. The users were
asked to perform some tasks in the general context of “planning a travel in Tyrol”. A
series of objective and subjective measures were recorded, both automatically during
the interaction (by means of the logging component; DTR-variants only) and by
asking the user to fill a questionnaire after each test session. To gain external validity
it is necessary to design tasks that are representative of the typical usage of the system
in the real world. So, putting too many constraints on the participants should be
avoided (the users will typically be unconstrained). On the other hand, it was
attempted to obtain a representative set of search and interaction behaviours, trying to
reduce the variability due to the initial exploratory and erratic navigation behaviors.
The choice in favour of one training and one separate test tasks is motivated by the
objective to balance the representativeness concern and the need to limit the duration
of the experimental session (in order to avoid fatigue effects and unwanted variations
in attention and motivation). The participants were requested to choose a different
geographical area for the execution of the two test tasks, thus trying to avoid content-
specific learning.
                              Table 1. Experimental Design
Sequence         Group 1     Group 2     Group 3      Group 4    Group 5      Group 6
First System     TISCover    DTR-A       TISCover     DTR-B      TISCover     DTR-C
Second
                  DTR-A      TISCover     DTR-B      TISCover     DTR-C      TISCover
System
   N = 47           10          11          10          10           2           4

Besides some socio-demographic and internet usage characteristics the questionnaire
focused on the process and outcome evaluation of the trip planning task. After having
screened a list of potential standardized measurement instruments devised to capture
some aspects of usability criteria the Post-Study-Satisfaction-User-Questionnaire
(PSSUQ with 19 statements, Lewis 1995) was chosen, slightly adapted to a non-
technical wording and extended by typical aspects relevant for recommendation
systems (resulting in 23 statements in total).
Table 2. Usability and User Satisfaction Questionnaire (adapted from PSSUQ)


                                                                              Effectivness

                                                                              Satisfaction
                                                                              Ease-of-use

                                                                              Reliability
                                                                              PSSUQ
Items


Design / Layout
I liked using the interface of the system.                                    o x
The organization of information presented by the system was clear.            c x
The interface of this system was p leasant to use.                            c x
Functionality
This system has all the functions and capabilities that I expect it to have.   o     x
The information retrieved by the system was effective in helping me to
                                                                               c     x
complete the tasks.
The products listed by the system as a reply to my request were suitable for
                                                                               n     x
my travel.
I found the “recommend (the whole) travel” function useful.                    n
Ease of Use
It was simple to use this system.                                              o x
It was easy to find the information I needed.                                  o     x
The information (such as online-help, on-screen messages, and other
                                                                               o        x
documentation) provided with this system was clear.
Overall, this system was easy to use.                                          c x
Learnability
It was easy to learn to use the system.                                        o x
There was too much information to read before I can use the system.            n
The information provided by the system was easy to understand.                 c x
Satisfaction
I felt comfortable using this system.                                          o           x
I enjoyed constructing my travel plans through this system.                    n           x
Overall, I am satisfied with this system.                                      o           x
Outcome / Future Use
I was able to complete the task quickly using this system.                     c     x
I could not complete the task in the preset time frame.                        n     x
I believe I could become productive quickly using this system.                 o x
The system was able to convince me that the recommendations are of value. n          x
From my current experience with using the system, I think I would use it
                                                                               n     x
regularly.
Errors / System Reliability
Whenever I made a mistake using the system, I could recover easily and
                                                                               o        x
quickly.
The system gave error messages that clearly told me how to fix problems.       o        x
   Note: “o”: unchanged items, “c”: changed wording, “n”: new items added; “x”: highly
     loading variables (one variable without “x” was an outlier and did not load on any of the
     factors).
Though the psychometric properties have been documented by Lewis (1995) the
structure (system usefulness, information quality, and interface quality) and content
(e.g. satisfaction aspects mixed with functional qualities) of this instrument had to be
treated with caution. Table 2 shows the final questionnaire used. Furthermore, the
respective statements are classified according to the factor on which they loaded
highly.

4     Results

The following analysis investigates the hypotheses 1 to 4 step by step. It is based on a
sample of 47 test persons with a share of 63% females. One quarter belongs to an age
group older than 25, the majority is under 25 years. Usage of web and e-commerce
services was measured by some questions of the 10th GVU’s User Survey
(www.gvu.gatech.edu/user_surveys) adapted to our context and some new questions.
General internet usage was rather high with a share of 62% using the Web between 4
to 6 years. No participant showed an experience less than one year. The students’
population was well captured by a 72% share of test persons using the internet daily.
20% indicated to use the internet several times a week. Almost everybody (96%) used
the internet for information retrieval. About 75% bought some product or service at
least once a year over the internet. With regard to the travel domain the usage rates
are comparable: 98% used this source for some information; almost 80% purchased
some travel specific product on the internet at least once a year. Only one third of the
test persons revealed to be unfamiliar with Tyrol. Only 4% had never been to Tyrol; a
share of 20% visited Tyrol at least once. In a first attempt the usefulness of the
different recommendation functions implemented in the three DieToRecs variants has
to be tested. The logging data – available only for the DieToRecs system – delivered
the average position of each item in the presented result list of queries. Those items
selected and put into the travel plan are taken here to compare the relative position
(cf. Table 3; DTR-C does not provide single item result lists as it recommends in the
initial step complete travel plans only). The differences between DTR-A and DTR-B
are substantial and appear for all item categories. This can be interpreted as a sign of
consistency though the sample size does not suffice to deliver statistically significant
results (à H1 accepted without statistical proof).

    Table 3. Average Position and Standard Deviation for Items in the Result List by
                                 DieToRecs Variants
                                  DTR-A                   DTR-B                t-test
                            Average   Std.Dev.      Average   Std.Dev.
Items in general                 4.3        4.6          2.9        2.8       not sign.
Accommodation items              5.0        0.4          2.2        1.2       not sign.
Destination items                3.9        0.1          2.5        1.3       not sign.
Interest items                   4.0        4.8          3.5        3.0       not sign.
Next, an explanatory model for explaining user satisfaction with a typical structure as
outlined in Figure 1 was the starting point for the investigation of evaluative
dimensions. The original three-dimensional configuration (PSSUQ, Lewis 1995)
could not be identified with the empirical data of this study. Instead, the following
three dimensions turned out to represent a very consistent way of how the respondents
evaluated the baseline and experimental recommendation systems: ease-of use
combined with design aspects and learnability; outcome combined with functionality
and effectiveness; and reliability strongly related with error handling (Figure 1;
Cronbachs Alpha coefficients below, for loading indicators cf. Table 2).


                    Ease-of-use/
                     Learnability
                     Alpha=0.94

                                    DTR: 0.30
                                    TIS: 0.37


                   Effectiveness/                   User/System
                                    DTR: 0.73
                      Outcome       TIS: 0.61       Satisfaction
                     Alpha=0.83                      Alpha=0.95

                                    DTR: n.s.
                                    TIS: n.s.


                     Reliability
                     Alpha=0.78


               Fig. 1. Explanatory Model for User/System Satisfaction

Testing the criterion validity by applying linear regression analyses – separately for
the two systems evaluated by each respondent – on the dependent satisfaction
dimension very similar structural effects were detected (cf. Figure 1). Both models
explained a high proportion of the satisfaction variance (DTR-R²: 0.94; TIS-R²: 0.87).
The standardized regression coefficients do not differ substantially. Finally, the
reliability dimension does not contribute directly to the process and outcome
evaluation in terms of user satisfaction ratings. From the point of view of content
validity this configuration seems to converge towards the widely acknowledged
Technology Acceptance Model (Davis 1989; Lederer et al. 2000) which proposes two
factors for explaining system usage: perceived usefulness and perceived ease-of-use.

Based on these validity checks the detailed analysis of the interaction patterns,
coupled with the experimental results, can follow to test the next hypotheses. An
objective picture of the system effectiveness and efficiency, and of the user-
recommender interaction quality should be derived. Overall, the average evaluation
scales show evidence of a solid superiority for our baseline system TISCover in each
of the dimensions. This result was already expected and explained within the
hypotheses 2 and 4 (see above) and is obviously due to the mature developmental
stage and the huge and detailed data available. Another indicator of this performance
difference can be derived from the subjective declaration whether the planning task
could have been accomplished successfully or not: DieToRecs achieved a 30% ratio;
TISCover 64%.

In terms of differences of the item ratings between the DieToRecs variants the next
Table exhibits a clear and confirming picture. The more intelligent recommendation
functions were in operation the better the satisfaction ratings are. Overall, relatively
more respondents achieved to finish their plans during the given time frame
successfully. For the destination recommendations the DTR-C variant holds a
significant better position compared to that of the modest DTR-A variant. The
differences of the accommodation ratings are even more distinct: The DTR-C variant
works better than DTR-A and DTR-B. For the activities the result is even more
precise as all pair wise differences show the expected direction and significance level
(à H2 confirmed).

    Table 4. Satisfaction Ratings for Travel Plan Elements by DieToRecs Variants
 Travel Plan Element                                     System Variants
                                      Average       DTR-A DTR-B DTR-C                  p-value
 Finished plans                         30%          10%      30%        100%            0.001
 Ratings
           Destination                    4.0         2.8         4.5            5.3     0.10
           significant A-C                                        0.10
           Accommodation                  4.1         4.1         3.6            5.9     0.15
           significant B-C                                                0.01
           significant A-C                                        0.05
           Activities                     4.2         3.2         4.9            7.0     0.05
           significant A-B                                  0.1
           significant B-C                                                0.01
           significant A-C                                        0.001
Note: “1”: very dissatisfied, “7”: very satisfied

As outlined in hypotheses 3 the objective measures of system evaluation are
necessary for further testing. They were derived from the user logging component
exhibited by Table 5. In general, there is a lack of power due to the small sample size.
Considering the different success rates in terms of finished travel plans (see Table 4)
the irrelevant differences in the number of queries and page visits turn into some more
encouraging findings (à H3 confirmed). Session time has to be taken with caution
because the experimental process strictly limited the granted time for the travel plan
assembly. Nevertheless, the improved recommendation functions help to reduce the
necessary planning time. From the number of query refinement options applied we
can learn that in most of the cases the result lists were too short (and maybe more
often empty) than too long. No apparent differences can be detected.

            Table 5. Objective Efficiency Measures by DieToRecs Variants
                                                     System Variants
                                            DTR-A        DTR-B       DTR-C    p-value
 Total number of queries                     12.9         13.3        9.5        n.s.
 Accommodation queries                        5.5          6.5        4.0        n.s.
 Destination queries                          4.3          2.1        2.3        n.s.
 Interest queries                             3.1          4.6        1.8        n.s.

 Number of pages visited                      20.2        18.8        8.8         n.s.
 Number of query relaxations applied           5.8         4.6        4.0         n.s.
 Number of query tightening applied            0.6         0.2         0          n.s.

 Session time in minutes                       25         20          23         > 0.1
Note: n.s. = not significant

In order to test the final hypotheses 4, the variation of the evaluation scores (see
Table 6) was decomposed with respect to the within-subject (i.e. sequence order) and
the between-subject (i.e. variant comparison) effects. In general, a significant order or
sequence effect could be detected which affected each dimension except reliability.
As initially assumed a learning effect appeared which favoured the ratings for the
second trip planning task. On average, this learning effect was much more
pronounced in the situation in which the baseline system was used and evaluated in
second place. The effect size was rather similar for the system satisfaction scale;
whereas for the ease-of-use scale it was more than double and for the outcome scale
even more than eight times as large.

 Table 6. Average Ratings and Differences on the Evaluation Dimensions by System
                                     Variants
                             TISCover       DieToRecs        DTR-A – DTR-B – DTR-C –
                                  Ø             Ø            TISCover TISCover TISCover
 User Satisfaction                   3.2             4.6           2.33  1.05*)  -0.50*)
 Ease-of-use                         2.8             3.6           1.34  0.45*)   0.31*)
 Effectiveness/Outcome               3.4             4.6           1.71    1.01  -0.50*)
 Reliability                         3.5             3.7         0.60*)  0.05*)  -0.22*)
Note: “1”: strongly agree, “7”: strongly disagree; *) not significant

Considering the sequence effect simultaneously with the between-subject effect of
comparing different system variants (only DTR-A and DTR-B due to the small
sample size) a considerable scale difference remains for each scale (ease-of-use: 0.43
[p = 0.39]; outcome: 0.32 [p = 0.47]; reliability: 0.60 [p = 0.26]; satisfaction: 0.70 [p
= 0.2]). Comparing the ratings – without order effect – only for respondents testing
the DTR-C variant the differences even turn into the other – expected – direction.
Each scale except ease-of-use exhibit better average scores for the DieToRecs system
(cf. Table 6). Hence, in principle hypothesis 4 cannot be corroborated entirely, though
taking the small sample size into account the results show the expected direction.

5    Conclusions

An experimental evaluation of a travel recommendation system applying objective
and subjective measures was accomplished. The travel recommendation system
prototype DieToRecs and a reference or baseline system TISCover were tested and
evaluated by users with the basic goal to discover weaknesses and to be able to
remove them in the further development process. Although the assessment results for
the baseline system were significantly better than for DieToRecs, the higher
satisfaction ratings for the DieToRecs variant with more recommendation functions
confirm the appropriate direction. A certain familiarisation effect for the TISCover
system cannot be completely denied. The user sample employed for this assessment
was very likely to know the system and might have used it before. For the purpose of
testing DieToRecs a subset of TISCovers’ travel items was fed into the database. Of
course, TISCover as a full functioning travel recommendation system disposes of a
greater variety of travel items than the DieToRecs subset. Nevertheless, it can be
assumed that these differences of scope are minor compared to a system comparison
which would be based on completely different databases. Hence, the outcome
evaluation relies much more on process differences than on those of content. As far as
the survey instrument (adapted from PSSUQ) and the explanatory model for user
system satisfaction is concerned, the three-dimensions (i.e. system usefulness,
information quality and interface quality) explaining user/system satisfaction
proposed by Lewis (1995) were not confirmed. Instead, a three factor solution for
explaining overall system satisfaction could be ascertained. These factors were
labelled with ease-of-use/learnability, effectiveness/outcome and reliability. Finally,
the approach used in this study to generate empirical data is a promising one since the
combination of objective and subjective measures enables the assessment from a
twofold point of view: the satisfaction ratings delivered by the user and the interaction
data showing the users’ search and selection behaviour.

Acknowledgement
This work has been partially funded by the European Union's Fifth RTD Framework
Programme (under contract DIETORECS IST-2000-29474). The authors would like to thank
all other colleagues of the DieToRecs team for their valuable contribution to this study.
References
Chin, J.P., Diehl, V.A. & K. Norman (1988). Development of an instrument measuring user
satisfaction of the human-computer interface. Proceedings of CHI’88 Conference on Human
Factors in Computing Systems, Washington, DC.

Davis, F.D. (1989). Perceived usefulness, perceived ease of use, and user acceptance of
information technology. MIS Quarterly 13(3): 319-340.

Galitz, W.O. (2002). The essential guide to user interface design. New York: Wiley Computer
Publishing.

ISO (1998). ISO 9241 – 11. Usability Definitions - Guidance on Usability. Geneva,
Switzerland. International Standards Organisation. (http://www.usability.serco.com/trump
/resources/standards.htm [August 29, 2003]).

Harms, I. & W. Schweibenz (2000). Testing Web Usability. Information Management &
Consulting 15(3): 61-66.

Jeong, M. & C.U. Lambert (2001). Adaptation of an Information Quality Framework to
Measure Customers’ Behavioral Intentions to Use Lodging Web Sites. Hospitality Management
20: 129-146.

Lederer, A.L., D.J. Maupin, M.P. Sena, & Y. Zhuang (2000). The technology acceptance model
and the World Wide Web. Decision Support Systems 29(3): 269-282.

Lewis, J.R. (1995). IBM computer usability satisfaction questionnaires: psychometric
evaluation and instructions for use. International Journal of Human Computer Interaction 7(1):
57-78.

Lindgaard, G. (1994). Usability Testing and System Evaluation. A Guide for Designing Useful
Computer Systems. London: Chapman & Hall.

Moon, J.-W. & Y.-G. Kim (2001) Extending the TAM for a World-Wide Context. Information
& Management 38: 217-230.

Novak, T.P., Hoffman, D.L. & Y.-F. Yung (2000). Measuring the Customer Experience in
Online Environments: A Structural Modeling Approach. Marketing Science 19(1): 22-42.

Pavlou, P.A. (2003). Consumer Acceptance of Electronic Commerce – Integrating Trust and
Risk with the Technology Acceptance Model. International Journal of Electronic Commerce
7(3): 69-103.

Riihiaho, S. (2000). Experiences with Usability Evaluation Methods. Thesis at the Helsinki
University of Technology, Laboratory of Information Processing Science.

Weitere ähnliche Inhalte

Was ist angesagt?

A Recommender System Sensitive to Intransitive Choice and Preference Reversals
A Recommender System Sensitive to Intransitive Choice and Preference ReversalsA Recommender System Sensitive to Intransitive Choice and Preference Reversals
A Recommender System Sensitive to Intransitive Choice and Preference Reversalscsandit
 
Analyzing Specialized Views of Transportation Under Mean Safety By Using Fuzz...
Analyzing Specialized Views of Transportation Under Mean Safety By Using Fuzz...Analyzing Specialized Views of Transportation Under Mean Safety By Using Fuzz...
Analyzing Specialized Views of Transportation Under Mean Safety By Using Fuzz...IJERA Editor
 
Ontological and clustering approach for content based recommendation systems
Ontological and clustering approach for content based recommendation systemsOntological and clustering approach for content based recommendation systems
Ontological and clustering approach for content based recommendation systemsvikramadityajakkula
 
Detailed structure applicable to hybrid recommendation technique
Detailed structure applicable to hybrid recommendation techniqueDetailed structure applicable to hybrid recommendation technique
Detailed structure applicable to hybrid recommendation techniqueIAEME Publication
 
User Experience Testing
User Experience TestingUser Experience Testing
User Experience TestingKarl Smith
 
IRJET- Personalize Travel Recommandation based on Facebook Data
IRJET- Personalize Travel Recommandation based on Facebook DataIRJET- Personalize Travel Recommandation based on Facebook Data
IRJET- Personalize Travel Recommandation based on Facebook DataIRJET Journal
 
Ijmer 46067276
Ijmer 46067276Ijmer 46067276
Ijmer 46067276IJMER
 

Was ist angesagt? (8)

A Recommender System Sensitive to Intransitive Choice and Preference Reversals
A Recommender System Sensitive to Intransitive Choice and Preference ReversalsA Recommender System Sensitive to Intransitive Choice and Preference Reversals
A Recommender System Sensitive to Intransitive Choice and Preference Reversals
 
Analyzing Specialized Views of Transportation Under Mean Safety By Using Fuzz...
Analyzing Specialized Views of Transportation Under Mean Safety By Using Fuzz...Analyzing Specialized Views of Transportation Under Mean Safety By Using Fuzz...
Analyzing Specialized Views of Transportation Under Mean Safety By Using Fuzz...
 
Ontological and clustering approach for content based recommendation systems
Ontological and clustering approach for content based recommendation systemsOntological and clustering approach for content based recommendation systems
Ontological and clustering approach for content based recommendation systems
 
Detailed structure applicable to hybrid recommendation technique
Detailed structure applicable to hybrid recommendation techniqueDetailed structure applicable to hybrid recommendation technique
Detailed structure applicable to hybrid recommendation technique
 
User Experience Testing
User Experience TestingUser Experience Testing
User Experience Testing
 
IRJET- Personalize Travel Recommandation based on Facebook Data
IRJET- Personalize Travel Recommandation based on Facebook DataIRJET- Personalize Travel Recommandation based on Facebook Data
IRJET- Personalize Travel Recommandation based on Facebook Data
 
Mr1480.ch4
Mr1480.ch4Mr1480.ch4
Mr1480.ch4
 
Ijmer 46067276
Ijmer 46067276Ijmer 46067276
Ijmer 46067276
 

Andere mochten auch

Location sharing and automatic message sender Android Application
Location sharing and automatic message sender Android ApplicationLocation sharing and automatic message sender Android Application
Location sharing and automatic message sender Android ApplicationKavita Sharma
 
The Near Future of CSS
The Near Future of CSSThe Near Future of CSS
The Near Future of CSSRachel Andrew
 
The Presentation Come-Back Kid
The Presentation Come-Back KidThe Presentation Come-Back Kid
The Presentation Come-Back KidEthos3
 
How to Battle Bad Reviews
How to Battle Bad ReviewsHow to Battle Bad Reviews
How to Battle Bad ReviewsGlassdoor
 
Activism x Technology
Activism x TechnologyActivism x Technology
Activism x TechnologyWebVisions
 
Classroom Management Tips for Kids and Adolescents
Classroom Management Tips for Kids and AdolescentsClassroom Management Tips for Kids and Adolescents
Classroom Management Tips for Kids and AdolescentsShelly Sanchez Terrell
 
The Buyer's Journey - by Chris Lema
The Buyer's Journey - by Chris LemaThe Buyer's Journey - by Chris Lema
The Buyer's Journey - by Chris LemaChris Lema
 

Andere mochten auch (7)

Location sharing and automatic message sender Android Application
Location sharing and automatic message sender Android ApplicationLocation sharing and automatic message sender Android Application
Location sharing and automatic message sender Android Application
 
The Near Future of CSS
The Near Future of CSSThe Near Future of CSS
The Near Future of CSS
 
The Presentation Come-Back Kid
The Presentation Come-Back KidThe Presentation Come-Back Kid
The Presentation Come-Back Kid
 
How to Battle Bad Reviews
How to Battle Bad ReviewsHow to Battle Bad Reviews
How to Battle Bad Reviews
 
Activism x Technology
Activism x TechnologyActivism x Technology
Activism x Technology
 
Classroom Management Tips for Kids and Adolescents
Classroom Management Tips for Kids and AdolescentsClassroom Management Tips for Kids and Adolescents
Classroom Management Tips for Kids and Adolescents
 
The Buyer's Journey - by Chris Lema
The Buyer's Journey - by Chris LemaThe Buyer's Journey - by Chris Lema
The Buyer's Journey - by Chris Lema
 

Ähnlich wie Experimental Usability Test for Travel Recommender Systems

OGD new generation infrastructures evaluation based on value models
OGD new generation infrastructures evaluation based on value modelsOGD new generation infrastructures evaluation based on value models
OGD new generation infrastructures evaluation based on value modelsCharalampos Alexopoulos
 
Open Data Infrastructures Evaluation Framework using Value Modelling
Open Data Infrastructures Evaluation Framework using Value Modelling Open Data Infrastructures Evaluation Framework using Value Modelling
Open Data Infrastructures Evaluation Framework using Value Modelling Yannis Charalabidis
 
Multi-Dimensional Framework in Public Transport Planning
Multi-Dimensional  Framework in Public Transport PlanningMulti-Dimensional  Framework in Public Transport Planning
Multi-Dimensional Framework in Public Transport PlanningSharu Gangadhar
 
Enhanced model for ergonomic evaluation of information systems: application t...
Enhanced model for ergonomic evaluation of information systems: application t...Enhanced model for ergonomic evaluation of information systems: application t...
Enhanced model for ergonomic evaluation of information systems: application t...IJECEIAES
 
IRJET- Review on Different Recommendation Techniques for GRS in Online Social...
IRJET- Review on Different Recommendation Techniques for GRS in Online Social...IRJET- Review on Different Recommendation Techniques for GRS in Online Social...
IRJET- Review on Different Recommendation Techniques for GRS in Online Social...IRJET Journal
 
Recommender systems: a novel approach based on singular value decomposition
Recommender systems: a novel approach based on singular  value decompositionRecommender systems: a novel approach based on singular  value decomposition
Recommender systems: a novel approach based on singular value decompositionIJECEIAES
 
Usability Evaluation in Educational Technology
Usability Evaluation in Educational Technology Usability Evaluation in Educational Technology
Usability Evaluation in Educational Technology Alaa Sadik
 
A Novel Approach for Travel Package Recommendation Using Probabilistic Matrix...
A Novel Approach for Travel Package Recommendation Using Probabilistic Matrix...A Novel Approach for Travel Package Recommendation Using Probabilistic Matrix...
A Novel Approach for Travel Package Recommendation Using Probabilistic Matrix...IJSRD
 
History and Overview of the Recommender Systems.pdf
History and Overview of the Recommender Systems.pdfHistory and Overview of the Recommender Systems.pdf
History and Overview of the Recommender Systems.pdfssuser5b0f5e
 
A.hybrid.recommendation.approach.for.a.tourism.system
A.hybrid.recommendation.approach.for.a.tourism.systemA.hybrid.recommendation.approach.for.a.tourism.system
A.hybrid.recommendation.approach.for.a.tourism.systembenny ribeiro
 
NORDICHI'14 - Carine Lallemand - How Relevant is an Expert Evaluation of UX b...
NORDICHI'14 - Carine Lallemand - How Relevant is an Expert Evaluation of UX b...NORDICHI'14 - Carine Lallemand - How Relevant is an Expert Evaluation of UX b...
NORDICHI'14 - Carine Lallemand - How Relevant is an Expert Evaluation of UX b...Carine Lallemand
 
Hybrid-e-greedy for mobile context-aware recommender system
Hybrid-e-greedy for mobile context-aware recommender systemHybrid-e-greedy for mobile context-aware recommender system
Hybrid-e-greedy for mobile context-aware recommender systemBouneffouf Djallel
 
The 5th Israeli Conference on Robotics
The 5th Israeli Conference on RoboticsThe 5th Israeli Conference on Robotics
The 5th Israeli Conference on RoboticsGeorge Adamides
 
The 5th Israeli Conference on Robotics - my presentation
The 5th Israeli Conference on Robotics - my presentationThe 5th Israeli Conference on Robotics - my presentation
The 5th Israeli Conference on Robotics - my presentationGeorge Adamides
 
Tourism Based Hybrid Recommendation System
Tourism Based Hybrid Recommendation SystemTourism Based Hybrid Recommendation System
Tourism Based Hybrid Recommendation SystemIRJET Journal
 
A literature survey on recommendation
A literature survey on recommendationA literature survey on recommendation
A literature survey on recommendationaciijournal
 
A Literature Survey on Recommendation System Based on Sentimental Analysis
A Literature Survey on Recommendation System Based on Sentimental AnalysisA Literature Survey on Recommendation System Based on Sentimental Analysis
A Literature Survey on Recommendation System Based on Sentimental Analysisaciijournal
 
Heuristic Evaluation of User Interfaces: Exploration and Evaluation of Niels...
Heuristic Evaluation of User Interfaces:  Exploration and Evaluation of Niels...Heuristic Evaluation of User Interfaces:  Exploration and Evaluation of Niels...
Heuristic Evaluation of User Interfaces: Exploration and Evaluation of Niels...Ultan O'Broin
 
Persuasive Technologies for Sustainable Urban Mobility
Persuasive Technologies for Sustainable Urban MobilityPersuasive Technologies for Sustainable Urban Mobility
Persuasive Technologies for Sustainable Urban MobilityGreenapps&web
 

Ähnlich wie Experimental Usability Test for Travel Recommender Systems (20)

OGD new generation infrastructures evaluation based on value models
OGD new generation infrastructures evaluation based on value modelsOGD new generation infrastructures evaluation based on value models
OGD new generation infrastructures evaluation based on value models
 
Open Data Infrastructures Evaluation Framework using Value Modelling
Open Data Infrastructures Evaluation Framework using Value Modelling Open Data Infrastructures Evaluation Framework using Value Modelling
Open Data Infrastructures Evaluation Framework using Value Modelling
 
Multi-Dimensional Framework in Public Transport Planning
Multi-Dimensional  Framework in Public Transport PlanningMulti-Dimensional  Framework in Public Transport Planning
Multi-Dimensional Framework in Public Transport Planning
 
Enhanced model for ergonomic evaluation of information systems: application t...
Enhanced model for ergonomic evaluation of information systems: application t...Enhanced model for ergonomic evaluation of information systems: application t...
Enhanced model for ergonomic evaluation of information systems: application t...
 
IRJET- Review on Different Recommendation Techniques for GRS in Online Social...
IRJET- Review on Different Recommendation Techniques for GRS in Online Social...IRJET- Review on Different Recommendation Techniques for GRS in Online Social...
IRJET- Review on Different Recommendation Techniques for GRS in Online Social...
 
V3 i35
V3 i35V3 i35
V3 i35
 
Recommender systems: a novel approach based on singular value decomposition
Recommender systems: a novel approach based on singular  value decompositionRecommender systems: a novel approach based on singular  value decomposition
Recommender systems: a novel approach based on singular value decomposition
 
Usability Evaluation in Educational Technology
Usability Evaluation in Educational Technology Usability Evaluation in Educational Technology
Usability Evaluation in Educational Technology
 
A Novel Approach for Travel Package Recommendation Using Probabilistic Matrix...
A Novel Approach for Travel Package Recommendation Using Probabilistic Matrix...A Novel Approach for Travel Package Recommendation Using Probabilistic Matrix...
A Novel Approach for Travel Package Recommendation Using Probabilistic Matrix...
 
History and Overview of the Recommender Systems.pdf
History and Overview of the Recommender Systems.pdfHistory and Overview of the Recommender Systems.pdf
History and Overview of the Recommender Systems.pdf
 
A.hybrid.recommendation.approach.for.a.tourism.system
A.hybrid.recommendation.approach.for.a.tourism.systemA.hybrid.recommendation.approach.for.a.tourism.system
A.hybrid.recommendation.approach.for.a.tourism.system
 
NORDICHI'14 - Carine Lallemand - How Relevant is an Expert Evaluation of UX b...
NORDICHI'14 - Carine Lallemand - How Relevant is an Expert Evaluation of UX b...NORDICHI'14 - Carine Lallemand - How Relevant is an Expert Evaluation of UX b...
NORDICHI'14 - Carine Lallemand - How Relevant is an Expert Evaluation of UX b...
 
Hybrid-e-greedy for mobile context-aware recommender system
Hybrid-e-greedy for mobile context-aware recommender systemHybrid-e-greedy for mobile context-aware recommender system
Hybrid-e-greedy for mobile context-aware recommender system
 
The 5th Israeli Conference on Robotics
The 5th Israeli Conference on RoboticsThe 5th Israeli Conference on Robotics
The 5th Israeli Conference on Robotics
 
The 5th Israeli Conference on Robotics - my presentation
The 5th Israeli Conference on Robotics - my presentationThe 5th Israeli Conference on Robotics - my presentation
The 5th Israeli Conference on Robotics - my presentation
 
Tourism Based Hybrid Recommendation System
Tourism Based Hybrid Recommendation SystemTourism Based Hybrid Recommendation System
Tourism Based Hybrid Recommendation System
 
A literature survey on recommendation
A literature survey on recommendationA literature survey on recommendation
A literature survey on recommendation
 
A Literature Survey on Recommendation System Based on Sentimental Analysis
A Literature Survey on Recommendation System Based on Sentimental AnalysisA Literature Survey on Recommendation System Based on Sentimental Analysis
A Literature Survey on Recommendation System Based on Sentimental Analysis
 
Heuristic Evaluation of User Interfaces: Exploration and Evaluation of Niels...
Heuristic Evaluation of User Interfaces:  Exploration and Evaluation of Niels...Heuristic Evaluation of User Interfaces:  Exploration and Evaluation of Niels...
Heuristic Evaluation of User Interfaces: Exploration and Evaluation of Niels...
 
Persuasive Technologies for Sustainable Urban Mobility
Persuasive Technologies for Sustainable Urban MobilityPersuasive Technologies for Sustainable Urban Mobility
Persuasive Technologies for Sustainable Urban Mobility
 

Kürzlich hochgeladen

Daily Lesson Plan in Mathematics Quarter 4
Daily Lesson Plan in Mathematics Quarter 4Daily Lesson Plan in Mathematics Quarter 4
Daily Lesson Plan in Mathematics Quarter 4JOYLYNSAMANIEGO
 
Choosing the Right CBSE School A Comprehensive Guide for Parents
Choosing the Right CBSE School A Comprehensive Guide for ParentsChoosing the Right CBSE School A Comprehensive Guide for Parents
Choosing the Right CBSE School A Comprehensive Guide for Parentsnavabharathschool99
 
INTRODUCTION TO CATHOLIC CHRISTOLOGY.pptx
INTRODUCTION TO CATHOLIC CHRISTOLOGY.pptxINTRODUCTION TO CATHOLIC CHRISTOLOGY.pptx
INTRODUCTION TO CATHOLIC CHRISTOLOGY.pptxHumphrey A Beña
 
How to do quick user assign in kanban in Odoo 17 ERP
How to do quick user assign in kanban in Odoo 17 ERPHow to do quick user assign in kanban in Odoo 17 ERP
How to do quick user assign in kanban in Odoo 17 ERPCeline George
 
ROLES IN A STAGE PRODUCTION in arts.pptx
ROLES IN A STAGE PRODUCTION in arts.pptxROLES IN A STAGE PRODUCTION in arts.pptx
ROLES IN A STAGE PRODUCTION in arts.pptxVanesaIglesias10
 
Grade 9 Quarter 4 Dll Grade 9 Quarter 4 DLL.pdf
Grade 9 Quarter 4 Dll Grade 9 Quarter 4 DLL.pdfGrade 9 Quarter 4 Dll Grade 9 Quarter 4 DLL.pdf
Grade 9 Quarter 4 Dll Grade 9 Quarter 4 DLL.pdfJemuel Francisco
 
Field Attribute Index Feature in Odoo 17
Field Attribute Index Feature in Odoo 17Field Attribute Index Feature in Odoo 17
Field Attribute Index Feature in Odoo 17Celine George
 
Barangay Council for the Protection of Children (BCPC) Orientation.pptx
Barangay Council for the Protection of Children (BCPC) Orientation.pptxBarangay Council for the Protection of Children (BCPC) Orientation.pptx
Barangay Council for the Protection of Children (BCPC) Orientation.pptxCarlos105
 
What is Model Inheritance in Odoo 17 ERP
What is Model Inheritance in Odoo 17 ERPWhat is Model Inheritance in Odoo 17 ERP
What is Model Inheritance in Odoo 17 ERPCeline George
 
AUDIENCE THEORY -CULTIVATION THEORY - GERBNER.pptx
AUDIENCE THEORY -CULTIVATION THEORY -  GERBNER.pptxAUDIENCE THEORY -CULTIVATION THEORY -  GERBNER.pptx
AUDIENCE THEORY -CULTIVATION THEORY - GERBNER.pptxiammrhaywood
 
Activity 2-unit 2-update 2024. English translation
Activity 2-unit 2-update 2024. English translationActivity 2-unit 2-update 2024. English translation
Activity 2-unit 2-update 2024. English translationRosabel UA
 
4.18.24 Movement Legacies, Reflection, and Review.pptx
4.18.24 Movement Legacies, Reflection, and Review.pptx4.18.24 Movement Legacies, Reflection, and Review.pptx
4.18.24 Movement Legacies, Reflection, and Review.pptxmary850239
 
MULTIDISCIPLINRY NATURE OF THE ENVIRONMENTAL STUDIES.pptx
MULTIDISCIPLINRY NATURE OF THE ENVIRONMENTAL STUDIES.pptxMULTIDISCIPLINRY NATURE OF THE ENVIRONMENTAL STUDIES.pptx
MULTIDISCIPLINRY NATURE OF THE ENVIRONMENTAL STUDIES.pptxAnupkumar Sharma
 
Earth Day Presentation wow hello nice great
Earth Day Presentation wow hello nice greatEarth Day Presentation wow hello nice great
Earth Day Presentation wow hello nice greatYousafMalik24
 
Active Learning Strategies (in short ALS).pdf
Active Learning Strategies (in short ALS).pdfActive Learning Strategies (in short ALS).pdf
Active Learning Strategies (in short ALS).pdfPatidar M
 
Music 9 - 4th quarter - Vocal Music of the Romantic Period.pptx
Music 9 - 4th quarter - Vocal Music of the Romantic Period.pptxMusic 9 - 4th quarter - Vocal Music of the Romantic Period.pptx
Music 9 - 4th quarter - Vocal Music of the Romantic Period.pptxleah joy valeriano
 
How to Add Barcode on PDF Report in Odoo 17
How to Add Barcode on PDF Report in Odoo 17How to Add Barcode on PDF Report in Odoo 17
How to Add Barcode on PDF Report in Odoo 17Celine George
 
Virtual-Orientation-on-the-Administration-of-NATG12-NATG6-and-ELLNA.pdf
Virtual-Orientation-on-the-Administration-of-NATG12-NATG6-and-ELLNA.pdfVirtual-Orientation-on-the-Administration-of-NATG12-NATG6-and-ELLNA.pdf
Virtual-Orientation-on-the-Administration-of-NATG12-NATG6-and-ELLNA.pdfErwinPantujan2
 

Kürzlich hochgeladen (20)

Daily Lesson Plan in Mathematics Quarter 4
Daily Lesson Plan in Mathematics Quarter 4Daily Lesson Plan in Mathematics Quarter 4
Daily Lesson Plan in Mathematics Quarter 4
 
Choosing the Right CBSE School A Comprehensive Guide for Parents
Choosing the Right CBSE School A Comprehensive Guide for ParentsChoosing the Right CBSE School A Comprehensive Guide for Parents
Choosing the Right CBSE School A Comprehensive Guide for Parents
 
INTRODUCTION TO CATHOLIC CHRISTOLOGY.pptx
INTRODUCTION TO CATHOLIC CHRISTOLOGY.pptxINTRODUCTION TO CATHOLIC CHRISTOLOGY.pptx
INTRODUCTION TO CATHOLIC CHRISTOLOGY.pptx
 
How to do quick user assign in kanban in Odoo 17 ERP
How to do quick user assign in kanban in Odoo 17 ERPHow to do quick user assign in kanban in Odoo 17 ERP
How to do quick user assign in kanban in Odoo 17 ERP
 
ROLES IN A STAGE PRODUCTION in arts.pptx
ROLES IN A STAGE PRODUCTION in arts.pptxROLES IN A STAGE PRODUCTION in arts.pptx
ROLES IN A STAGE PRODUCTION in arts.pptx
 
Grade 9 Quarter 4 Dll Grade 9 Quarter 4 DLL.pdf
Grade 9 Quarter 4 Dll Grade 9 Quarter 4 DLL.pdfGrade 9 Quarter 4 Dll Grade 9 Quarter 4 DLL.pdf
Grade 9 Quarter 4 Dll Grade 9 Quarter 4 DLL.pdf
 
Field Attribute Index Feature in Odoo 17
Field Attribute Index Feature in Odoo 17Field Attribute Index Feature in Odoo 17
Field Attribute Index Feature in Odoo 17
 
Barangay Council for the Protection of Children (BCPC) Orientation.pptx
Barangay Council for the Protection of Children (BCPC) Orientation.pptxBarangay Council for the Protection of Children (BCPC) Orientation.pptx
Barangay Council for the Protection of Children (BCPC) Orientation.pptx
 
What is Model Inheritance in Odoo 17 ERP
What is Model Inheritance in Odoo 17 ERPWhat is Model Inheritance in Odoo 17 ERP
What is Model Inheritance in Odoo 17 ERP
 
AUDIENCE THEORY -CULTIVATION THEORY - GERBNER.pptx
AUDIENCE THEORY -CULTIVATION THEORY -  GERBNER.pptxAUDIENCE THEORY -CULTIVATION THEORY -  GERBNER.pptx
AUDIENCE THEORY -CULTIVATION THEORY - GERBNER.pptx
 
Activity 2-unit 2-update 2024. English translation
Activity 2-unit 2-update 2024. English translationActivity 2-unit 2-update 2024. English translation
Activity 2-unit 2-update 2024. English translation
 
YOUVE GOT EMAIL_FINALS_EL_DORADO_2024.pptx
YOUVE GOT EMAIL_FINALS_EL_DORADO_2024.pptxYOUVE GOT EMAIL_FINALS_EL_DORADO_2024.pptx
YOUVE GOT EMAIL_FINALS_EL_DORADO_2024.pptx
 
4.18.24 Movement Legacies, Reflection, and Review.pptx
4.18.24 Movement Legacies, Reflection, and Review.pptx4.18.24 Movement Legacies, Reflection, and Review.pptx
4.18.24 Movement Legacies, Reflection, and Review.pptx
 
MULTIDISCIPLINRY NATURE OF THE ENVIRONMENTAL STUDIES.pptx
MULTIDISCIPLINRY NATURE OF THE ENVIRONMENTAL STUDIES.pptxMULTIDISCIPLINRY NATURE OF THE ENVIRONMENTAL STUDIES.pptx
MULTIDISCIPLINRY NATURE OF THE ENVIRONMENTAL STUDIES.pptx
 
Earth Day Presentation wow hello nice great
Earth Day Presentation wow hello nice greatEarth Day Presentation wow hello nice great
Earth Day Presentation wow hello nice great
 
Active Learning Strategies (in short ALS).pdf
Active Learning Strategies (in short ALS).pdfActive Learning Strategies (in short ALS).pdf
Active Learning Strategies (in short ALS).pdf
 
YOUVE_GOT_EMAIL_PRELIMS_EL_DORADO_2024.pptx
YOUVE_GOT_EMAIL_PRELIMS_EL_DORADO_2024.pptxYOUVE_GOT_EMAIL_PRELIMS_EL_DORADO_2024.pptx
YOUVE_GOT_EMAIL_PRELIMS_EL_DORADO_2024.pptx
 
Music 9 - 4th quarter - Vocal Music of the Romantic Period.pptx
Music 9 - 4th quarter - Vocal Music of the Romantic Period.pptxMusic 9 - 4th quarter - Vocal Music of the Romantic Period.pptx
Music 9 - 4th quarter - Vocal Music of the Romantic Period.pptx
 
How to Add Barcode on PDF Report in Odoo 17
How to Add Barcode on PDF Report in Odoo 17How to Add Barcode on PDF Report in Odoo 17
How to Add Barcode on PDF Report in Odoo 17
 
Virtual-Orientation-on-the-Administration-of-NATG12-NATG6-and-ELLNA.pdf
Virtual-Orientation-on-the-Administration-of-NATG12-NATG6-and-ELLNA.pdfVirtual-Orientation-on-the-Administration-of-NATG12-NATG6-and-ELLNA.pdf
Virtual-Orientation-on-the-Administration-of-NATG12-NATG6-and-ELLNA.pdf
 

Experimental Usability Test for Travel Recommender Systems

  • 1. An Experimental Usability Test for different Destination Recommender Systems Andreas H. Zins a, Ulrike Bauernfeind a, Fabio Del Missierb, Adriano ‚Venturinib and Hildegard Rumetshoferc a Institute for Tourism and Leisure Studies Vienna University of Economics and Business Administration, Austria {zins, bauernfeind}@wu-wien.ac.at b ITC- irst Electronic Commerce and Tourism Research Laboratory, Italy {delmissier, venturi}@itc.it c Institute for Applied Knowledge Processing University of Linz, Austria hildegard.rumetshofer@faw.uni- linz.ac.at Abstract The present paper outlines the experimental evaluation of travel recommendation systems. First, theoretical concepts concentrating on the influencing factors for human-computer interaction, system usage and satisfaction are reviewed. An introduction of various methods dealing with usability evaluation is given and an overview of different “standard” survey instruments is provided. Second, a case study, the assessment of a travel recommender system currently under development, is presented. The evaluation considers aspects such as design and layout, functionality or ease of use. These measures obtained by a user questionnaire are combined with user interaction logging data. Different variants of the travel recommendation system and a baseline system were used for the assessment. This promising approach complements subjective ratings by objective tracking data to obtain a more thorough picture of the system’s weaknesses. Finally, findings are presented and an explanatory model for user/system satisfaction is proposed.
  • 2. Keywords: travel recommendation system; usability testing; human-computer interaction (HCI); user interface questionnaire; subjective vs. objective rating. 1 Introduction As the amount of information in the field of tourism becomes abundant, finding the desired information is increasingly difficult. Therefore, recommender systems became a significant tool in the travel industry; they offer users a convenient opportunity to find a travel bundle or a single travel item such as accommodation. The development of a recommendation system is a time and cost-intensive issue and a lot of usability questions arise. Users will reject systems that do not meet their needs or provide insufficient functionalities. Before its implementation, an assessment is a prerequisite to discover strengths and weaknesses and to be able to provide the best system version possible. Thus, the primary goal of this contribution is to illustrate how the prototype of a recommendation system can be evaluated. Which concepts can be found in the literature explaining human computer interaction and which methods exist and are used to evaluate usability? 2 Theoretical considerations An overview of theories, which concentrate on human computer-interaction (HCI) and computer-mediated environments (CMEs), will be given. The aim is to illustrate the factors, which mostly influence the usage of a system. The Technology Acceptance Model (TAM; Davis 1989) relies on two factors explaining human behaviour: perceived usefulness and perceived ease of use. Perceived usefulness describes the user’s point of view of enhancing his/her performance by using the system. Perceived ease of use is the degree of effort the user believes he or she will need for using a particular system. There are numerous contributions extending the TAM by additional factors such as playfulness, attitude (Moon and Kim 2001), trust and risk (Pavlou 2001) or accessibility and attitude (Jeong and Lambert 2001). Another approach differing from the TAM is the Concept of Flow (Novak, Hoffman and Yung 2000) including the factors skill and control, challenge and arousal, focused attention, telepresence, and time distortion. These factors contribute to flow, a state of mind where the user is completely devoted to the use of a system and forgets everything else around him, like time. Thus, the aim is to create a compelling online experience to facilitate flow. Another theoretical area relevant for this contribution is usability testing and system evaluation. According to ISO 9241-11 (1998) usability is “the extent to which a product can be used by specified users to achieve specified goals with effectiveness,
  • 3. efficiency and satisfaction”. Lindgaard (1994) described usability as the ease of learning and using computer systems from the experienced and unexperienced user’s point of view. Classifications of usability evaluation methods differ from author to author. According to Riihiaho (2000) usability evaluation can be divided into two broad categories: user testing and usability inspection. User testing involves usability testing, pluralistic, informal, visual walkthroughs and contextual inquiry. Usability inspection comprises heuristic evaluation, cognitive walkthrough and GOMS (goals, operators, methods, and selection rules). Harms and Schweibenz (2000) distinguish two methods: the heuristic evaluation and usability testing. But different contributions have a common definition of usability testing: persons performing a given task and evaluating the system. Empirical testing with potential users is the best way to find problems related to users’ tasks and experiences (Riihiaho 2000). A common way is to ask a set of participants to accomplish a realistic task and performance measures are collected (Galitz 2002). Usability can be gauged by objective and subjective variables. Objective measures include for instance the task completion time, the number of queries, or the error rate. Subjective measures, i.e. user’s feedback, are often collected by questionnaires. For this purpose, some standard questionnaires were created. Several of these survey instruments were suggested by IBM (Lewis 1995): the Post-Study System Usability Questionnaire (PSSUQ), the Computer System Usability Questionnaire (CSUQ) or the After-Scenario Questionnaire (ASQ). There are other examples as well: the Questionnaire for User Interface Satisfaction (QUIS) developed by Chin, Diehl and Norman (1988), the System Usability Scale (SUS) (http://www.usability.serco.com/trump/documents/Suschapt.doc) or the Website Analysis and Measurement Inventory (http://www.ucc.ie/hfrg/questionnaires/wammi). 3 Research objectives and applied methodology The approach of the experimental evaluation described here consists of building some variants of the recommendation prototype (named DieToRecs) and of testing some hypotheses about the performance of each variant on a set of dependent measures involving a reference or baseline system (in this case the TISCover system). The variants to be tested are: o DTR-A: interactive query management only (i.e. empty case base and no recommendation support via smart sorting or through other means); o DTR-B: single item recommendation with interactive query management and ranking based on a representative case base; o DTR-C: this variant allows a user to navigate among complete travel recommendations in a simple and effective way (starting from the link “Seeking for inspiration”). Six travel examples are shown at each page.
  • 4. Then the user is requested to provide a feedback on the presented examples in a simple form (“I like this” vs. “I do not like this”). Finally, the system updates the proposed examples by means of the feedback provided by the user, and the similarity-based retrieval in the case base is performed again. The main hypotheses will concern the users’ search and choice behaviour, and their satisfaction: H1: The recommendation-enhanced system is able to deliver useful recommendations This hypothesis can be tested by analyzing the differences between the DieToRecs variants DTR-A vs. DTR-B on the relative position of the item within the result list which the user selected and added to the travel plan. Only if the recommendation is good the user will immediately find a suitable item. The position for DTR-B should be nearer to the top of the visualized result list. H2: The recommendation-enhanced system is able to facilitate the construction of good travel plans This hypothesis can be tested by analyzing the differences between the three systems (the DieToRecs variants and TISCover) on the users’ ratings of the selected items. We should find a significant difference between the two DieToRecs variants (DTR-A will get a lower mean satisfaction rating than DTR-B). Nonetheless, DTR-A will not receive very low ratings, due to the availability of the interactive query management functions, which will help the plan construction. For different reasons, both TISCover and the recommendation-enhanced variant should support the construction of satisfying plans. TISCover can exploit its grounding on a rich item database and its degree of development and testing and DTR-B should benefit from its effective recommendation functions. H3: The recommendation-enhanced system allows a more efficient search The recommendation-enhanced system should enable the user to perform fewer queries, to examine fewer pages and to reduce the search and decision time. The variant with the empty case base will be less efficient, due to the lack of smart sorting in the presentation of options. Therefore, the user will have to browse a greater number of result pages, and occasionally will have to reformulate the query. The TISCover system should obtain an intermediate result (because of the lack of intelligent support, but its grounding on a rich item database). H4: The recommendation-enhanced system heightens the user satisfaction Given that user satisfaction is related both to the perception of the efficiency and effectiveness of the system, we expect to find significant differences between DTR-B and DTR-A on the questionnaire measures which are associated with efficiency, effectiveness, and overall satisfaction. TISCover should get good ratings due to its degree of development and testing that will prevent the user to be faced with salient system failures or errors (strongly affecting user satisfaction). Furthermore, there will be some differences in the products accessed by TISCover and DieToRecs (some
  • 5. features could be missing in the information accessed by the DieToRecs variants), and this should be appropriately taken into account in the interpretation and evaluation of the results. Different participants from a student population, randomly assigned to the experimental groups, were asked to use both one DieToRecs variant and a so-called baseline system (see Table 1). In our case, the baseline system is the TISCover.com on-line travel agency web site. The DieToRecs recommender system and its variants are fed by a substantial subset of the travel items represented in the TISCover system. An additional small number of participants will be assigned to a full functionality design (corresponding to a variant recommending complete travel arrangements called DTR-C), to obtain some exploratory indications on the user’s interaction with a system resembling the final development of the DieToRecs project. The users were asked to perform some tasks in the general context of “planning a travel in Tyrol”. A series of objective and subjective measures were recorded, both automatically during the interaction (by means of the logging component; DTR-variants only) and by asking the user to fill a questionnaire after each test session. To gain external validity it is necessary to design tasks that are representative of the typical usage of the system in the real world. So, putting too many constraints on the participants should be avoided (the users will typically be unconstrained). On the other hand, it was attempted to obtain a representative set of search and interaction behaviours, trying to reduce the variability due to the initial exploratory and erratic navigation behaviors. The choice in favour of one training and one separate test tasks is motivated by the objective to balance the representativeness concern and the need to limit the duration of the experimental session (in order to avoid fatigue effects and unwanted variations in attention and motivation). The participants were requested to choose a different geographical area for the execution of the two test tasks, thus trying to avoid content- specific learning. Table 1. Experimental Design Sequence Group 1 Group 2 Group 3 Group 4 Group 5 Group 6 First System TISCover DTR-A TISCover DTR-B TISCover DTR-C Second DTR-A TISCover DTR-B TISCover DTR-C TISCover System N = 47 10 11 10 10 2 4 Besides some socio-demographic and internet usage characteristics the questionnaire focused on the process and outcome evaluation of the trip planning task. After having screened a list of potential standardized measurement instruments devised to capture some aspects of usability criteria the Post-Study-Satisfaction-User-Questionnaire (PSSUQ with 19 statements, Lewis 1995) was chosen, slightly adapted to a non- technical wording and extended by typical aspects relevant for recommendation systems (resulting in 23 statements in total).
  • 6. Table 2. Usability and User Satisfaction Questionnaire (adapted from PSSUQ) Effectivness Satisfaction Ease-of-use Reliability PSSUQ Items Design / Layout I liked using the interface of the system. o x The organization of information presented by the system was clear. c x The interface of this system was p leasant to use. c x Functionality This system has all the functions and capabilities that I expect it to have. o x The information retrieved by the system was effective in helping me to c x complete the tasks. The products listed by the system as a reply to my request were suitable for n x my travel. I found the “recommend (the whole) travel” function useful. n Ease of Use It was simple to use this system. o x It was easy to find the information I needed. o x The information (such as online-help, on-screen messages, and other o x documentation) provided with this system was clear. Overall, this system was easy to use. c x Learnability It was easy to learn to use the system. o x There was too much information to read before I can use the system. n The information provided by the system was easy to understand. c x Satisfaction I felt comfortable using this system. o x I enjoyed constructing my travel plans through this system. n x Overall, I am satisfied with this system. o x Outcome / Future Use I was able to complete the task quickly using this system. c x I could not complete the task in the preset time frame. n x I believe I could become productive quickly using this system. o x The system was able to convince me that the recommendations are of value. n x From my current experience with using the system, I think I would use it n x regularly. Errors / System Reliability Whenever I made a mistake using the system, I could recover easily and o x quickly. The system gave error messages that clearly told me how to fix problems. o x Note: “o”: unchanged items, “c”: changed wording, “n”: new items added; “x”: highly loading variables (one variable without “x” was an outlier and did not load on any of the factors).
  • 7. Though the psychometric properties have been documented by Lewis (1995) the structure (system usefulness, information quality, and interface quality) and content (e.g. satisfaction aspects mixed with functional qualities) of this instrument had to be treated with caution. Table 2 shows the final questionnaire used. Furthermore, the respective statements are classified according to the factor on which they loaded highly. 4 Results The following analysis investigates the hypotheses 1 to 4 step by step. It is based on a sample of 47 test persons with a share of 63% females. One quarter belongs to an age group older than 25, the majority is under 25 years. Usage of web and e-commerce services was measured by some questions of the 10th GVU’s User Survey (www.gvu.gatech.edu/user_surveys) adapted to our context and some new questions. General internet usage was rather high with a share of 62% using the Web between 4 to 6 years. No participant showed an experience less than one year. The students’ population was well captured by a 72% share of test persons using the internet daily. 20% indicated to use the internet several times a week. Almost everybody (96%) used the internet for information retrieval. About 75% bought some product or service at least once a year over the internet. With regard to the travel domain the usage rates are comparable: 98% used this source for some information; almost 80% purchased some travel specific product on the internet at least once a year. Only one third of the test persons revealed to be unfamiliar with Tyrol. Only 4% had never been to Tyrol; a share of 20% visited Tyrol at least once. In a first attempt the usefulness of the different recommendation functions implemented in the three DieToRecs variants has to be tested. The logging data – available only for the DieToRecs system – delivered the average position of each item in the presented result list of queries. Those items selected and put into the travel plan are taken here to compare the relative position (cf. Table 3; DTR-C does not provide single item result lists as it recommends in the initial step complete travel plans only). The differences between DTR-A and DTR-B are substantial and appear for all item categories. This can be interpreted as a sign of consistency though the sample size does not suffice to deliver statistically significant results (à H1 accepted without statistical proof). Table 3. Average Position and Standard Deviation for Items in the Result List by DieToRecs Variants DTR-A DTR-B t-test Average Std.Dev. Average Std.Dev. Items in general 4.3 4.6 2.9 2.8 not sign. Accommodation items 5.0 0.4 2.2 1.2 not sign. Destination items 3.9 0.1 2.5 1.3 not sign. Interest items 4.0 4.8 3.5 3.0 not sign.
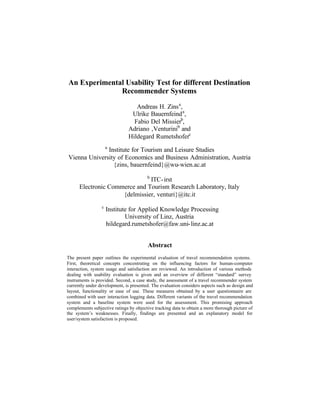
  • 8. Next, an explanatory model for explaining user satisfaction with a typical structure as outlined in Figure 1 was the starting point for the investigation of evaluative dimensions. The original three-dimensional configuration (PSSUQ, Lewis 1995) could not be identified with the empirical data of this study. Instead, the following three dimensions turned out to represent a very consistent way of how the respondents evaluated the baseline and experimental recommendation systems: ease-of use combined with design aspects and learnability; outcome combined with functionality and effectiveness; and reliability strongly related with error handling (Figure 1; Cronbachs Alpha coefficients below, for loading indicators cf. Table 2). Ease-of-use/ Learnability Alpha=0.94 DTR: 0.30 TIS: 0.37 Effectiveness/ User/System DTR: 0.73 Outcome TIS: 0.61 Satisfaction Alpha=0.83 Alpha=0.95 DTR: n.s. TIS: n.s. Reliability Alpha=0.78 Fig. 1. Explanatory Model for User/System Satisfaction Testing the criterion validity by applying linear regression analyses – separately for the two systems evaluated by each respondent – on the dependent satisfaction dimension very similar structural effects were detected (cf. Figure 1). Both models explained a high proportion of the satisfaction variance (DTR-R²: 0.94; TIS-R²: 0.87). The standardized regression coefficients do not differ substantially. Finally, the reliability dimension does not contribute directly to the process and outcome evaluation in terms of user satisfaction ratings. From the point of view of content validity this configuration seems to converge towards the widely acknowledged Technology Acceptance Model (Davis 1989; Lederer et al. 2000) which proposes two factors for explaining system usage: perceived usefulness and perceived ease-of-use. Based on these validity checks the detailed analysis of the interaction patterns, coupled with the experimental results, can follow to test the next hypotheses. An objective picture of the system effectiveness and efficiency, and of the user-
  • 9. recommender interaction quality should be derived. Overall, the average evaluation scales show evidence of a solid superiority for our baseline system TISCover in each of the dimensions. This result was already expected and explained within the hypotheses 2 and 4 (see above) and is obviously due to the mature developmental stage and the huge and detailed data available. Another indicator of this performance difference can be derived from the subjective declaration whether the planning task could have been accomplished successfully or not: DieToRecs achieved a 30% ratio; TISCover 64%. In terms of differences of the item ratings between the DieToRecs variants the next Table exhibits a clear and confirming picture. The more intelligent recommendation functions were in operation the better the satisfaction ratings are. Overall, relatively more respondents achieved to finish their plans during the given time frame successfully. For the destination recommendations the DTR-C variant holds a significant better position compared to that of the modest DTR-A variant. The differences of the accommodation ratings are even more distinct: The DTR-C variant works better than DTR-A and DTR-B. For the activities the result is even more precise as all pair wise differences show the expected direction and significance level (à H2 confirmed). Table 4. Satisfaction Ratings for Travel Plan Elements by DieToRecs Variants Travel Plan Element System Variants Average DTR-A DTR-B DTR-C p-value Finished plans 30% 10% 30% 100% 0.001 Ratings Destination 4.0 2.8 4.5 5.3 0.10 significant A-C 0.10 Accommodation 4.1 4.1 3.6 5.9 0.15 significant B-C 0.01 significant A-C 0.05 Activities 4.2 3.2 4.9 7.0 0.05 significant A-B 0.1 significant B-C 0.01 significant A-C 0.001 Note: “1”: very dissatisfied, “7”: very satisfied As outlined in hypotheses 3 the objective measures of system evaluation are necessary for further testing. They were derived from the user logging component exhibited by Table 5. In general, there is a lack of power due to the small sample size. Considering the different success rates in terms of finished travel plans (see Table 4) the irrelevant differences in the number of queries and page visits turn into some more encouraging findings (à H3 confirmed). Session time has to be taken with caution because the experimental process strictly limited the granted time for the travel plan
  • 10. assembly. Nevertheless, the improved recommendation functions help to reduce the necessary planning time. From the number of query refinement options applied we can learn that in most of the cases the result lists were too short (and maybe more often empty) than too long. No apparent differences can be detected. Table 5. Objective Efficiency Measures by DieToRecs Variants System Variants DTR-A DTR-B DTR-C p-value Total number of queries 12.9 13.3 9.5 n.s. Accommodation queries 5.5 6.5 4.0 n.s. Destination queries 4.3 2.1 2.3 n.s. Interest queries 3.1 4.6 1.8 n.s. Number of pages visited 20.2 18.8 8.8 n.s. Number of query relaxations applied 5.8 4.6 4.0 n.s. Number of query tightening applied 0.6 0.2 0 n.s. Session time in minutes 25 20 23 > 0.1 Note: n.s. = not significant In order to test the final hypotheses 4, the variation of the evaluation scores (see Table 6) was decomposed with respect to the within-subject (i.e. sequence order) and the between-subject (i.e. variant comparison) effects. In general, a significant order or sequence effect could be detected which affected each dimension except reliability. As initially assumed a learning effect appeared which favoured the ratings for the second trip planning task. On average, this learning effect was much more pronounced in the situation in which the baseline system was used and evaluated in second place. The effect size was rather similar for the system satisfaction scale; whereas for the ease-of-use scale it was more than double and for the outcome scale even more than eight times as large. Table 6. Average Ratings and Differences on the Evaluation Dimensions by System Variants TISCover DieToRecs DTR-A – DTR-B – DTR-C – Ø Ø TISCover TISCover TISCover User Satisfaction 3.2 4.6 2.33 1.05*) -0.50*) Ease-of-use 2.8 3.6 1.34 0.45*) 0.31*) Effectiveness/Outcome 3.4 4.6 1.71 1.01 -0.50*) Reliability 3.5 3.7 0.60*) 0.05*) -0.22*) Note: “1”: strongly agree, “7”: strongly disagree; *) not significant Considering the sequence effect simultaneously with the between-subject effect of comparing different system variants (only DTR-A and DTR-B due to the small sample size) a considerable scale difference remains for each scale (ease-of-use: 0.43
  • 11. [p = 0.39]; outcome: 0.32 [p = 0.47]; reliability: 0.60 [p = 0.26]; satisfaction: 0.70 [p = 0.2]). Comparing the ratings – without order effect – only for respondents testing the DTR-C variant the differences even turn into the other – expected – direction. Each scale except ease-of-use exhibit better average scores for the DieToRecs system (cf. Table 6). Hence, in principle hypothesis 4 cannot be corroborated entirely, though taking the small sample size into account the results show the expected direction. 5 Conclusions An experimental evaluation of a travel recommendation system applying objective and subjective measures was accomplished. The travel recommendation system prototype DieToRecs and a reference or baseline system TISCover were tested and evaluated by users with the basic goal to discover weaknesses and to be able to remove them in the further development process. Although the assessment results for the baseline system were significantly better than for DieToRecs, the higher satisfaction ratings for the DieToRecs variant with more recommendation functions confirm the appropriate direction. A certain familiarisation effect for the TISCover system cannot be completely denied. The user sample employed for this assessment was very likely to know the system and might have used it before. For the purpose of testing DieToRecs a subset of TISCovers’ travel items was fed into the database. Of course, TISCover as a full functioning travel recommendation system disposes of a greater variety of travel items than the DieToRecs subset. Nevertheless, it can be assumed that these differences of scope are minor compared to a system comparison which would be based on completely different databases. Hence, the outcome evaluation relies much more on process differences than on those of content. As far as the survey instrument (adapted from PSSUQ) and the explanatory model for user system satisfaction is concerned, the three-dimensions (i.e. system usefulness, information quality and interface quality) explaining user/system satisfaction proposed by Lewis (1995) were not confirmed. Instead, a three factor solution for explaining overall system satisfaction could be ascertained. These factors were labelled with ease-of-use/learnability, effectiveness/outcome and reliability. Finally, the approach used in this study to generate empirical data is a promising one since the combination of objective and subjective measures enables the assessment from a twofold point of view: the satisfaction ratings delivered by the user and the interaction data showing the users’ search and selection behaviour. Acknowledgement This work has been partially funded by the European Union's Fifth RTD Framework Programme (under contract DIETORECS IST-2000-29474). The authors would like to thank all other colleagues of the DieToRecs team for their valuable contribution to this study.
  • 12. References Chin, J.P., Diehl, V.A. & K. Norman (1988). Development of an instrument measuring user satisfaction of the human-computer interface. Proceedings of CHI’88 Conference on Human Factors in Computing Systems, Washington, DC. Davis, F.D. (1989). Perceived usefulness, perceived ease of use, and user acceptance of information technology. MIS Quarterly 13(3): 319-340. Galitz, W.O. (2002). The essential guide to user interface design. New York: Wiley Computer Publishing. ISO (1998). ISO 9241 – 11. Usability Definitions - Guidance on Usability. Geneva, Switzerland. International Standards Organisation. (http://www.usability.serco.com/trump /resources/standards.htm [August 29, 2003]). Harms, I. & W. Schweibenz (2000). Testing Web Usability. Information Management & Consulting 15(3): 61-66. Jeong, M. & C.U. Lambert (2001). Adaptation of an Information Quality Framework to Measure Customers’ Behavioral Intentions to Use Lodging Web Sites. Hospitality Management 20: 129-146. Lederer, A.L., D.J. Maupin, M.P. Sena, & Y. Zhuang (2000). The technology acceptance model and the World Wide Web. Decision Support Systems 29(3): 269-282. Lewis, J.R. (1995). IBM computer usability satisfaction questionnaires: psychometric evaluation and instructions for use. International Journal of Human Computer Interaction 7(1): 57-78. Lindgaard, G. (1994). Usability Testing and System Evaluation. A Guide for Designing Useful Computer Systems. London: Chapman & Hall. Moon, J.-W. & Y.-G. Kim (2001) Extending the TAM for a World-Wide Context. Information & Management 38: 217-230. Novak, T.P., Hoffman, D.L. & Y.-F. Yung (2000). Measuring the Customer Experience in Online Environments: A Structural Modeling Approach. Marketing Science 19(1): 22-42. Pavlou, P.A. (2003). Consumer Acceptance of Electronic Commerce – Integrating Trust and Risk with the Technology Acceptance Model. International Journal of Electronic Commerce 7(3): 69-103. Riihiaho, S. (2000). Experiences with Usability Evaluation Methods. Thesis at the Helsinki University of Technology, Laboratory of Information Processing Science.