SlideShare ist ein Scribd-Unternehmen logo
1 von 20
Downloaden Sie, um offline zu lesen
Energy Efficiency in
Wastewater Facilities
Prepared by
Tongyan Li
Treated Source
Water Treatment
100-16,000kWh/MG
Treated Wastewater
Wastewater Collection
& Treatment
Water End Use
Conveyance
0-14,000kWh/MG
Distribution
700-1,200Wh/MG
Treated wastewater discharge
Energy Opportunities
• Use efficient pumping systems (pumps,
motors, variable frequency drives)
• Capture energy from water moving
downhill
• Store water to avoid pumping at times of
peak energy cost
Energy Opportunities
• Install SCADA software
• Use efficient pumping systems
• Install efficient disinfection equipment
• Implement lighting
• HAVC improvements
Energy Opportunities
• Use efficient pumping systems
• Reduce distribution leaks
• Implement automatic meter reading
Energy Opportunities
• Improve efficiency of aeration
equipment and anaerobic digestion
• Implement cogeneration and other
onsite renewable power options
• Implement lighting, HVAC
improvements
• Fix leaks
• Install SCADA software
• Use efficient pumping systems
• Recycle water
Energy Opportunities
• Use efficient pumping systems
• Capture energy from water moving
downhill
Figure 1 Energy Intensity of Each Stage in the Water Cycle [1]
WHY DOES ENERGY EFFCIENCY MATTER FOR WASTEWATER TREATMENT FACILITIES?
Water and wastewater systems are significant energy consumers with an estimated
3%-4% of total U.S. electricity consumption used for the movement and treatment
of water and wastewater [2].
A secondary treatment plant may use as much as 1500 to 1700 kilowatt hours
(kWh) of electricity to treat one million gallons of sewage and manage the
resulting sludge and residuals [3].
Electricity is a critical input for delivering municipal water and wastewater
services. Electricity costs are usually between 5 to 30 percent of total
operating costs among water and wastewater utilities (WWUs) worldwide [4].
The Oregon Department of Energy reports that a city’s electrical power cost for
wastewater treatment can consume 25 percent or more of the entire city’s
electrical bill. Nationwide, that’s more than $4 billion annually [5].
Figure 2 Process flow diagram of a typical wastewater treatment plant
1.65%
8.67%
1.23%
19.24%
0.48%68.73%
Tertiary treatment
Sludge treatment
Lighting and other
Pretreatment
Primary treatment
Secondary treatment
Figure 3 Energy consumption in different processes [6]
Secondary Treatment
Microorganisms break down organic material, such as sugar s, fats, and proteins,
that were not removed in the primary sedimentation process. This process
reduces the majority of BOD5 and suspended solids
Pretreatment
Remove coarse materials such as paper, rocks, plastic, and rags
Tertiary Treatment
Biological treatment for nitrogen or phosphorus removal, chemical precipitation
for phosphorus or metals removal, air stripping for ammonia removal
Disinfection
Remove the remaining pathogens and bacteria
Primary Treatment
The remaining settleable and floatble materials are removed during primary
sedimentation
0
50
100
150
200
250
300
Trickling Filter Activated Sludge Physical Chemical Other
Trickling Filter
Activated Sludge
Physical Chemical
Other
Figure 4 Number of treatment plants in New York State
that use various forms of secondary wastewater treatment [3]
Activated sludge
Trickling filter
Non-electric secondary filtration
CONVENTIONAL SECONDARY TREATMENT PROCESSES
Oxidation ponds
Wastewater Plants Energy Consumption
Figure 5 Typical wastewater treatment energy use distribution [1]
Sewage aeration at an activated sludge
WWTP accounts for about 30 to 80 percent of
the total plant electricity demand.
At the Fort Collins, Colorado, wastewater treatment facility. In 2012,
the facility upgraded the controls on its blower system, installing an
automated control system with much better turndown capabilities
and a blow-off valve to improve system performance. Along with
other blower upgrades, the improved controls helped reduce
energy consumption from the aeration system by about 30 percent.
Figure 6 Typical blower efficiencies
Turndown capability is an indication of the blower’s ability to meet a range of airflow requirements
Aeration
 Aeration electric demand and energy consumption could be reduced by using fine-pore diffused-air systems and aeration process
controls, or lowering the sludge age.
A cross section of a typical coarse-bubble aeration
tank at an activated sludge treatment plant
A cross section of a typical fine-bubble aeration
tank at an activated sludge treatment plant
Aeration systems consist of blowers and diffusers are the most significant consumers of energy in a wastewater treatment system
 Installing variable-speed drives for blowers
and matching the blower output with air
requirements can reduce energy use
 Fine bubble diffusers coupled with variable flow compressors and energy efficient motors can reduce aeration energy consumption by 50%
The Jackson, Wy., wastewater treatment plant replaced its 75 and 40 hp
aerator mixers with 50 and 25 hp models, and replaced the 250 hp fixed
speed blower with a high efficiency 150 hp variable speed blower. This has
reduced the annual demand of 5.9 million kWh by about 1.95 million kWh
and saved the plant around $85,000 a year.
Understanding Energy Use in Wastewater Treatment Facilities
Size Category Energy Use kWh/ML (kWh/MG)
<4MLD (<1MGD) 990 (3,749)
4-19MLD (1-5MGD) 403 (1,527)
19-76MLD (5-20 MGD) 394 (1,490)
76-284MLD (20-75MGD) 413 (1,562)
>284MLD (>75MGD) 282 (1,067)
Table 1 Comparison of Energy Use for Wastewater Treatment
Magnitude of energy use and demand in different facilities
Daily and seasonal load patterns/Facility size
The role of energy-intensive equipment in the wastewater
treatment process
Type of processing
Efficiency levels of the equipment
Dependence of energy use on the quality of the waste
stream (the level of treatment required to meet
regulations, the treatment technologies used)
Figure 7 Municipal Wastewater Treatment Facility Load Pattern
According to EPA’s ENERGY STAR program, municipalities can
reduce energy costs for water and wastewater treatment by as
much as 10 percent through cost-effective changes to their
operations [7].
CASE STUDY: NYSEDA municipal wastewater treatment plant energy evaluation
Town of Tonawanda wastewater treatment plant
NYSERDA: New York State Energy Research and Development Authority
Figure 8 Electrical demand and usage
Power metering was installed at each
plant to accurately determine the
energy consumption and savings of the
evaluated processes. Through the use of
submetering data and a thorough
understaning of wastewater treatment
processes, many opportunities to
reduce plant energy costs while
maintaining or increasing treatment
and/or capacity were identified
Figure 9 Total plant hourly kW draw
Figure 10 Change in usage
NYSERDA Energy Saving Measures
Capital Improvements
 Replacement of existing sludge stabilization and dewatering facilities
 Modification or replacement of UNOX mixers with more efficient mixing equipment
 Replacement of existing cryogenic oxygen generation system with vacuum-assisted
pressure swing adsorption technology
 High pressure service water pump modifications
 Replacement of constant speed standard efficiency motors with premium efficiency
motors
Operation modifications
 Operational modifications to reduce energy usage and cost
Lighting/HVAC modifications
GE Energy-Neutral Wastewater Treatment
Replace conventional aeration process with ZeeLung Membrane Aerated Biofilm Reactor (MABR) [8]
Four times more energy
efficient than the
conventional fine-bubble
aeration systems many
municipalities are
currently using
ZeeLung MABR Features
 Simple
 Low Energy
 Nutrient Removal
 Small Footprint
The Metropolitan Water Reclamation District of
Greater Chicago began a demonstration project to
evaluate GE’s new ZeeLung MABR technology to
increase the removal of nutrients in the existing
plant footprint and reduce the energy required for
biological aeration by 40%
U.S. EPA offers energy-efficient equipment, technology and operating
strategies
Step 1:
BENCHMARK
your energy use
Step 2: Perform
an energy AUDIT
Step 3: IMPLEMENT
audit
recommendations
Step 4: Share your
sucesses and REPEAT,
for continuous
improvement
Equipment and Collection System Upgrades
 Install Variable-Frequency Drives
 Upgrade to Energy Efficient Motors and Motor Systems
 Heating, Cooling, Ventilation System Upgrades
 Bright Lights Bring Energy Savings
Operating Strategies
 Managing your electrical load
 Biosolids management
 Operation and maintenance
 Inflow and infiltration control
Energy Efficient Technology
 Cogeneration or combined heat and power
 Cogeneration using landfill gas
Renewable Energy
 In conduit hydro-power
 Solar power
 Wind power
Source: https://www3.epa.gov/region9/waterinfrastructure/technology.html
The city of Pacifica, California, recently began operating
1,800 solar panels to supply a portion of the Calera Creek
Water Recycling Plant’s electric needs. The solar panels
provide 10 to 15 percent of the treatment plant’s energy
needs. The facility estimates $100,000 per year in energy
savings
California Energy Commission
A multitude of energy efficient equipment, technologies and operating
strategies are available to help take a bite out of the energy costs in water
and wastewater facilities.
• Variable frequency drives
• Energy-Efficient Motors
• Heating, Cooling, Ventilation Improvements
• Lighting Improvements
• Electrical Load Management Strategies
• Cogeneration Optimization
• Fuel Cells
California water and wastewater agencies spend more than $500 million each year on energy costs
Source: http://www.energy.ca.gov/process/water/wastewater_treatment.html
The role of big data in wastewater treatment plants
SCADA systems
Retrieve
information on
plant operation
and other
systems
Predicting pipe failure
Predictive weather data
Managing water costs
Energy management
Measuring asset condition
Energy monitoring can be used to help
understand and quickly intervene when energy
consumption at plant or component level
increases. Data analytics can then be used to
prevent efficiency excursions before they happen
and to identify further reductions by a change of
operation or equipment. Many water companies
have extensive energy data at plant level, but
rarely at component level, but this is improving.
The water and wastewater industry is currently in transition from business-as-usual operations, employing
traditional engineering solutions, to a new approach – Smarter Water Management – which uses big data and
advanced analytics to create new insights that can improve operational efficiencies.
IBM Research, working in partnership with a
European wastewater utility, developed an
end-to-end water resource recovery plant
optimization that can save as much as 15
percent or more of costs associated with
energy consumption, biosolids handling, and
chemical usage. Using a big data approach
that integrates dynamic plant simulation
forecasting and mathematical optimization,
activated sludge treatment processes can be
significantly improved in the areas of
resources recovery, cost efficiency, and
regulatory compliance.
Programs
Federal programs
ENERGY STAR Water and Wastewater
ENERGY STAR Green Buildings and Energy Efficiency
U.S. EPA Office of Water, Energy Efficiency for Water and Wastewater Utilities
U.S. EPA Combined Heat and Power (CHP) Partnership
U.S. EPA Green Power Partnership
U.S. EPA Wastewater Management Website
U.S. EPA WaterSense Program
U.S. EPA State and Local Climate and Energy Program
Useful Resources
EPA’s Energy Use Assessment Tool is a free, downloadable, Excel‐based energy audit tool.
The tool allows both water and wastewater systems to conduct a utility bill analysis, determine baseline energy
consumption and cost in total and also broken down to the process‐level and equipment‐level, and identify the
most energy‐intensive areas of the system. In addition, the tool highlights areas of inefficiency that users may
find useful in identifying and prioritizing ECMs.
The tool can be found at: http://water.epa.gov/infrastructure/sustain/energy_use.cfm.
EPA’s EnergyStar Portfolio Manager is a free, online tool drinking water systems can use to develop a simple
energy baseline based on utility bill data and track changes in energy use and GHG emissions over time.
The tool can be found at:
http://www.energystar.gov/index.cfm?c=evaluate_performance.bus_portfoliomanager.
Understanding Your Electric Bill is a Wisconsin Focus on Energy Fact Sheet that can be found at:
http://water.epa.gov/infrastruture/sustain/Understanding‐Your‐Electirc‐Bill.pdf
Electric Power Research Institute (EPRI) Energy Audit Manual for Water /Wastewater Facilities can be found at:
http://www.cee1.org/ind/mot‐sys/ww/epri‐audit.pdf.
How to Hire an Energy Auditor is a California Energy Efficiency document that can be found at:
http://www.energy.ca.gov/reports/efficiency_handbooks/400‐00‐001C.PDF.
California Energy Commission (Process Energy-Water/Wastewater Treatment)
http://www.energy.ca.gov/process/water/wastewater_treatment.html
Reference
1. Efficiency, E., Energy Efficiency in Water and Wastewater Facilities.
2. Daw, J., et al., Energy efficiency strategies for municipal wastewater treatment
facilities. Contract, 2012. 303: p. 275-3000.
3. Pakenas, L. J. (1995). Energy Efficiency in Municipal Wastewater Treatment Plants:
Technology Assessment, New York State Energy Research and Development Authority.
4. Liu, F., et al., A primer on energy efficiency for municipal water and wastewater
utilities. 2012.
5. https://energytrust.org/library/GetDocument/3441
6. Tao, X. and W. Chengwen (2009). Energy consumption in wastewater treatment plants
in China. IWA world congress on water, climate energy.
7. ICF International. 2008. Water and Energy: Leveraging Voluntary Programs to Save
Both Water and Energy.
http://water.epa.gov/scitech/wastetech/upload/Final‐Report‐Mar‐2008.pdf
8. http://www.gewater.com/products/zeelung.html

Weitere ähnliche Inhalte

Was ist angesagt?

Understanding Persistent Organic Pollutants (POPs) and Managing their Impact
Understanding Persistent Organic Pollutants (POPs) and Managing their ImpactUnderstanding Persistent Organic Pollutants (POPs) and Managing their Impact
Understanding Persistent Organic Pollutants (POPs) and Managing their ImpactSGS
 
Phytoremediation, an option for tertiary treatment of sewage
Phytoremediation, an option for tertiary treatment of sewagePhytoremediation, an option for tertiary treatment of sewage
Phytoremediation, an option for tertiary treatment of sewageArvind Kumar
 
Ppt biomass latest updated 20 3 2019
Ppt biomass latest updated 20 3 2019Ppt biomass latest updated 20 3 2019
Ppt biomass latest updated 20 3 2019mahendra pande
 
Phosphorus Removal Essentials in wastewater | YSI Webinar
Phosphorus Removal Essentials in wastewater | YSI WebinarPhosphorus Removal Essentials in wastewater | YSI Webinar
Phosphorus Removal Essentials in wastewater | YSI WebinarXylem Inc.
 
Advanced Oxidation Process for Industrial Water Treatment and Waste Water
Advanced Oxidation Process for  Industrial Water Treatment and Waste WaterAdvanced Oxidation Process for  Industrial Water Treatment and Waste Water
Advanced Oxidation Process for Industrial Water Treatment and Waste WaterUus Soedjak
 
waste water and water pollution
waste  water and water pollutionwaste  water and water pollution
waste water and water pollutionSarojKatwal
 
Biogas-energy of the future
Biogas-energy of the futureBiogas-energy of the future
Biogas-energy of the futureAbhinav Ojha
 
Wastewater Management using Photo-Fenton Oxidation
Wastewater Management using Photo-Fenton OxidationWastewater Management using Photo-Fenton Oxidation
Wastewater Management using Photo-Fenton OxidationSidharth Banerjee
 
Presentation on wastewater treatment plant
Presentation on wastewater treatment plantPresentation on wastewater treatment plant
Presentation on wastewater treatment plantAmreetOjha
 
Sbr wastewater treatment plant
Sbr wastewater treatment plantSbr wastewater treatment plant
Sbr wastewater treatment plantwwwtwastewater
 
Waste water treatment
Waste water treatmentWaste water treatment
Waste water treatmentvasuki silva
 
Biogas & Biomass
Biogas & BiomassBiogas & Biomass
Biogas & BiomassAyessa Mae
 
Waste water treatment with anaerobic digestion
Waste water treatment with anaerobic digestion Waste water treatment with anaerobic digestion
Waste water treatment with anaerobic digestion Heather Troutman
 
SEA WATER DESALINATION
SEA WATER DESALINATIONSEA WATER DESALINATION
SEA WATER DESALINATIONSoham Sen
 
Water Recycling Process
Water Recycling ProcessWater Recycling Process
Water Recycling ProcessSooksop
 

Was ist angesagt? (20)

Understanding Persistent Organic Pollutants (POPs) and Managing their Impact
Understanding Persistent Organic Pollutants (POPs) and Managing their ImpactUnderstanding Persistent Organic Pollutants (POPs) and Managing their Impact
Understanding Persistent Organic Pollutants (POPs) and Managing their Impact
 
Phytoremediation, an option for tertiary treatment of sewage
Phytoremediation, an option for tertiary treatment of sewagePhytoremediation, an option for tertiary treatment of sewage
Phytoremediation, an option for tertiary treatment of sewage
 
Ppt biomass latest updated 20 3 2019
Ppt biomass latest updated 20 3 2019Ppt biomass latest updated 20 3 2019
Ppt biomass latest updated 20 3 2019
 
Phosphorus Removal Essentials in wastewater | YSI Webinar
Phosphorus Removal Essentials in wastewater | YSI WebinarPhosphorus Removal Essentials in wastewater | YSI Webinar
Phosphorus Removal Essentials in wastewater | YSI Webinar
 
Bio gas
Bio gasBio gas
Bio gas
 
Environmental concerns
Environmental concernsEnvironmental concerns
Environmental concerns
 
Advanced Oxidation Process for Industrial Water Treatment and Waste Water
Advanced Oxidation Process for  Industrial Water Treatment and Waste WaterAdvanced Oxidation Process for  Industrial Water Treatment and Waste Water
Advanced Oxidation Process for Industrial Water Treatment and Waste Water
 
waste water and water pollution
waste  water and water pollutionwaste  water and water pollution
waste water and water pollution
 
Aop
AopAop
Aop
 
Biogas-energy of the future
Biogas-energy of the futureBiogas-energy of the future
Biogas-energy of the future
 
Advanced oxidation
Advanced oxidationAdvanced oxidation
Advanced oxidation
 
Wastewater Management using Photo-Fenton Oxidation
Wastewater Management using Photo-Fenton OxidationWastewater Management using Photo-Fenton Oxidation
Wastewater Management using Photo-Fenton Oxidation
 
Presentation on wastewater treatment plant
Presentation on wastewater treatment plantPresentation on wastewater treatment plant
Presentation on wastewater treatment plant
 
Sbr wastewater treatment plant
Sbr wastewater treatment plantSbr wastewater treatment plant
Sbr wastewater treatment plant
 
Waste water treatment
Waste water treatmentWaste water treatment
Waste water treatment
 
Biogas & Biomass
Biogas & BiomassBiogas & Biomass
Biogas & Biomass
 
Fecal Sludge Management
Fecal Sludge ManagementFecal Sludge Management
Fecal Sludge Management
 
Waste water treatment with anaerobic digestion
Waste water treatment with anaerobic digestion Waste water treatment with anaerobic digestion
Waste water treatment with anaerobic digestion
 
SEA WATER DESALINATION
SEA WATER DESALINATIONSEA WATER DESALINATION
SEA WATER DESALINATION
 
Water Recycling Process
Water Recycling ProcessWater Recycling Process
Water Recycling Process
 

Andere mochten auch

Secondary wastewater treatment
Secondary wastewater treatmentSecondary wastewater treatment
Secondary wastewater treatmentIftikhar Ali
 
Large Bubble Vertical Mixing – Energy Savings and Performance Enhancement
Large Bubble Vertical Mixing – Energy Savings and Performance Enhancement   Large Bubble Vertical Mixing – Energy Savings and Performance Enhancement
Large Bubble Vertical Mixing – Energy Savings and Performance Enhancement AEP Ohio
 
Overview of Water cycles, wastewater treatment processes, wastewater plant en...
Overview of Water cycles, wastewater treatment processes, wastewater plant en...Overview of Water cycles, wastewater treatment processes, wastewater plant en...
Overview of Water cycles, wastewater treatment processes, wastewater plant en...AEP Ohio
 
Aeration ppt by Sajal
Aeration ppt   by SajalAeration ppt   by Sajal
Aeration ppt by SajalSAJAL1428
 
Waste water treatment processes
Waste water treatment processesWaste water treatment processes
Waste water treatment processesAshish Agarwal
 

Andere mochten auch (7)

Secondary wastewater treatment
Secondary wastewater treatmentSecondary wastewater treatment
Secondary wastewater treatment
 
Large Bubble Vertical Mixing – Energy Savings and Performance Enhancement
Large Bubble Vertical Mixing – Energy Savings and Performance Enhancement   Large Bubble Vertical Mixing – Energy Savings and Performance Enhancement
Large Bubble Vertical Mixing – Energy Savings and Performance Enhancement
 
Poster - Adequacy of the treatment capacity in water and wastewater services
Poster - Adequacy of the treatment capacity in water and wastewater servicesPoster - Adequacy of the treatment capacity in water and wastewater services
Poster - Adequacy of the treatment capacity in water and wastewater services
 
Overview of Water cycles, wastewater treatment processes, wastewater plant en...
Overview of Water cycles, wastewater treatment processes, wastewater plant en...Overview of Water cycles, wastewater treatment processes, wastewater plant en...
Overview of Water cycles, wastewater treatment processes, wastewater plant en...
 
Aeration ppt by Sajal
Aeration ppt   by SajalAeration ppt   by Sajal
Aeration ppt by Sajal
 
Aeration
AerationAeration
Aeration
 
Waste water treatment processes
Waste water treatment processesWaste water treatment processes
Waste water treatment processes
 

Ähnlich wie energy efficiency in wastewater facilities

Case Study - STP Power Saving - Bacterial Culture
Case Study - STP Power Saving - Bacterial CultureCase Study - STP Power Saving - Bacterial Culture
Case Study - STP Power Saving - Bacterial CultureFermenta Biotech Ltd
 
Case studies in residual use and energy conservation in wastewater treatment ...
Case studies in residual use and energy conservation in wastewater treatment ...Case studies in residual use and energy conservation in wastewater treatment ...
Case studies in residual use and energy conservation in wastewater treatment ...yvonnie manera
 
Energy audit for a waste water treatment process
Energy audit for a waste water treatment processEnergy audit for a waste water treatment process
Energy audit for a waste water treatment processIRJET Journal
 
Water conservation opportunities.
Water conservation opportunities.Water conservation opportunities.
Water conservation opportunities.D.Pawan Kumar
 
Energy efficiency bmp
Energy efficiency bmp Energy efficiency bmp
Energy efficiency bmp hatec
 
Atlas Energy Group_REF 3.0 061615 v2 - Ukrainian
Atlas Energy Group_REF 3.0 061615 v2 - UkrainianAtlas Energy Group_REF 3.0 061615 v2 - Ukrainian
Atlas Energy Group_REF 3.0 061615 v2 - UkrainianCarter D. Johnson
 
GSWRA_EnergyEfficiency_SEPT2015_DBT
GSWRA_EnergyEfficiency_SEPT2015_DBTGSWRA_EnergyEfficiency_SEPT2015_DBT
GSWRA_EnergyEfficiency_SEPT2015_DBTDylan Thisse, P.E.
 
Green buildings : Challange in Operation and Maintenance
Green buildings : Challange in Operation and MaintenanceGreen buildings : Challange in Operation and Maintenance
Green buildings : Challange in Operation and MaintenanceTejwant Navalkar
 
Energy Conservation By Mehfooz Qazi
Energy Conservation By Mehfooz QaziEnergy Conservation By Mehfooz Qazi
Energy Conservation By Mehfooz QaziIEEEP Karachi
 
Tony deVos - Cardinal Laboratories - Impact Unleashed 2017
Tony deVos - Cardinal Laboratories - Impact Unleashed 2017Tony deVos - Cardinal Laboratories - Impact Unleashed 2017
Tony deVos - Cardinal Laboratories - Impact Unleashed 2017Caitlyn Dudas
 
Energy efficiency in buildings
Energy efficiency in buildingsEnergy efficiency in buildings
Energy efficiency in buildingsD.Pawan Kumar
 
Philadelphia Energy
Philadelphia EnergyPhiladelphia Energy
Philadelphia Energycrockettc
 
Program and Policy Innovations at the Water Energy Nexus
Program and Policy Innovations at the Water Energy NexusProgram and Policy Innovations at the Water Energy Nexus
Program and Policy Innovations at the Water Energy NexusThe Electrochemical Society
 
An Experimental Study on Treatment of Dairy Waste Water using Microbial Fuel ...
An Experimental Study on Treatment of Dairy Waste Water using Microbial Fuel ...An Experimental Study on Treatment of Dairy Waste Water using Microbial Fuel ...
An Experimental Study on Treatment of Dairy Waste Water using Microbial Fuel ...IRJET Journal
 
Waste, water, and energy benchmarking and conservation opportunities for Minn...
Waste, water, and energy benchmarking and conservation opportunities for Minn...Waste, water, and energy benchmarking and conservation opportunities for Minn...
Waste, water, and energy benchmarking and conservation opportunities for Minn...University of Minnesota Tourism Center
 

Ähnlich wie energy efficiency in wastewater facilities (20)

Case Study - STP Power Saving - Bacterial Culture
Case Study - STP Power Saving - Bacterial CultureCase Study - STP Power Saving - Bacterial Culture
Case Study - STP Power Saving - Bacterial Culture
 
Case studies in residual use and energy conservation in wastewater treatment ...
Case studies in residual use and energy conservation in wastewater treatment ...Case studies in residual use and energy conservation in wastewater treatment ...
Case studies in residual use and energy conservation in wastewater treatment ...
 
Energy audit 1
Energy audit 1Energy audit 1
Energy audit 1
 
299
299299
299
 
Energy audit for a waste water treatment process
Energy audit for a waste water treatment processEnergy audit for a waste water treatment process
Energy audit for a waste water treatment process
 
energy audit
energy auditenergy audit
energy audit
 
Water conservation opportunities.
Water conservation opportunities.Water conservation opportunities.
Water conservation opportunities.
 
Energy efficiency bmp
Energy efficiency bmp Energy efficiency bmp
Energy efficiency bmp
 
Atlas Energy Group_REF 3.0 061615 v2 - Ukrainian
Atlas Energy Group_REF 3.0 061615 v2 - UkrainianAtlas Energy Group_REF 3.0 061615 v2 - Ukrainian
Atlas Energy Group_REF 3.0 061615 v2 - Ukrainian
 
GSWRA_EnergyEfficiency_SEPT2015_DBT
GSWRA_EnergyEfficiency_SEPT2015_DBTGSWRA_EnergyEfficiency_SEPT2015_DBT
GSWRA_EnergyEfficiency_SEPT2015_DBT
 
Next Gen Filton Airfield, UK
Next Gen Filton Airfield, UKNext Gen Filton Airfield, UK
Next Gen Filton Airfield, UK
 
Unit 1.pptx
Unit 1.pptxUnit 1.pptx
Unit 1.pptx
 
Green buildings : Challange in Operation and Maintenance
Green buildings : Challange in Operation and MaintenanceGreen buildings : Challange in Operation and Maintenance
Green buildings : Challange in Operation and Maintenance
 
Energy Conservation By Mehfooz Qazi
Energy Conservation By Mehfooz QaziEnergy Conservation By Mehfooz Qazi
Energy Conservation By Mehfooz Qazi
 
Tony deVos - Cardinal Laboratories - Impact Unleashed 2017
Tony deVos - Cardinal Laboratories - Impact Unleashed 2017Tony deVos - Cardinal Laboratories - Impact Unleashed 2017
Tony deVos - Cardinal Laboratories - Impact Unleashed 2017
 
Energy efficiency in buildings
Energy efficiency in buildingsEnergy efficiency in buildings
Energy efficiency in buildings
 
Philadelphia Energy
Philadelphia EnergyPhiladelphia Energy
Philadelphia Energy
 
Program and Policy Innovations at the Water Energy Nexus
Program and Policy Innovations at the Water Energy NexusProgram and Policy Innovations at the Water Energy Nexus
Program and Policy Innovations at the Water Energy Nexus
 
An Experimental Study on Treatment of Dairy Waste Water using Microbial Fuel ...
An Experimental Study on Treatment of Dairy Waste Water using Microbial Fuel ...An Experimental Study on Treatment of Dairy Waste Water using Microbial Fuel ...
An Experimental Study on Treatment of Dairy Waste Water using Microbial Fuel ...
 
Waste, water, and energy benchmarking and conservation opportunities for Minn...
Waste, water, and energy benchmarking and conservation opportunities for Minn...Waste, water, and energy benchmarking and conservation opportunities for Minn...
Waste, water, and energy benchmarking and conservation opportunities for Minn...
 

energy efficiency in wastewater facilities

  • 1. Energy Efficiency in Wastewater Facilities Prepared by Tongyan Li
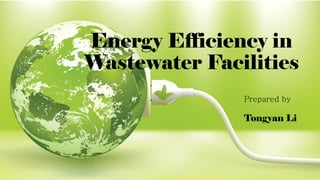
  • 2. Treated Source Water Treatment 100-16,000kWh/MG Treated Wastewater Wastewater Collection & Treatment Water End Use Conveyance 0-14,000kWh/MG Distribution 700-1,200Wh/MG Treated wastewater discharge Energy Opportunities • Use efficient pumping systems (pumps, motors, variable frequency drives) • Capture energy from water moving downhill • Store water to avoid pumping at times of peak energy cost Energy Opportunities • Install SCADA software • Use efficient pumping systems • Install efficient disinfection equipment • Implement lighting • HAVC improvements Energy Opportunities • Use efficient pumping systems • Reduce distribution leaks • Implement automatic meter reading Energy Opportunities • Improve efficiency of aeration equipment and anaerobic digestion • Implement cogeneration and other onsite renewable power options • Implement lighting, HVAC improvements • Fix leaks • Install SCADA software • Use efficient pumping systems • Recycle water Energy Opportunities • Use efficient pumping systems • Capture energy from water moving downhill Figure 1 Energy Intensity of Each Stage in the Water Cycle [1]
  • 3. WHY DOES ENERGY EFFCIENCY MATTER FOR WASTEWATER TREATMENT FACILITIES? Water and wastewater systems are significant energy consumers with an estimated 3%-4% of total U.S. electricity consumption used for the movement and treatment of water and wastewater [2]. A secondary treatment plant may use as much as 1500 to 1700 kilowatt hours (kWh) of electricity to treat one million gallons of sewage and manage the resulting sludge and residuals [3]. Electricity is a critical input for delivering municipal water and wastewater services. Electricity costs are usually between 5 to 30 percent of total operating costs among water and wastewater utilities (WWUs) worldwide [4]. The Oregon Department of Energy reports that a city’s electrical power cost for wastewater treatment can consume 25 percent or more of the entire city’s electrical bill. Nationwide, that’s more than $4 billion annually [5].
  • 4. Figure 2 Process flow diagram of a typical wastewater treatment plant
  • 5. 1.65% 8.67% 1.23% 19.24% 0.48%68.73% Tertiary treatment Sludge treatment Lighting and other Pretreatment Primary treatment Secondary treatment Figure 3 Energy consumption in different processes [6] Secondary Treatment Microorganisms break down organic material, such as sugar s, fats, and proteins, that were not removed in the primary sedimentation process. This process reduces the majority of BOD5 and suspended solids Pretreatment Remove coarse materials such as paper, rocks, plastic, and rags Tertiary Treatment Biological treatment for nitrogen or phosphorus removal, chemical precipitation for phosphorus or metals removal, air stripping for ammonia removal Disinfection Remove the remaining pathogens and bacteria Primary Treatment The remaining settleable and floatble materials are removed during primary sedimentation
  • 6. 0 50 100 150 200 250 300 Trickling Filter Activated Sludge Physical Chemical Other Trickling Filter Activated Sludge Physical Chemical Other Figure 4 Number of treatment plants in New York State that use various forms of secondary wastewater treatment [3] Activated sludge Trickling filter Non-electric secondary filtration CONVENTIONAL SECONDARY TREATMENT PROCESSES Oxidation ponds
  • 7. Wastewater Plants Energy Consumption Figure 5 Typical wastewater treatment energy use distribution [1] Sewage aeration at an activated sludge WWTP accounts for about 30 to 80 percent of the total plant electricity demand. At the Fort Collins, Colorado, wastewater treatment facility. In 2012, the facility upgraded the controls on its blower system, installing an automated control system with much better turndown capabilities and a blow-off valve to improve system performance. Along with other blower upgrades, the improved controls helped reduce energy consumption from the aeration system by about 30 percent. Figure 6 Typical blower efficiencies Turndown capability is an indication of the blower’s ability to meet a range of airflow requirements
  • 8. Aeration  Aeration electric demand and energy consumption could be reduced by using fine-pore diffused-air systems and aeration process controls, or lowering the sludge age. A cross section of a typical coarse-bubble aeration tank at an activated sludge treatment plant A cross section of a typical fine-bubble aeration tank at an activated sludge treatment plant Aeration systems consist of blowers and diffusers are the most significant consumers of energy in a wastewater treatment system  Installing variable-speed drives for blowers and matching the blower output with air requirements can reduce energy use  Fine bubble diffusers coupled with variable flow compressors and energy efficient motors can reduce aeration energy consumption by 50% The Jackson, Wy., wastewater treatment plant replaced its 75 and 40 hp aerator mixers with 50 and 25 hp models, and replaced the 250 hp fixed speed blower with a high efficiency 150 hp variable speed blower. This has reduced the annual demand of 5.9 million kWh by about 1.95 million kWh and saved the plant around $85,000 a year.
  • 9. Understanding Energy Use in Wastewater Treatment Facilities Size Category Energy Use kWh/ML (kWh/MG) <4MLD (<1MGD) 990 (3,749) 4-19MLD (1-5MGD) 403 (1,527) 19-76MLD (5-20 MGD) 394 (1,490) 76-284MLD (20-75MGD) 413 (1,562) >284MLD (>75MGD) 282 (1,067) Table 1 Comparison of Energy Use for Wastewater Treatment Magnitude of energy use and demand in different facilities Daily and seasonal load patterns/Facility size The role of energy-intensive equipment in the wastewater treatment process Type of processing Efficiency levels of the equipment Dependence of energy use on the quality of the waste stream (the level of treatment required to meet regulations, the treatment technologies used) Figure 7 Municipal Wastewater Treatment Facility Load Pattern According to EPA’s ENERGY STAR program, municipalities can reduce energy costs for water and wastewater treatment by as much as 10 percent through cost-effective changes to their operations [7].
  • 10. CASE STUDY: NYSEDA municipal wastewater treatment plant energy evaluation Town of Tonawanda wastewater treatment plant NYSERDA: New York State Energy Research and Development Authority Figure 8 Electrical demand and usage Power metering was installed at each plant to accurately determine the energy consumption and savings of the evaluated processes. Through the use of submetering data and a thorough understaning of wastewater treatment processes, many opportunities to reduce plant energy costs while maintaining or increasing treatment and/or capacity were identified
  • 11. Figure 9 Total plant hourly kW draw
  • 12. Figure 10 Change in usage
  • 13. NYSERDA Energy Saving Measures Capital Improvements  Replacement of existing sludge stabilization and dewatering facilities  Modification or replacement of UNOX mixers with more efficient mixing equipment  Replacement of existing cryogenic oxygen generation system with vacuum-assisted pressure swing adsorption technology  High pressure service water pump modifications  Replacement of constant speed standard efficiency motors with premium efficiency motors Operation modifications  Operational modifications to reduce energy usage and cost Lighting/HVAC modifications
  • 14. GE Energy-Neutral Wastewater Treatment Replace conventional aeration process with ZeeLung Membrane Aerated Biofilm Reactor (MABR) [8] Four times more energy efficient than the conventional fine-bubble aeration systems many municipalities are currently using ZeeLung MABR Features  Simple  Low Energy  Nutrient Removal  Small Footprint The Metropolitan Water Reclamation District of Greater Chicago began a demonstration project to evaluate GE’s new ZeeLung MABR technology to increase the removal of nutrients in the existing plant footprint and reduce the energy required for biological aeration by 40%
  • 15. U.S. EPA offers energy-efficient equipment, technology and operating strategies Step 1: BENCHMARK your energy use Step 2: Perform an energy AUDIT Step 3: IMPLEMENT audit recommendations Step 4: Share your sucesses and REPEAT, for continuous improvement Equipment and Collection System Upgrades  Install Variable-Frequency Drives  Upgrade to Energy Efficient Motors and Motor Systems  Heating, Cooling, Ventilation System Upgrades  Bright Lights Bring Energy Savings Operating Strategies  Managing your electrical load  Biosolids management  Operation and maintenance  Inflow and infiltration control Energy Efficient Technology  Cogeneration or combined heat and power  Cogeneration using landfill gas Renewable Energy  In conduit hydro-power  Solar power  Wind power Source: https://www3.epa.gov/region9/waterinfrastructure/technology.html The city of Pacifica, California, recently began operating 1,800 solar panels to supply a portion of the Calera Creek Water Recycling Plant’s electric needs. The solar panels provide 10 to 15 percent of the treatment plant’s energy needs. The facility estimates $100,000 per year in energy savings
  • 16. California Energy Commission A multitude of energy efficient equipment, technologies and operating strategies are available to help take a bite out of the energy costs in water and wastewater facilities. • Variable frequency drives • Energy-Efficient Motors • Heating, Cooling, Ventilation Improvements • Lighting Improvements • Electrical Load Management Strategies • Cogeneration Optimization • Fuel Cells California water and wastewater agencies spend more than $500 million each year on energy costs Source: http://www.energy.ca.gov/process/water/wastewater_treatment.html
  • 17. The role of big data in wastewater treatment plants SCADA systems Retrieve information on plant operation and other systems Predicting pipe failure Predictive weather data Managing water costs Energy management Measuring asset condition Energy monitoring can be used to help understand and quickly intervene when energy consumption at plant or component level increases. Data analytics can then be used to prevent efficiency excursions before they happen and to identify further reductions by a change of operation or equipment. Many water companies have extensive energy data at plant level, but rarely at component level, but this is improving. The water and wastewater industry is currently in transition from business-as-usual operations, employing traditional engineering solutions, to a new approach – Smarter Water Management – which uses big data and advanced analytics to create new insights that can improve operational efficiencies. IBM Research, working in partnership with a European wastewater utility, developed an end-to-end water resource recovery plant optimization that can save as much as 15 percent or more of costs associated with energy consumption, biosolids handling, and chemical usage. Using a big data approach that integrates dynamic plant simulation forecasting and mathematical optimization, activated sludge treatment processes can be significantly improved in the areas of resources recovery, cost efficiency, and regulatory compliance.
  • 18. Programs Federal programs ENERGY STAR Water and Wastewater ENERGY STAR Green Buildings and Energy Efficiency U.S. EPA Office of Water, Energy Efficiency for Water and Wastewater Utilities U.S. EPA Combined Heat and Power (CHP) Partnership U.S. EPA Green Power Partnership U.S. EPA Wastewater Management Website U.S. EPA WaterSense Program U.S. EPA State and Local Climate and Energy Program
  • 19. Useful Resources EPA’s Energy Use Assessment Tool is a free, downloadable, Excel‐based energy audit tool. The tool allows both water and wastewater systems to conduct a utility bill analysis, determine baseline energy consumption and cost in total and also broken down to the process‐level and equipment‐level, and identify the most energy‐intensive areas of the system. In addition, the tool highlights areas of inefficiency that users may find useful in identifying and prioritizing ECMs. The tool can be found at: http://water.epa.gov/infrastructure/sustain/energy_use.cfm. EPA’s EnergyStar Portfolio Manager is a free, online tool drinking water systems can use to develop a simple energy baseline based on utility bill data and track changes in energy use and GHG emissions over time. The tool can be found at: http://www.energystar.gov/index.cfm?c=evaluate_performance.bus_portfoliomanager. Understanding Your Electric Bill is a Wisconsin Focus on Energy Fact Sheet that can be found at: http://water.epa.gov/infrastruture/sustain/Understanding‐Your‐Electirc‐Bill.pdf Electric Power Research Institute (EPRI) Energy Audit Manual for Water /Wastewater Facilities can be found at: http://www.cee1.org/ind/mot‐sys/ww/epri‐audit.pdf. How to Hire an Energy Auditor is a California Energy Efficiency document that can be found at: http://www.energy.ca.gov/reports/efficiency_handbooks/400‐00‐001C.PDF. California Energy Commission (Process Energy-Water/Wastewater Treatment) http://www.energy.ca.gov/process/water/wastewater_treatment.html
  • 20. Reference 1. Efficiency, E., Energy Efficiency in Water and Wastewater Facilities. 2. Daw, J., et al., Energy efficiency strategies for municipal wastewater treatment facilities. Contract, 2012. 303: p. 275-3000. 3. Pakenas, L. J. (1995). Energy Efficiency in Municipal Wastewater Treatment Plants: Technology Assessment, New York State Energy Research and Development Authority. 4. Liu, F., et al., A primer on energy efficiency for municipal water and wastewater utilities. 2012. 5. https://energytrust.org/library/GetDocument/3441 6. Tao, X. and W. Chengwen (2009). Energy consumption in wastewater treatment plants in China. IWA world congress on water, climate energy. 7. ICF International. 2008. Water and Energy: Leveraging Voluntary Programs to Save Both Water and Energy. http://water.epa.gov/scitech/wastetech/upload/Final‐Report‐Mar‐2008.pdf 8. http://www.gewater.com/products/zeelung.html