Somatic variant detection from circulating tumor cells using targeted next-generation sequencing
•
1 like•1,274 views

Somatic variant detection in oncology research may provide insight into drug response and helps identify new therapeutic targets in the future. A key limitation to this process is the availability of tumor tissue that adequately represents the current disease status. Development of a robust method for detecting mutational status from a blood sample would enable analysis of tumor changes over time, which is impractical using tissue samples. A workflow is presented for analyzing somatic variants in circulating tumor cell (CTC) samples using next-generation sequencing (NGS).
Recommended

Recommended
More Related Content
More from Thermo Fisher Scientific
More from Thermo Fisher Scientific (20)
Recently uploaded
Recently uploaded (20)
Somatic variant detection from circulating tumor cells using targeted next-generation sequencing
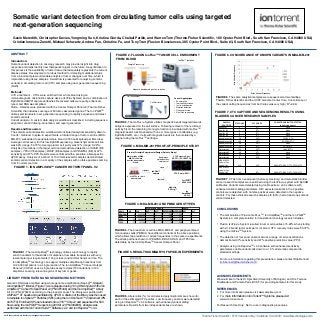
- 1. Gavin Meredith, Christopher Davies, Yongming Sun, Kristina Giorda, Chaitali Parikh, and Warren Tom (Thermo Fisher Scientific, 180 Oyster Point Blvd., South San Francisco, CA 94080 USA) Cristian Ionescu-Zanetti, Michael Schwartz, Andrea Fan, Christine Fu, and Tony Tran (Fluxion Biosciences, 385 Oyster Point Blvd., Suite #3, South San Francisco, CA 94080 USA) FIGURE 2. FLUXION IsoFlux™ TUMOR CELL ENRICHMENT FROM BLOOD ABSTRACT Introduction: Somatic variant detection in oncology research may provide insight into drug response and helps identify new therapeutic targets in the future. A key limitation to this process is the availability of tumor tissue that adequately represents the current disease status. Development of a robust method for detecting mutational status from a blood sample would enable analysis of tumor changes over time, which is impractical using tissue samples. A workflow is presented for analyzing somatic variants in circulating tumor cell (CTC) samples using next-generation sequencing (NGS). Methods: CTC enrichment - CTCs were enriched from whole blood using an immunomagnetic microfluidic capture device (IsoFlux System) and a combination of EpCAM and EGFR capture antibodies. Recovered cells were purity-enhanced, lysed, and DNA was amplified. NGS – Libraries were produced with the Cancer Hotspot Panel v2 (Thermo Fisher Scientific) that includes coverage of 50 tumor-associated genes. The Ion PGMTM utilizes semiconductor next-generation sequencing to rapidly sequence and detect somatic variants. Variant analysis - A custom data analysis workflow is described, including sequence alignment, variant filtering, annotation, and report generation. Results and Discussion: The somatic variant detection workflow demonstrated analytical sensitivity down to 3 cells / mLblood. In spike-in experiments, a titrated range of tumor cell line (MDA- MB-231) was added to peripheral whole blood (0-180 cells spiked per 8mL tube). Average cell recovery for this low-EpCAM expressing, mesenchymal-like cell line was 66% (range: 54-73%). Average tumor cell purity was 12% (range: 5-22%). Analysis of mutations in the target cell-line demonstrated detection of KRAS (8/8 samples), TP53 (7/8 samples), BRAF (8/8 samples) and PDGFRA (8/8) at 97% sensitivity and 97% PPV. Results were confirmed with a sensitive, allele-specific qPCR assay. Analysis of a cohort of 10 clinical research samples demonstrated somatic variant detection in a majority of the samples with no false positives coming from 5 normal controls. CONCLUSIONS • The combination of Fluxion IsoFLuxTM, Ion AmpliSeqTM and the Ion PGMTM System is a complete solution for translational oncology research studies. • Fluxion IsoFluxTM System resulted in tumor cell purities of 5-22% when starting with 2-12 breast tumor cells per ml of blood. CTC recovery rates were 53-72% using the IsoFluxTM System. • The detection of four know variants across a range of cell concentrations demonstrated 97% sensitivity and 97% positive prediction value (PPV). • Analysis using Ion ReporterTM v4.4 software with enhanced sensitivity parameters enable variant calls down to a 1.0% allele ratio compared to standard settings. • For more information regarding this presentation, please contact Rob Bennett (rob.bennett@thermofisher.com). ACKNOWLEDGEMENTS We would like to thank Dr. Ajjai Alva (University of Michigan), and Drs. Terence Friedlander and Pamela Paris (UCSF) for providing samples for this study. REFERENCES 1. For more information please visit www.ampliseq.com 2. For more information on Ion Torrent™ Systems, please visit www.iontorrent.com For Research Use Only. Not for use in diagnostic procedures. Somatic variant detection from circulating tumor cells using targeted next-generation sequencing Thermo Fisher Scientific • 5791 Van Allen Way • Carlsbad, CA 92008 • www.lifetechnologies.comFor Research Use Only. Not for use in diagnostic procedures. FIGURE 7. CTC CAPTURE AND SEQUENCING RESULTS USING BLADDER CANCER RESEARCH SAMPLES FIGURE 7. CTCs from neoadjuvant (before cystectomy) and metastatic bladder cancer research samples were enriched using the IsoFluxTM system with EpCAM antibodies. Variants were detected using Ion ReporterTM v4.4 software with enhanced variant calling parameters. All 3 expected variants in the 2 positive controls were detected, with no false positives were detected in the negative controls. For these clinical research samples, 4/8 (50%) had at least one somatic variant detected. LIBRARY PREPARATION AND SEQUENCING METHODS Genomic DNA was amplified using whole genome amplification (Repli-g™, Qiagen). Ion AmpliSeq™ libraries (Figure 1) were prepared using 10 ng DNA input with the Ion AmpliSeq™ Cancer Hotspot Panel v2 (PN 4475346) and the Ion AmpliSeq™ Library Kit 2.0 (PN 4475345) according to the product manual. The library was purified with AMPure™ XT beads and quantitated by qPCR. A dilution of the library was then used to template Ion Sphere™ Particles (ISPs) using the Ion OneTouch™ 2 instrument (PN 4474779). Enriched ISPs were loaded onto a 318™ Chip v2 and sequenced for 500 flows using the Ion PGM™ Sequencing 200 Kit v2 (PN 4482006). Analysis was performed with the Ion Torrent Suite™ Software v.4.2 and Ion Reporter™ v4.4. SAMPLE IDENTIFIER CTC COUNT CTC PURITY SOMATIC VARIANTS DETECTED (allelic frequency) Healthy #1 0 0% None Healthy #2 0 0% None Healthy #3 0 0% None Healthy #4 0 0% None Neoadjuvant #1 40 10% FGFR2 (1%) Neoadjuvant #2 100 19% PDGFRA (1%) Neoadjuvant #3 20 12% None Neoadjuvant #4 21 8% EGFR (6%) Metastatic #1 154 25% JAK2 (12%) Metastatic #2 34 4% None Metastatic #3 11 15% None Metastatic #4 8 N/D None MDA-MB-231 Spike In (Pos Control) #1 N/D N/D KRAS (6%), BRAF (7%), TP53 (12%) MDA-MB-231 Spike In (Pos Control) #2 60 8% KRAS (4%), BRAF (6%), TP53 (11%) Proof of Principle Experimental Design (Spike-In Study) Mixture study of MDA- MB-231 cells into healthy donor whole blood triplicate IsoFlux™ capture 0 - 314 CTCs in 14 mL whole blood Enumerate spiked cells vs. total nuclei CTC Recovery Rates: 53-72% (32-169 CTCs) CTC Purity: 5-22% single WGA with REPLI-g™ duplicate Cast-PCR™ KRAS G13D Ion AmpliSeq™ CHPv2 Sample Processing Cell Enrichment Cell Retrieval IsoFlux™ Isolation Magnetic bead based positive selection Current Applications • Enumeration • Immunofluorescence • In situ hybridization • Mutation detection • Gene expression • Next Gen sequencing FIGURE 1. ION AMPLISEQ™ CANCER HOTSPOT PANEL V2 FIGURE 1. The Ion AmpliSeqTM technology utilizes a technology to rapidly enrich hundreds to thousands of mutations at low allele frequencies with very low sample input requirements (10ng or less) and minlmal hands on time. The Ion AmpliSeqTM technology can support multiplex amplification reactions from 12-24,000 amplicons in a single reaction. The Ion AmpliSeqTM Cancer Hotspot Panel v2 (CHPv2) uses a single-tube assay to detect 739 mutations in 190 amplicons covering relevant regions of key tumor genes. FIGURE 2. The IsoFluxTM System utilizes magnetic beads targeted towards antigens expressed on the cell surface. Following removal of the red blood cells by Ficoll, the remaining monocyte fraction is incubated with IsoFluxTM magnetic beads functionalized with one or more types of antibodies (e.g. EpCAM, EGFR, etc.). Cells with magnetic beads are then isolated by a magnet using the IsoFluxTM cartridge. FIGURE 3. MDA-MB-231 PROOF-OF-PRINCIPLE STUDY FIGURE 4. MDA-MB-231 AND PBMC GENOTYPES FIGURE 4. The breast tumor cell line MDA-MB-321 and peripheral blood mononuclear cells (PBMCs) have different variants at the above positions, which allows the prediction of allelic frequencies in the spike-in experiments. The allelic positions shown for PDGFRA, BRAF, KRAS, and TP53 are detectable by the Ion AmpliSeqTM Cancer Hotspot Panel. FIGURE 5. Allele ratios (%) for all detected polymorphisms are shown for each of the estimated CTC purities. Low frequency variants were detected using Ion ReporterTM v4.4 software with enhanced variant calling parameters. Results from two independent sites are shown. FIGURE 5. RESULTS SUMMARY OF SPIKE-IN EXPERIMENTS FIGURE 6. CONCORDANCE OF KNOWN VARIANTS IN MDA-MB-231 Site 1 Variant Frequency Site2VariantFrequency FIGURE 6. The same analytical samples were sequenced at two facilities, Thermo Fisher Scientific and the UCSF Genome Center Core. Concordance of the variant calling frequencies from both sites was very high ( R2=0.94). MDA-MB231 Spike-In PBMA GENE CHR POS REF ALT REF COUNT ALT COUNT REF ALT PDGFRA 4 55152040 C T 2391 1331 C - BRAF 7 140481417 C A 1161 1755 C - KRAS 12 25398281 C T 986 1924 C - TP53 17 7577099 C T 14 2462 C -