Ante5 Oil & Gas Research Report (8/9/2011)
•
1 like•916 views

Ante5, Inc. is an oil and gas exploration and production company based in Minnetonka, Minnesota. Ante5’s focus is the Williston Basin Bakken and Three Forks trend in North Dakota and Montana. Ante5 controls over 10,000 net mineral acres in North Dakota.

Recommended
More Related Content
What's hot
What's hot (16)
Viewers also liked
Viewers also liked (17)
Similar to Ante5 Oil & Gas Research Report (8/9/2011)
Similar to Ante5 Oil & Gas Research Report (8/9/2011) (20)
More from The WSR Group
Recently uploaded
Recently uploaded (20)
Ante5 Oil & Gas Research Report (8/9/2011)
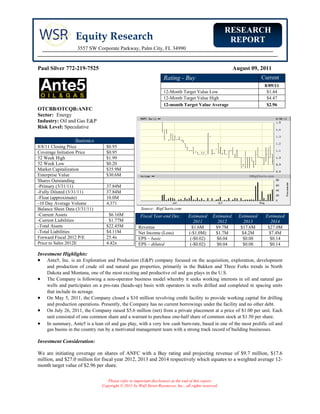
- 1. RESEARCH Equity Research REPORT 3557 SW Corporate Parkway, Palm City, FL 34990 Paul Silver 772-219-7525 August 09, 2011 Rating - Buy Current 8/09/11 12-Month Target Value Low $1.44 12-Month Target Value High $4.47 12-month Target Value Average $2.96 OTCBB/OTCQB:ANFC Sector: Energy Industry: Oil and Gas E&P Risk Level: Speculative Statistics 8/8/11 Closing Price $0.95 Coverage Initiation Price $0.95 52 Week High $1.99 52 Week Low $0.20 Market Capitalization $35.9M Enterprise Value $30.6M Shares Outstanding -Primary (3/31/11) 37.84M -Fully Diluted (3/31/11) 37.84M -Float (approximate) 10.0M -10 Day Average Volume 4,371 Balance Sheet Data (3/31/11) Source: BigCharts.com -Current Assets $6.16M Fiscal Year-end Dec. Estimated Estimated Estimated Estimated -Current Liabilities $1.77M 2011 2012 2013 2014 -Total Assets $22.45M Revenue $1.6M $9.7M $17.6M $27.0M -Total Liabilities $4.11M Net Income (Loss) (-$1.0M) $1.7M $4.2M $7.4M Forward Fiscal 2012 P/E 25.4x EPS – basic (-$0.02) $0.04 $0.08 $0.14 Price to Sales 2012E 4.42x EPS – diluted (-$0.02) $0.04 $0.08 $0.14 Investment Highlights: • Ante5, Inc. is an Exploration and Production (E&P) company focused on the acquisition, exploration, development and production of crude oil and natural gas properties, primarily in the Bakken and Three Forks trends in North Dakota and Montana, one of the most exciting and productive oil and gas plays in the U.S. • The Company is following a non-operator business model whereby it seeks working interests in oil and natural gas wells and participates on a pro-rata (heads-up) basis with operators in wells drilled and completed in spacing units that include its acreage. • On May 5, 2011, the Company closed a $10 million revolving credit facility to provide working capital for drilling and production operations. Presently, the Company has no current borrowings under the facility and no other debt. • On July 26, 2011, the Company raised $5.6 million (net) from a private placement at a price of $1.00 per unit. Each unit consisted of one common share and a warrant to purchase one-half share of common stock at $1.50 per share. • In summary, Ante5 is a lean oil and gas play, with a very low cash burn-rate, based in one of the most prolific oil and gas basins in the country run by a motivated management team with a strong track record of building businesses. Investment Consideration: We are initiating coverage on shares of ANFC with a Buy rating and projecting revenue of $9.7 million, $17.6 million, and $27.0 million for fiscal year 2012, 2013 and 2014 respectively which equates to a weighted average 12- month target value of $2.96 per share. Please refer to important disclosures at the end of this report. Copyright © 2011 by Wall Street Resources, Inc., all rights reserved.
- 2. Equity Research Ante5, Inc. (OTCBB/OTCQB:ANFC) Table of Contents Page I. Overview Company 3 Recent Events 3 Williston Basin 4 Financial Flexibility 5 Wells 5 Investment Summary/Conclusion 5 II. Corporate Strategy Business Model 7 Operations 7 III. Leasehold Positions History of the Bakken Formation 8 The Bakken present day 9 Specific Counties 11 Competition 12 IV. Financial Projections and Valuation Index 13 Income Statement and Financial Projections 13 Balance Sheet 14 Statement of Cash Flows 15 Comparisons 16 Valuation Summary 16 Valuation Metrics 17 Break-Up Value 18 VI. Risks General Risk Factors 19 Risk Factors specific to Industry 19 Risk Factors specific to Company 20 VII. Management (Officers & Directors) 22 VIII. Corporate Offices and Advisors Corporate Offices and Advisors 24 Important Note: This report contains forward-looking statements, particularly as related to pro forma financial statements, earnings estimates and business expectations, within the meaning of Section 27A of the Securities Act of 1933 and Sections 21E of the Securities Exchange Act of 1934, and are subject to the safe harbor created by these sections. Any statements that express or involve discussions with respect to predictions, expectations, beliefs, plans, projections, objectives, goals, assumptions or future events or performance are not statements of historical fact and may be "forward looking statements." Forward looking statements are based on expectations, estimates and projections at the time the statements are made that involve a number of risks and uncertainties which could cause actual results or events to differ materially from those presently anticipated. These forward-looking statements are only made as of the date of their release and Wall Street Resources and the featured Company in this report do not undertake any obligation to publicly update such forward-looking statements to reflect subsequent events or circumstances. Please refer to important disclosures at the end of this report. Copyright © 2011 by Wall Street Resources, Inc., all rights reserved. 2
- 3. Equity Research Ante5, Inc. (OTCBB/OTCQB:ANFC) I. OVERVIEW Company Ante5, Inc. (“Ante5” or “the Company”) is a nimble Exploration and Production (E&P) company focused on the acquisition, exploration, development and production of crude oil and natural gas properties, primarily in the Bakken and Three Forks trends in North Dakota and Montana, one of the most exciting and productive oil and gas plays in the U.S. The Company is following a non-operator business model whereby it seeks working interests in oil and natural gas wells and participates on a pro-rata basis (heads-up) with operators in wells drilled and completed in spacing units that include its acreage. Ante5 accumulates mineral leases to participate in the drilling of new wells and may also purchase working interests in existing producing wells. The Company has alliances with partners on the ground in the Williston Basin region which will facilitate the identification and acquisition of high value acreage. Because Ante5 owns small interests in multiple drilling units, it is able to diversify its risk across numerous wells. As a non-operator Ante5 is committed to maintaining a low overhead structure. As of 3/31/2011, Ante5 controlled the rights to mineral leases covering approximately 9,600 net acres for prospective drilling in the Williston Basin and owned working interests in 19 gross wells representing 0.63 of a net well that are preparing to drill, drilling, awaiting completion, completing or producing. Ante5, Inc. is a Delaware corporation that trades on the OTCBB/OTCQB market under the ticker symbol ANFC. Recent Events The Company has accomplished a great deal over its first nine months as an oil and gas company. The following is a summary timeline of events and accomplishments. • October 14, 2010: Ante5 enters North Dakota oil & gas business by purchasing an interest in mineral leases on approximately 3,712 net acres for approximately $3 million in cash and approximately 5 million shares of common stock. • November 12, 2010: Ante5 began building the team that will develop and grow that business. Bradley Berman, the Board member whose vision guided Ante5, Inc. into the oil & gas business, stepped into the role of CEO, Chairman of the Board and Secretary. Noted financier Benjamin S. Oehler and successful Entrepreneur Morris Goldfarb have been appointed as outside directors to fill the vacated Board seats. Joshua Wert, an accomplished businessman and entrepreneur in his own right, has been hired by the Company in the role of Chief Operating Officer and interim CFO. • November 18, 2010: Ante5 raised over $9 million to date in its private placement at $1.00 per share. • December 6, 2010: Ante5 announces that it has spud four gross Bakken wells, two of which are producing, one is awaiting completion and the other is currently being drilled. • December 20, 2010: Ante5 announced today that it has raised $11 million in its private placement equity financing, $1 million more than the original plan of $10 million due to high demand which allowed it to utilize its overallotment provision. Please refer to important disclosures at the end of this report. Copyright © 2011 by Wall Street Resources, Inc., all rights reserved. 3
- 4. Equity Research Ante5, Inc. (OTCBB/OTCQB:ANFC) • March 22, 2011: Ante5 announced that it now controls over 5,600 net acres that it considers prospective for the Bakken and/or Three Forks formations. Ante5 has the potential to drill approximately 17.5 net wells on its current acreage. • May 5, 2011: Ante5 completed the closing of a $10 million revolving credit facility to provide working capital for drilling and production operations. As of this date, Ante5 has no borrowings under the facility and no other debt. • May 16, 2011: Ante5 announced production volumes for the first quarter of 2011 were 1,254 barrels of oil equivalent ("BOE"). As of March 31, 2011, Ante5 had interests in a total of 19 gross (0.63 net) Bakken/Three Forks wells that were preparing to drill, drilling, awaiting completion, completing or producing. • July 26, 2011: Ante5 closed a private placement of 6,142,500 units at a price of $1.00 per unit with 50% warrant coverage. After expenses, the Company received net proceeds of approximately $5.6 million. Williston Basin The Williston Basin is one of the largest sedimentary basins in North America at nearly 300,000 square miles. The Basin, which spreads across North Dakota, South Dakota, Montana, Saskatchewan and Manitoba, runs 300 miles east to west and 475 miles from north to south at its farthest points. Currently the North Dakota Industrial Commission estimates 6.5 billion barrels of recoverable oil from the Bakken and Three Forks formations of which only 244 million barrels have been recovered to date. The Bakken and Three Forks formations are only 2 of 20 payzones (a payzone is a subsurface formation within the Basin where oil and gas can be extracted) encompassed by the Williston Basin. The Bakken Formation estimate is larger than all other current U.S. Geological Survey (USGS) oil assessments of the lower 48 states and is the largest “continuous” oil accumulation ever assessed by the USGS. Please refer to important disclosures at the end of this report. Copyright © 2011 by Wall Street Resources, Inc., all rights reserved. 4
- 5. Equity Research Ante5, Inc. (OTCBB/OTCQB:ANFC) Financial Flexibility On May 5, 2011, the Company closed a $10 million revolving credit facility to provide working capital for drilling and production operations. The credit line will provide the Company with the necessary capital to fund its Bakken and Three Forks drilling activities. At present, the Company has no current borrowings under the facility and no other debt. On July 26, 2011, the Company closed on a private placement of 6,142,500 units at a price of $1.00 per unit, with each unit consisting of one common share and a warrant to purchase one-half share of common stock at $1.50 per share. After expenses, the Company received net proceeds of approximately $5.6 million. Wells As of June 21, 2011, the Company was actively participating (producing, completing, drilling, or preparing to drill) in 20 wells and had an additional 20 wells for permitting for a total of 40 gross wells and 0.90 net wells. Source: Ante5, Inc. Investment Summary/Conclusion We are initiating coverage on Ante5 with a Buy rating. Ante5 is a low overhead E&P play running a non- operator model that provides the Company with diversification across operators and geologic areas. It also allows Ante5 to continue to add production at a low marginal cost and maintain general and administrative costs at minimal levels. This business model has been proven by multiple companies in the region, including Northern Oil and Gas (NYSE Amex: NOG). As such, an investment in Ante5 provides speculative investors with the ability to participate in the NOG story at the ground floor. Ante5’s acreage positions sit on some of the most exciting oil producing basins in the United States. In addition, Ante5 has substantial dry powder on its balance sheet with a strong cash position, no debt, and access to a $10 million revolving credit line from which it can fund its drilling schedule for the next two years. In addition, it recently raised $5.6 million (net) in a private placement. This financial flexibility will allow the Company to move quickly on opportunities as they present themselves. Please refer to important disclosures at the end of this report. Copyright © 2011 by Wall Street Resources, Inc., all rights reserved. 5
- 6. Equity Research Ante5, Inc. (OTCBB/OTCQB:ANFC) The Company’s Chairman and CEO, Bradley Berman has a strong entrepreneurial background, having launched successful businesses in a variety of opportunistic industries. In addition, Mr. Berman has significant skin in the game, owning approximately 15% of the Company’s common stock. In summary, Ante5 is a lean oil and gas play, with a very low cash burn-rate, based in one of the most prolific oil and gas basins in the country. It is run by a motivated management team with a strong track record of building businesses. It has the capital on hand to fund its well development schedule and to take advantage of strategic opportunities in order to grow its acreage positions and production rapidly over the next two years. We believe that an investment in shares of ANFC represents a compelling opportunity for speculative investors to gain exposure to the Bakken within the Williston Basin at an early stage, with tremendous upside as the Company efficiently deploys its capital into one of the most proven oil and gas producing regions in the world. Please refer to important disclosures at the end of this report. Copyright © 2011 by Wall Street Resources, Inc., all rights reserved. 6
- 7. Equity Research Ante5, Inc. (OTCBB/OTCQB:ANFC) II. CORPORATE STRATEGY Business Model Ante5 is a non-operating participant in the North Dakota Bakken and Three Forks play. The Company engages in the drilling process within operators’ drilling units that include its acreage. As a non-operator, Ante5 participates in wells on a proportionate basis according to its leasehold interest in each drilling unit that is drilled by its operating partners. Ante5 relies on its operating partners to propose, permit and engage in the drilling process. Before a well is spud, the operator is required to provide all oil and gas interest owners in the designated well unit the opportunity to participate in the drilling costs and revenues of the well on a pro-rata basis. If the owners pay their pro-rata share (participates on a heads up basis), they are entitled to their pro-rata share of production. After the well is completed, the operating partners also transport, market and account for all production. For example, if Ante5 controls leases on 128 acres in a 1,280-acre drilling unit, Ante5 would hold a 10% working interest in any well drilled in that unit and thereby proportionately share in both the costs and income generated by those wells (i.e., Ante5 would contribute 10% of well costs and benefit from 10% of well income). Companies that hold a majority interest in a drilling unit are responsible for the actual drilling and operation of the wells – they are referred to as operators. The Company’s policy is to engage and participate on a heads-up basis in substantially all, if not all, wells proposed. As a non-operator, Ante5 takes a minority rather than majority interest in its wells. This provides the Company with diversification across operators and geologic areas and gives Ante5 a highly diversified portfolio of Bakken and Three Forks wells across the Williston Basin. The benefit of a diversified mineral interest portfolio is lower operational risk on a well by well basis. An additional benefit derived from the non-operator model is that it allows Ante5 to partner with some of the most experienced and efficient operators in North Dakota. These operators invest heavily in exploration and drilling research and development. By taking a minority interest in a well, Ante5 is a direct beneficiary of this significant capital investment. A third benefit is low overhead. As a non operator, Ante5 does not bear the operating and overhead costs of its operating partners, making it a low-cost producer in the Bakken and Three Forks play. Ante5 is able to add production at a low marginal cost and maintain general and administrative costs at minimal levels. Operations Ante5’s management team plans to continue to structure its operations in a manner that minimizes overhead and relies on third-parties to supply experience and expertise necessary to exploit exploration opportunities. Management will attempt to secure the highest possible working interests in the wells in which it invests while minimizing general and administrative expenses. The Company intends to keep overhead and staff to a bare minimum and the majority of operational duties will be outsourced to consultants and independent contractors. Management believes that the operational responsibilities of the Company can be handled by its current officers and through consulting and independent contractor relationships. By minimizing general and administrative expenses, the Company can devote the largest portion of its capital to hydrocarbon investments. Please refer to important disclosures at the end of this report. Copyright © 2011 by Wall Street Resources, Inc., all rights reserved. 7
- 8. Equity Research Ante5, Inc. (OTCBB/OTCQB:ANFC) III. LEASEHOLD POSITIONS History of the Bakken Formation The Bakken Formation is a large unconventional resource that underlies most of the western portion of North Dakota and Eastern Montana. The Bakken Formation consists of three levels: Upper shale, Lower Shale, and the Middle Member, which is a dolemetic sandy layer. The Middle Member of the Bakken is flooded with oil and gas at high pressures. Montana oil production dates back to the 1950’s. By the year 2000, the entire state of Montana produced 18 million barrels of oil. Four years later, this figure doubled to 36 million barrels due almost entirely to the application of horizontal drilling in the Bakken, most particularly in the Elm Coulee Field in Richland County Montana. For years, geologists believed that there were copious oil reserves in the middle Bakken. However, attempts to drill to this layer were stymied by technological barriers that simply made the oil economically unextractable. Technological improvements with respect to horizontal drilling techniques (spurred by the high price of oil) have finally made the middle Bakken economically viable. Once large-scale drilling commenced, these wells became the largest, most productive wells in Montana, North Dakota, and in the Williston Basin. The Bakken controversy lies with how much oil has been generated, what it has sourced, and how much is ultimately recoverable. Since 2000, the predictions have been staggering. Some experts suggested that the Bakken may harbor the greatest discovery of oil in the United States since Prudhoe Bay. A draft study conducted by the late organic geochemist Leigh Price provides estimates ranging from 271 to 503 billion barrels (mean 413 billion) of potential resources in place. He believed that as much as 50% of it is recoverable, an important consideration since there are vast oil reserves in the world which are not calculated into any projections because their recovery is beyond the reach of technology and economics. To give that some perspective, all recoverable oil in the U.S. is estimated at 21.4 billion barrels. In Saudi Arabia it’s estimated at 264 billion barrels. Dr. Price’s study was conducted while he was working for the U.S. Geological Survey (USGS), but it did not receive a complete scientific peer review by the USGS and was not published as a USGS product. In April 2008, the USGS released its official assessment of oil resources in the Bakken, and although it reported a 25-fold increase in the amount of oil that could be recovered from that area compared to its 1995 estimate, the 2008 estimate was still far short of the 503 billion barrel volume cited by Dr. Price in his study. According to the assessment, North Dakota and Montana have an estimated 3.0 to 4.3 billion barrels (mean value of 3.65 billion barrels) of undiscovered, technically recoverable oil in the Bakken Formation. Currently the North Dakota Industrial Commission estimates 6.5 billion barrels of recoverable oil from the Bakken and Three Forks formations of which only 244 million barrels have been recovered to date. Please refer to important disclosures at the end of this report. Copyright © 2011 by Wall Street Resources, Inc., all rights reserved. 8
- 9. Equity Research Ante5, Inc. (OTCBB/OTCQB:ANFC) The Bakken present day Over the last five years, operators have been flocking to the Bakken and raising equity to fund aggressive land acquisition campaigns. This frenetic activity drove acreage prices from less than $500/acre to more than $8,000/acre in core areas at state land lease sales, only to be topped by M&A activity which took prices to a ceiling of nearly $10,000 per acre. As of October, 2010, there were 153 drilling rigs targeting the Bakken and Three Forks formation. Compare that to June, 2009 when there were only 36 rigs drilling (an increase of 425% in just over 16 months). Four years ago North Dakota was 9th in the U.S. in oil production at roughly 100,000 barrels a day. Today North Dakota is the 4th largest onshore oil producing state in the nation. As of the date of this report, there are approximately 184 drilling rigs in the Bakken and Three Forks Formation. Oil production - barrels per day: 1. Texas 1,100,000 2. California 560,000 3. Alaska 520,000 4. North Dakota 330,000 5. Oklahoma 188,000 Currently the Basin is producing roughly 330,000 barrels per day, but according to a report by Pritchard Capital Partners, the Basin production could be as much as 750,000 to 800,000 barrels per day by 2014. Major Oil Players in the Bakken Please refer to important disclosures at the end of this report. Copyright © 2011 by Wall Street Resources, Inc., all rights reserved. 9
- 10. Equity Research Ante5, Inc. (OTCBB/OTCQB:ANFC) Experts predict that the massive reserve potential in the Bakken shale will be a major contributor to domestic oil production through 2015. The North Dakota rig count has spiked to an all time high of 166 in January 2011 (almost a double year-over-year from 83 in January 2010) and is expected to climb to nearly 200 rigs in 2013 before flattening out. It is estimated that production from the Williston Basin will reach approximately 15% of total domestic oil supply by 2015 at just under 1.2 MMBbls/d from a mere 5% of supply in 20101. Williston Basin production is expected to climb from approximately 400 MBbls/d currently to 1.2 MMBbls/d by 2015, or a 39% CAGR. This production growth will be driven by (1) the Williston Basin rig count (based on already announced 2011 operator plans) and (2) improvements in drilling time and completion techniques. Production growth out of the Williston Basin will have considerable implications for U.S. domestic oil supply2. North Dakota Bakken North Dakota has taken over as the Williston Basin darling, growing production 200% since the beginning of 2007 to more than 350 MBbls/d. It now accounts for more than 80% of total Williston Basin production - up from just 55% in early 2007. Activity has escalated most in Mountrail County, located just east of the Nesson Anticline and home to the prolific Sanish and Parshall fields that have formed the core of the Bakken to date. The two other areas forming the epicenter of North Dakota’s production growth are McKenzie and Dunn counties–both adjacent to the Nesson Anticline. These three counties currently account for approximately two-thirds of North Dakota oil production. 1 Raymond James report titled “Energy: Stat of the Week” dated January 24, 2011 2 Raymond James report titled “Energy: Stat of the Week” dated January 24, 2011 Please refer to important disclosures at the end of this report. Copyright © 2011 by Wall Street Resources, Inc., all rights reserved. 10
- 11. Equity Research Ante5, Inc. (OTCBB/OTCQB:ANFC) Montana Bakken Montana oil production has played second fiddle to its eastern neighbor since 2007 – and currently accounts for just 18% of Williston production. Though the more mature Elm Coulee field provides the majority of current production from the state, Montana exploration could stimulate additional rig activity following recent successes. Continental announced one of its first Montana wells in May, with the Rognas well coming on at ~1,000 Boe/d on the northern edge of Elm Coulee. EOG one- upped that and announced its Ed and Paul Well in Richland County at over 2,000 Boe/d in November. Specific Counties On the right hand side is a North Dakota County map. The core four properties are considered to be Mountrail, McKenzie, Dunn, and Williams. The Fringe Four are considered to be Billings, Divide, Golden Valley, and McLean. Within the North Dakota Bakken, Ante5 controls approximately 4,779 net mineral acres in Williams County, 3,983 net mineral acres in Dunn County, and an additional 617 net mineral acres in Mountrail County3, and an additional 260 net mineral acres spread throughout other counties within Williston Basin (e.g., Billings, McKenzie, Stark, Burke, Divide and Golden Valley). 3 During the May lease sale, Mountrail County received the highest bonus at $8,300 per acre and had the highest average price per acre at approximately $6,000. Please refer to important disclosures at the end of this report. Copyright © 2011 by Wall Street Resources, Inc., all rights reserved. 11
- 12. Equity Research Ante5, Inc. (OTCBB/OTCQB:ANFC) Ante5 has significant acreage positions in Dunn and Williams counties in North Dakota. During the May lease sale, Dunn County received average bids of approximately $3,500 per acre and had a high bid of $5,900 per acre. Williams County received average bids of approximately $2,500 per acre and had a high 4 bid of $3,500 per acre . By way of comparison, in April of 2011, the Company paid $1,372 per acre ($2,685,900 in cash plus 2,302,200 shares of stock) for 3,837 net acres in Dunn County. In October of 2010, the Company paid $1,138 per acre ($2,921,540 in cash plus 4,930,098 shares of stock) for 3,652 net acres in Williams County. Competition The crude oil and natural gas industry is highly competitive. Below is a list of other relatively small oil and gas drillers operating in the Bakken. Price/Sales Book Value Total Market Company Name Ticker Stock Price P/E Multiple Multiple Multiple EV/Revenue EV/EBITDA Cap ($) (x) (x) (x) (x) ($M) Abraxas Petroleum Corp. AXAS 3.09 N/A 5.85 8.81 7.39 36.71 283 Brigham Exploration BEXP 22.71 80.8 13.9 5.3 14.4 27.2 2,660 Continental Resources CLR 48.20 87.0 7.8 4.9 8.3 18.7 8,670 GeoResources, Inc. GEOI 18.92 17.0 5.4 1.7 4.9 8.1 482 Kodiak Oil and Gas Corp KOG 4.97 N/A 26.9 3.5 29.1 2,800.0 891 Magnum Hunter Resources Corp. MHR 4.77 N/A 16.4 4.1 17.4 N/A 593 Northern Oil and Gas NOG 13.25 N/A 14.2 2.6 12.6 53.3 816 Triangle Petroleum Corp. TPLM 5.08 N/A 257.5 1.2 137.1 N/A 218 U.S. Energy Corporation USEG 2.99 N/A 3.4 0.8 3.0 21.8 81 Voyager Oil and Gas VOG 2.36 N/A 85.8 1.9 67.6 180.4 137 Whiting Petroleum WLL 43.39 17.3 3.6 2.2 4.2 6.6 5,090 Average 50.5 40.1 3.3 27.8 350.3 1810.9 Average for non-operators N/A 34.5 1.7 27.7 85.1 344.5 Source: Yahoo Finance, 08/08/11 Some of these competitors include larger companies which, in particular, may have access to greater resources, may be more successful in the recruitment and retention of qualified employees and may conduct their own refining and petroleum marketing operations. However, Ante5’s small size relative to its peers allows it to be more nimble and report significantly higher production and revenue growth than its larger cap oil and gas drillers. 4 Global Hunter Securities report titled: “Energy: Exploration and Production” dated June 3, 2011 Please refer to important disclosures at the end of this report. Copyright © 2011 by Wall Street Resources, Inc., all rights reserved. 12
- 13. Equity Research Ante5, Inc. (OTCBB/OTCQB:ANFC) V. FINANCIALS Index Revenue Breakdown Income Statement and Financial Projections Balance Sheet Statement of Cash Flows Comparison Table and Valuation Metrics Income Statement and Financial Projections Ante5 Earnings Pro Forma Model 2011 (E) 2012 (E) 2013 (E) 2014 (E) Oil and Gas sales 1,561,652 9,683,429 17,646,592 26,983,700 Operating expenses Production expenses 86,182 532,589 970,563 1,484,104 Production taxes 148,578 919,926 1,676,426 2,563,452 G&A 1,725,754 1,850,752 1,902,312 1,462,979 Depletion of oil and gas properties 402,326 2,420,857 4,411,648 6,745,925 Accretion of discount on asset retirement obligation 498 550 607 670 Depreciation and amortization 47,063 290,503 529,398 809,511 Total operating expensess 2,410,401 6,015,176 9,490,954 13,066,640 Net operating income (loss) (848,749) 3,668,253 8,155,638 13,917,060 Other income (expense) Interest expense (500,000) (1,000,000) (1,500,000) (2,000,000) Interest income 66,156 80,000 80,000 80,000 Total other income (433,844) (920,000) (1,420,000) (1,920,000) Income (loss) before provision for income taxes (1,282,593) 2,748,253 6,735,638 11,997,060 Provision for income taxes 274,300 (1,044,336) (2,559,543) (4,558,883) Net Income (Loss) (1,008,293) 1,703,917 4,176,096 7,438,177 Net Income (Loss) per share ($0.02) $0.04 $0.08 $0.14 Weighted average shares 42,489,900 46,539,900 49,914,900 52,289,900 Please refer to important disclosures at the end of this report. Copyright © 2011 by Wall Street Resources, Inc., all rights reserved. 13
- 14. Equity Research Ante5, Inc. (OTCBB/OTCQB:ANFC) Balance Sheet March 31, December 31, 2011 2010 (unaudited) (Audited) Current assets: Cash 5,672,338 8,577,610 Accounts receivable 100,721 15,840 Perpaid expenses 142,789 8,431 Current portion of contingent consideration recievable 247,000 287,000 Total current assets 6,162,848 8,888,881 Contingent considersation receivable, net of current portion and allowance 6,164,092 6,185,000 Property and equipment Oil and natural gas properties Proved properties 561,806 Unproved properties 9,578,415 4,343,389 Property and equipment 34,077 15,706 Total Property and equipment 10,174,298 4,359,095 less: accumulated depreciation, amort and depletion (52,995) (13,725) Total Property and equipment, net 10,121,303 4,345,370 Total assets 22,448,243 19,419,251 Current Liabilities Accounts payable 1,368,979 402,361 Accrued expenses 3,279 47,267 Royalties payable 320,555 323,600 Current portion of deferred tax liability 82,000 119,400 Total current liabilities 1,774,813 892,628 Asset retirement obligations 2,652 Deferred tax liability, net of current portion 2,336,700 2,573,600 Total liabilities 4,114,165 3,466,228 Stockholders' Equity Common stock 38,799 37,304 Additional paid-in capital 19,076,907 16,654,223 Subscriptions payable 7,800 Accumulated (deficit) (789,428) (738,504) Total stockholders' equity 18,334,078 15,953,023 Total liabilities and stockholders equity 22,448,243 19,419,251 Please refer to important disclosures at the end of this report. Copyright © 2011 by Wall Street Resources, Inc., all rights reserved. 14
- 15. Equity Research Ante5, Inc. (OTCBB/OTCQB:ANFC) Statement of Cash Flows For the 3 Months Ended March 31, 2011 CASH FLOWS FROM OPERATING ACTIVITIES Net (loss) (50,924) Adjustments to reconcile Depletion of oil and gas properties 36,148 Depreciation and amortization 3,122 Common stock options granted, related parties 133,099 Decrease (increase) in assets: Accounts receivable (84,881) Prepaid expenses (134,358) Contingent consideration receivable 60,908 Increase (decrease) in liabilities: Accounts payable (40,026) Accured expenses (43,868) Royalties payable (3,045) Deferred tax liability (274,300) Net cash used in operating activities (398,125) CASH FLOWS FROM INVESTING ACTIVITIES Purchases and increases in oil and gas properties (2,496,576) Purchases of property and equipment (18,371) Net cash used in investing activities (2,514,947) CASH FLOWS FROM FINANCING ACTIVITIES Proceeds from the exercise of options 7,800 Net cash provided by financing activities 7,800 NET CHANGE IN CASH (2,905,272) CASH AT BEGINNING OF PERIOD 8,577,610 CASH AT END OF PERIOD 5,672,338 Please refer to important disclosures at the end of this report. Copyright © 2011 by Wall Street Resources, Inc., all rights reserved. 15
- 16. Equity Research Ante5, Inc. (OTCBB/OTCQB:ANFC) Comparisons Price/Sales Book Value Total Market Company Name Ticker Stock Price P/E Multiple Multiple Multiple EV/Revenue EV/EBITDA Cap ($) (x) (x) (x) (x) ($M) Abraxas Petroleum Corp. AXAS 3.09 N/A 5.85 8.81 7.39 36.71 283 Brigham Exploration BEXP 22.71 80.8 13.9 5.3 14.4 27.2 2,660 Continental Resources CLR 48.20 87.0 7.8 4.9 8.3 18.7 8,670 GeoResources, Inc. GEOI 18.92 17.0 5.4 1.7 4.9 8.1 482 Kodiak Oil and Gas Corp KOG 4.97 N/A 26.9 3.5 29.1 2,800.0 891 Magnum Hunter Resources Corp. MHR 4.77 N/A 16.4 4.1 17.4 N/A 593 Northern Oil and Gas NOG 13.25 N/A 14.2 2.6 12.6 53.3 816 Triangle Petroleum Corp. TPLM 5.08 N/A 257.5 1.2 137.1 N/A 218 U.S. Energy Corporation USEG 2.99 N/A 3.4 0.8 3.0 21.8 81 Voyager Oil and Gas VOG 2.36 N/A 85.8 1.9 67.6 180.4 137 Whiting Petroleum WLL 43.39 17.3 3.6 2.2 4.2 6.6 5,090 Average 50.5 40.1 3.3 27.8 350.3 1810.9 Average for non-operators N/A 34.5 1.7 27.7 85.1 344.5 Source: Yahoo Finance, 08/08/11 We note that the best comps to use with respect to valuing shares of ANFC follow the non-operator model; these companies include Northern Oil and Gas, Voyager, and U.S. Energy Corporation. Valuation Summary Below is a summary of the different valuation techniques and estimates. Summary Table Un-weighted Weighted Value Value $ Per Share Weight $ Per Share Discounted Earnings Model $1.44 50.00% $0.72 EBITDA Analysis $4.47 50.00% $2.24 Average Valuation $2.96 100% $2.96 We note that the Company is in the early stages of drilling out the acreage under leases. As such, theses estimate may change materially due to factors such as: a change in the drilling schedule, changes in commodity prices, ability to access capital to fund drilling and land acquisitions, and changes in the reserves estimates in existing land holdings. For detail on Discounted Earnings and EBITDA multiple, please see the following section. Please refer to important disclosures at the end of this report. Copyright © 2011 by Wall Street Resources, Inc., all rights reserved. 16
- 17. Equity Research Ante5, Inc. (OTCBB/OTCQB:ANFC) Valuation Metrics Discounted Earnings Calculation Price to Earnings 12-Month Earnings Multiple Future Discount Target Year Estimate (X) Value Rate Value 2012 $0.04 25 $0.90 25% $0.81 2013 $0.08 25 $2.08 25% $1.49 2014 $0.14 25 $3.55 25% $2.03 Average: $1.44 The aforementioned projections and valuation metrics were calculated and illustrated by applying various assumptions. Based on pro forma expectations and by applying a 25 times P/E multiple with a 25% discount rate, we calculate a 12-month target value of $1.44 for ANFC’s common shares. We believe using a 25x earnings multiple is reasonable given the Company’s projected revenue growth (Three year 2011-2014 CAGR of 135%) over the next three and a half years. EBITDA Price Target Analysis EBITDA Analysis 2012 (E) 2013 (E) 2014 (E) Oil and Gas sales 9,683,429 17,646,592 26,983,700 Operating expenses Production expenses 532,589 970,563 1,484,104 Production taxes 919,926 1,676,426 2,563,452 G&A 1,850,752 1,902,312 1,462,979 Depletion of oil and gas properties 2,420,857 4,411,648 6,745,925 Accretion of discount on asset retirement obligation 550 607 670 Depreciation and amortization 290,503 529,398 809,511 Total operating expensess 6,015,176 9,490,954 13,066,640 Net operating income (loss) 3,668,253 8,155,638 13,917,060 EBITDA 3,958,756 8,685,036 14,726,571 Weighted average shares 46,539,900 49,914,900 52,289,900 EBITDA per share $0.09 $0.17 $0.28 EV/EBITDA peer group multiple (50% discount to peer group) 42.6 42.6 42.6 EV Valuation $3.62 $7.41 $11.99 Debt per share $0.21 $0.30 $0.38 Equity Valuation $3.41 $7.11 $11.61 12 month price target (discounted) $3.41 $4.53 $5.48 Average 12 month price target $4.47 Please refer to important disclosures at the end of this report. Copyright © 2011 by Wall Street Resources, Inc., all rights reserved. 17
- 18. Equity Research Ante5, Inc. (OTCBB/OTCQB:ANFC) We also look at the value of Ante5 relative to its non-operator Bakken peers on an enterprise value to EBITDA basis. Our 12 month price target is equivalent to approximately 42.6 times (50% discount to its peer group) our 2012, 2013, and 2014 EBITDA estimate of $4.0 million, $8.7 million and $14.7 million respectively. To translate from an enterprise value valuation to an equity-based valuation, we subtract out the debt (per share) and discount 2013 and 2014 back 1.5 years and 2.5 years respectively to arrive at an average equity 12-month price target of $4.47 per share. In summary, we calculate an average 12-month target price of $2.96 by weighting the discounted earnings model estimate of $1.44 (50% weighting) with our EBITDA calculation (50% weighting) of $4.47 per share. Break-up Value Based on the acreage that Ante5 controls, we estimated a break-up value purely based on recent selling prices per acre. Number of acres 9,640 Average price per acre in Dunn County $3,500 Average price per acre in Williams County $2,500 Average price per acre in Mountrail County $6,000 Acres controlled in Dunn County 3,983 Acres controlled in Williams County 4,779 Acres controlled in Mountrail County 617 Other acreage controlled 260 Average price per acre $3,000 Valuation $30,370,000 Pricing data according to Global Hunter report According to recent data from Global Hunter on the average selling price per acre in Dunn, Williams, and Mountrail counties, we calculate that the break-up value for the acreage is approximately $30.37 million. We note that this does not translate into an apples-to-apples valuation calculation, as it does not account for the producing wells in the acreage, and should only be viewed as a land-based calculation assuming the leases were sold without any associated production back to the market. Please refer to important disclosures at the end of this report. Copyright © 2011 by Wall Street Resources, Inc., all rights reserved. 18
- 19. Equity Research Ante5, Inc. (OTCBB/OTCQB:ANFC) VI. RISKS General Risk Factors Following are some general risk factors: (1) Industry fundamentals with respect to customer demand or product / service pricing could change and adversely impact expected revenues and earnings; (2) Issues relating to major competitors or market shares or new product expectations could change investor attitudes toward the sector or this stock; (3) Unforeseen developments with respect to the management, financial condition or accounting policies or practices could alter the prospective valuation; or (4) External factors that affect the U.S. economy, interest rates, the U.S. dollar or major segments of the economy could alter investor confidence and investment prospects. International investments involve additional risks such as currency fluctuations, differing financial accounting standards, and possible political and economic instability. Investment risks Commodity price swings could impact Ante5. If oil prices fall below the $40/bbl level, the economics for its projects would be stressed. All of the Company's key assets are located in the Williston Basin. If production and development in this area is interrupted (flooding, pipeline outages, etc.) this could impact the company's production, cash flow and share price negatively. Ante5 is a growth company and it may need to raise money to sustain its drilling program. Despite the company's best planning, logistical delays could occur and the production projections could be negatively impacted. The Company is exposed to regulatory and environmentally delays in some of its operating areas. Risk Factors Specific to Industry The crude oil and natural gas markets are very volatile and unpredictable. The price the Company receives for its crude oil and natural gas production heavily influences its revenue, profitability, access to capital and future rate of growth. The prices it receives for production and the levels of production depend on numerous factors beyond the Company’s control. These factors include, but are not limited to, the following: • Changes in global supply and demand for crude oil and natural gas; • The actions of the Organization of Petroleum Exporting Countries; • The price and quantity of imports of foreign crude oil and natural gas; • Political and economic conditions, including embargoes, in crude oil-producing countries or affecting other crude oil-producing activity; • The level of global crude oil and natural gas exploration and production activity; • The level of global crude oil and natural gas inventories; • Weather conditions; • Technological advances affecting energy consumption; • Domestic and foreign governmental regulations; • Proximity and capacity of crude oil and natural gas pipelines and other transportation facilities; • The price and availability of competitors’ supplies of crude oil and natural gas in captive market areas; and • The price and availability of alternative fuels. Please refer to important disclosures at the end of this report. Copyright © 2011 by Wall Street Resources, Inc., all rights reserved. 19
- 20. Equity Research Ante5, Inc. (OTCBB/OTCQB:ANFC) Lower crude oil and natural gas prices may not only decrease revenues on a per unit basis but also may reduce the amount of crude oil and natural gas that can be produced economically and therefore potentially lower reserve bookings. A substantial or extended decline in crude oil or natural gas prices may result in impairments of proved crude oil and natural gas properties and may materially and adversely affect the Company’s future business, financial condition, results of operations, liquidity or ability to finance planned capital expenditures. Risk Factors Specific to Company Competition Risk Oil and natural gas exploration is intensely competitive and involves a high degree of risk. In its efforts to acquire oil and natural gas producing properties, Ante5 competes with other companies that have greater resources. Many of these companies not only explore for and produce oil and natural gas, but also conduct refining and petroleum marketing operations on a worldwide basis. The Company’s ability to compete for oil and natural gas producing properties will be affected by the available capital and available information. The Company will also face competition from alternative fuel sources and technologies. Execution Risk As with any early stage company implementing an aggressive growth plan, Ante5’ success or failure will depend on management’s ability to execute their business plan in an efficient and timely manner. Financial Risk The Company is dependent on continued financing from outside investors due to recurring operating losses. As a result, the Company’s ability to continue as a going concern could depend upon its ability to obtain the necessary financing to meet its obligations and repay its liabilities arising from normal business operations when they become due and to generate profitable operations in the future. There can be no assurance that any funding would be attainable or attainable on favorable terms, thus investors should be financially capable of losing all or a portion of their investment. Key Management Risk Management’s skill and experience is a key determinant of success. Ante5, like most small companies, is heavily dependent on key management, the loss of any of which could seriously, adversely affect the company. Micro-capital Investment Risk Micro-capital investing involves inherent risk and investors should carefully research any company considered for investment. Micro-capital companies are usually early in their market cycle and vulnerable to significant price volatility. Please refer to important disclosures at the end of this report. Copyright © 2011 by Wall Street Resources, Inc., all rights reserved. 20
- 21. Equity Research Ante5, Inc. (OTCBB/OTCQB:ANFC) Non-Specific Market Risks (Liquidity, trading rules & BD restrictions) Ante5’s common stock is quoted on the Over-the-Counter (“OTCBB”) as such; there is only a limited trading market for its common stock. As a result, the Company’s common stock is subject to the penny stock rules by the Securities and Exchange Commission that requires brokers to provide extensive disclosure to its customers prior to executing trades in penny stocks, and as such there may be a reduction in the trading activity of its common stock. As a result, investors may find it difficult to sell their shares of the Company’s common stock. Risk Categories WSR’s investment universe revolves around undiscovered emerging growth companies that possess higher risk profiles than established “blue chip” companies. Presently WSR maintains three risk categories including growth, aggressive growth and speculative with the later assigned to higher risk companies. Growth – Lower risk investment relative to small capital company investments with a defined revenue pattern, reasonable earnings predictability and sound balance sheet. Aggressive Growth – Average to higher risk investment relative to small capital company investments in a high growth stage or industry. May have limited history of generating revenue or be operating in a highly competitive or rapidly changing environment. Investors must have the financial capacity to lose a significant portion of his or her investment. Speculation - High risk investment with short or unprofitable operating history and limited revenue or earnings predictability. Companies are typically early stage and in the process of commercializing a new and often potentially disruptive technology into a large market. Investors must have the financial capacity to lose his or her entire investment. Please refer to important disclosures at the end of this report. Copyright © 2011 by Wall Street Resources, Inc., all rights reserved. 21
- 22. Equity Research Ante5, Inc. (OTCBB/OTCQB:ANFC) VII. MANAGEMENT AND DIRECTORS Officers, Directors and Key Management Name Age Position Bradley Berman 40 Chief Executive Officer and Director James Moe 54 Chief Financial Officer Joshua Wert 42 Chief Operating Officer Morris Goldfarb 60 Director Benjamin Oehler 63 Director Bradley Berman, Chief Executive Officer Bradley Berman has been a director of Ante5 since the Company’s inception and served as Chairman and Chief Executive Officer since the Company entered into the oil & gas business in November of 2010. Mr. Berman’s introduction to the industry came by way of his role as a board member of Ante4, Inc. (previously, WPT), a position he held since 2004. Mr. Berman was instrumental in navigating Ante4 into a merger with Plains Energy, which resulted in the creation of Ante5 Oil & Gas, Inc. Prior to assuming the CEO role at Ante5, Mr. Berman served as President of King Show Games, Inc., a gaming development company he founded in 1998. Between 1992 and 2004, Mr. Berman worked in various capacities at Grand Casinos, Inc. and then Lakes Entertainment, Inc., achieving the position of Vice President of Gaming. Mr. Berman is a fourth generation entrepreneur - his family has launched successful businesses in a variety of opportunistic industries. James Moe, Chief Financial Officer James Moe joined Ante5 Oil & Gas in March 2011 as its Chief Financial Officer. Prior to joining the Company, Mr. Moe served as Chief Financial Officer for two companies (Northern Contours, Inc., & Trimodal, Inc.) since 2004. Between 1994 and 2003, Mr. Moe served as corporate controller for three companies, including Recovery Engineering, Inc., a high growth publicly traded company where Mr. Moe was responsible for SEC compliance. A 1985 graduate from the University of Minnesota with a degree in accounting and 4 years as a senior accountant and auditor with a CPA firm, Mr. Moe has primary responsibility at Ante5 for SEC financial reporting, accounting, audit and tax functions as well as Sarbanes Oxley compliance. Joshua Wert, Chief Operating Officer Joshua Wert has served as the Chief Operating Officer of Ante5 Oil & Gas since December 2010. Mr. Wert received his JD and MBA from the University of Minnesota in 1997. After two years as a management consultant at McKinsey & Company, Mr. Wert focused his career on high-growth companies, specializing in operational and strategic leadership. Most recently, Mr. Wert served as President of COPYCATS Media (2003-2010), where he transformed a local CD/DVD broker into the third largest U.S. media supplier to independent musicians and film makers before selling the majority of the business in 2008. Please refer to important disclosures at the end of this report. Copyright © 2011 by Wall Street Resources, Inc., all rights reserved. 22
- 23. Equity Research Ante5, Inc. (OTCBB/OTCQB:ANFC) Morris Goldfarb Morris Goldfarb has been a director of Ante5 since November 12, 2010, and a member of its audit committee and compensation committee since February 22, 2011. Mr. Goldfarb is currently the Chairman of the Board and Chief Executive Officer of G-III Apparel Group, Ltd., a public reporting company traded on the NASDAQ securities trading market. G-III was formed by Mr. Goldfarb and his father in 1974. Mr. Goldfarb took the company public in 1989 and has built it into a formidable force in the apparel marketplace with a $500 million market cap and net sales over $800 million in fiscal 2010. G-III has license agreements with, among others: Calvin Klein, Kenneth Cole, Nine West, Cole Haan, Jones Apparel, Sean John, Tommy Hilfiger, Guess?, Jessica Simpson, Levi’s and Dockers brands, and the NFL, NBA, MLB, & NHL. Mr. Goldfarb serves on a number of Boards, both public and private, including Benjamin N. Cardozo School of Law, Fashion Delivers Charitable Foundation, Inc., and is President and Director of the Leather Apparel Association. He has served on the Board of Lakes Entertainment, Inc., Grand Casinos, Park Place Entertainment, and Panasia Bank, the first Korean-American commercial bank in New Jersey, in which he was a major shareholder. Among his many honors and accomplishments, in 2002, Mr. Goldfarb was recipient of the Business Man of the Year Award presented by the Government of South Korea and more recently was chosen and honored by the UJA-Federation of New York Menswear Division as one of three outstanding business leaders in New York. Mr. Goldfarb is a partner in Hamilton House, an upscale French restaurant on The Bund, a well-known historic district in Shanghai, China. Benjamin Oehler Benjamin S. Oehler has been a director of Ante5 since November 16, 2010, and chairman of its audit committee and compensation committee since February 22, 2011. From 1999 to 2007, Mr. Oehler served as President and Chief Executive Officer of Waycrosse, Inc., a financial advisory firm for the family owners of Cargill Incorporated. While at Waycrosse, Mr. Oehler played a key role in two major growth initiatives for Cargill: the merger of Cargill’s fertilizer business into a public company which is now Mosaic, Inc., and the transformation of Cargill’s proprietary financial markets trading group into two major investment management companies: Black River Asset Management, LLC and CarVal Investors, LLC. Prior to joining Waycrosse, Mr. Oehler was an investment banker for Piper Jaffray. By the time he left Piper Jaffray in 1999, he was group head for Piper’s Industrial Growth Team. He has also played a leadership role in a number of corporate buy-outs and venture stage companies, served on corporate and non-profit boards of directors, and has been involved in the creation and oversight of foundations and charitable organizations, as well as U.S. trusts and off shore entities. Mr. Oehler has been a board member of many companies and non-profit organizations and recently completed the Stanford University Law School Directors Forum, a three-day update on key issues facing corporate directors presented by the Stanford Business School and Stanford Law School. Please refer to important disclosures at the end of this report. Copyright © 2011 by Wall Street Resources, Inc., all rights reserved. 23
- 24. Equity Research Ante5, Inc. (OTCBB/OTCQB:ANFC) VIII. CORPORATE OFFICES & ADVISORS Ante5, Inc. 10275 Wayzata Boulevard Suite 310 Minnetonka, MN 55305 952-426-1241 (Tel) Web Site: http://www.ante5oil.com Report Contact Paul Silver Wall Street Resources, Inc. 3557 SW Corporate Parkway Palm City, FL 34990 (772) 219-7525 (Tel) (772) 219-3579 (Fax) gkieft@WallStreetResources.net www.WallStreetResources.net/ante5.asp Please refer to important disclosures at the end of this report. Copyright © 2011 by Wall Street Resources, Inc., all rights reserved. 24
- 25. Equity Research Ante5, Inc. (OTCBB/OTCQB:ANFC) Disclaimer WSR Equity Research is a trademark of Wall Street Resources, Inc. ® Copyright 2011 - all rights reserved. Wall Street Resources is an emerging growth company specialist, which publishes financial reports with respect to some of the securities that it covers and provides a small capital newsletter and other financial publications on a subscription basis. The information contained in these publications is based upon sources, which we believe to be reliable, but is in no way warranted by us as to accuracy or completeness. The information contained herein is subject to change without notice, and we assume no responsibility to update the information in our financial publications. Any companies mentioned in Wall Street Resources, Inc.’s financial publications or displayed on the Wallstreetresources.net’s website are intended to be stock ideas, NOT recommendations. Please do your own research before investing. It is crucial that you at least look at current SEC filings and read the latest press releases. Information contained in our financial publications or displayed on our website, were extracted from current documents filed with the SEC, included on the company’s website obtained from other publicly available sources deemed reliable. Certain financial publications may contain forward-looking statements, particularly as related to featured company reports regarding pro forma financial statements and business expectations, within the meaning of Section 27A of the Securities Act of 1933 and Sections 21E of the Securities Exchange Act of 1934, and are subject to the safe harbor created by these sections. Any statements that express or involve discussions with respect to predictions, expectations, beliefs, plans, projections, objectives, goals, assumptions or future events or performance are not statements of historical fact and may be "forward looking statements." Forward looking statements are based on expectations, estimates and projections at the time the statements are made that involve a number of risks and uncertainties which could cause actual results or events to differ materially from those presently anticipated. Forward looking statements in this action may be identified through the use of words such as “expects’”, “will,” “anticipates,” “estimates, “believes,” or that by statements indicating certain actions “may,” “could,” or “might” occur. Actual results may differ materially from the company's expectations and estimates. These forward-looking statements are only made as of the date of their release and Wall Street Resources and the featured company do not undertake any obligation to publicly update such forward-looking statements to reflect subsequent events or circumstances. This company report should be considered as an advertisement for featured company. The purpose of these advertisements, like any advertising, is to provide coverage and awareness for the company. The information provided in these advertisements are not intended for distribution to, or use by, any person or entity in any jurisdiction or country where such distribution or use would be contrary to law or regulation or which would subject us to any registration requirement within such jurisdiction or country. We, our affiliates, and any officer, director or stockholder or any member of their families may have a position in and may from time to time purchase or sell any securities discussed in our financial publications or included in our newsletters. An employee, author, officer, or a director of the firm, or its affiliates, may serve as a director for companies mentioned in our financial publications. There may be instances when fundamental, technical, and quantitative opinions may not be in concert. Our affiliates may from time to time perform investment banking or other services for, or solicit investment banking or other business from, any company mentioned on this web site. In compliance with Section 17(b) of the Securities Act of 1933, Wall Street Resources received a 44,000 shares of restricted common stock and receives $3,000 per month for investor relations services from Ante5, Inc. Wall Street Resources, Inc. is not a Registered Broker/Dealer, Registered Investment Advisor or Financial Advisor, nor do we hold ourselves out to be. All materials presented on our website and/or financial publications released to the public through this website, e-mail or any other means of transmission are not to be regarded as investment advice and are only for informative purposes. Before making a purchase or sale of any securities featured on our website or mentioned in our financial publications, we strongly encourage and recommend consultation with a registered securities representative. This is not to be construed as a solicitation or recommendation to buy or sell securities. Wall Street Resources, Inc. is a financial publisher and not a broker/dealer or registered investment advisor, and thus all trades and actual trading, decisions are made solely by the individual investor, not by Wall Street Resources, Inc. Wall Street Resources, Inc. and/or the employees of Wall Street Resources, Inc. will not be held responsible for any losses that might occur from the use of the information provided by our featured company reports, emerging growth news services, or any other information related to Wall Street Resources, Inc. that might be acted upon by an investor. The information provided herein may be displayed and printed for your personal, noncommercial use only. You may not reproduce, retransmit, distribute, disseminate, sell, publish, broadcast or circulate the information to anyone, without the express written consent of Wall Street Resources, Inc. As with any stock, companies discussed in any of our financial publications involve a degree of investment risk and volatility, particularly micro-to-small capital companies and/or OTC-BB stocks. All investors are cautioned that they may lose all or a portion of their investment if they decide to make a purchase in any of the companies mentioned in our financial publications. Past performance of any investment mentioned in any of our financial publications is not indicative of future results. The accuracy or completeness of the information on our website or within our financial publications is only as reliable as the sources they were obtained from. The comments and opinions expressed in any of our financial publications are expressed as of the date the financial publication or featured company reports is dated and are subject to change without notice. No investor should assume that reliance on the views, opinions or recommendations contained in any of our financial publications or featured company reports will produce profitable results. Wall Street Resources, Inc. is an information provider only. We cannot control market conditions, liquidity, market shutdowns, entry and exit prices, Internet shut-downs, or fax and mail delays. All investors should only invest or trade with capital that is risk capital that they can afford to lose. You may cancel your Wall Street Resources' daily notes service at any time and receive a full, pro-rata refund for the unused portion of your subscription. If emerging growth stock investing or trading seems too risky for you, you might want to consider starting with a less aggressive form of investing, such as the regular mutual fund contributions. Analyst Certification: I, Paul Silver, hereby certify that the views expressed in this research report accurately reflect my personal views about the subject securities and issuers. About the Analyst: Mr. Silver joined Wall Street Resources in 2006 as the Director of Research. He has been in the financial services industry since 1995 and began his professional career in auditing with a Big Four accounting firm in New York City. Mr. Silver made the move to Wall Street as a sell-side research analyst for two global investment banks in New York City including Salomon Smith Barney and UBS Paine Webber. At Salomon Smith Barney he was a member of the firm’s research team covering REITs that was consistently ranked #1 by Institutional Investor magazine. Most recently, Mr. Silver worked for a private equity firm as its Chief Investment Strategist. Mr. Silver is a graduate of the College of William and Mary in Virginia with a BA in liberal arts and New York University's Stern Business School with an MBA in International Finance and Accounting. Please refer to important disclosures at the end of this report. Copyright © 2011 by Wall Street Resources, Inc., all rights reserved. 25